COL9A1 Gene Polymorphism Is Associated
with Kashin-Beck Disease in a Northwest
Chinese Han Population
Xiaowei Shi1, Feng Zhang2, Aili Lv2, Yan Wen2, Xiong Guo2*
1Center of Maternal and Child Health Care, The First Affiliated Hospital of Medical Collage of Xi’an Jiaotong University, Xi’an, Shannxi, PR of China,2School of Public Health, Health Science Center, Xi’an Jiaotong University, Key Laboratory of Environment and Gene Related Diseases of Ministry of Education, Key Laboratory of Trace Elements and Endemic Diseases of Ministry of Health, Xi’an, Shannxi, PR of China
Abstract
Objective
We sought to determine whether genomic polymorphism in collagen IX genes (COL9A) was associated with Kashin-Beck disease (KBD).
Methods
Twenty seven single nucleotide polymorphisms (SNPs) in COL9AI, COL9A2 and COL9A3 were genotyped in 274 KBD cases and 248 healthy controls using the Sequenom MassAR-RAY system. Associations between the COL9A polymorphism and KBD risk were detected using an unconditional logistic regression model. Linkage disequilibrium (LD) and haplo-types analysis were performed with the Haploview software.
Results
After Bonferroni correction, the frequency distribution of genotypes in rs6910140 in COL9A1 was significantly different between the KBD and the control groups (X2= 16.74, df= 2,P= 0.0002). Regression analysis showed that the allele“C”in SNP rs6910140 had a
significant protective effect on KBD [odds ratio (OR) = 0.49, 95% confidence interval (CI) = 0.34–0.70, P = 0.0001]. The frequencies of alleles and genotypes in rs6910140 were signifi-cantly different among subjects of different KBD stages (allele:X2= 7.82,df= 2,P= 0.02,
genotype:X2= 14.81,df= 4,P= 0.005). However, haplotype analysis did not detect any
significant association between KBD and COL9A1, COL9A2 and COL9A3.
Conclusions
We observed a significant association between rs6910140 of COL9A1 and KBD, suggest-ing a role of COL9A1 in the development of KBD.
OPEN ACCESS
Citation:Shi X, Zhang F, Lv A, Wen Y, Guo X (2015) COL9A1 Gene Polymorphism Is Associated with Kashin-Beck Disease in a Northwest Chinese Han Population. PLoS ONE 10(3): e0120365. doi:10.1371/journal.pone.0120365
Academic Editor:Yidong Bai, University of Texas Health Science Center at San Antonio, UNITED STATES
Received:November 24, 2014
Accepted:January 21, 2015
Published:March 16, 2015
Copyright:© 2015 Shi et al. This is an open access article distributed under the terms of theCreative Commons Attribution License, which permits unrestricted use, distribution, and reproduction in any medium, provided the original author and source are credited.
Data Availability Statement:All relevant data are within the paper.
Funding:This research was supported by grants from the National Natural Science Foundation of China (No. 81273007); The Foundation of Shaanxi Province of China (2011K15-06-05). The funders had no role in study design, data collection and analysis, decision to publish, or preparation of the manuscript.
Competing Interests:The authors have declared
Introduction
Kashin-Beck disease (KBD) is a chronic osteochondropathy affecting the bones and joints that is endemic to certain geographical areas. A key pathological feature of KBD is chondrocyte necrosis in the deep zone of the growth plate of cartilage and articular cartilage [1],[2]. Clinically, the disease usually presents in childhood, between 5 and 13 years of age, and mainly attacks the growth plate cartilage. KBD presents as dwarfism, very short upper limbs, and deformed and painful joints.
The etiology of KBD remains unclear. In the past 150 years, three environmental hypotheses have been proposed: selenium deficiency, mycotoxins from contaminated storage grains, and organic matter (e.g., fulvic acid or FA) in drinking water [3–5]. Recent epidemiological and ge-netic study results also suggest the interaction between environment factors and susceptibility genes might play a role in the disease[6],[7]. Certain susceptibility genes may affect susceptibili-ty to environmental factors, such as selenium deficiency or other biologic factors [8–11].
Type IX collagen, a trimer of three different gene products, a1(IX), a2 (IX) and a3 (IX) chains, are encoded by the COL9A1, COL9A2, and COL9A3 genes, is quantitatively a minor component that functions structurally by covalently cross-linking to the surface of type II colla-gen fibrils [12]. The skeletal consequences of mutations in collagen IX genes in humans and an-imals strongly suggest that the proteinmolecule is essential for the functional longevity of joint cartilages and connected with osteochondropathy[13],[14]. Mutations in collagen IX genes have been shown to cause multiple epiphyseal dysplasia (MED) in adult patients [15]. In addi-tion, a suggestive linkage has been reported between COL9A1 and hip osteoarthritis (OA) in female patients [16]. Further support for the possible role of collagen IX in OA has been ob-tained from animal studies, mice lacking the a1(IX) chains developed degenerative joint disease similar to human OA[17]. KBD has a common pathological feature, arthritic hyaline cartilage damage, with OA [7]. However, few studies have identified regions of the genome that contain genes predisposed to KBD. In this study, we evaluate for the first time the impact of genomic polymorphism of COL9A on the risk and progression of KBD.
Materials and Methods
Study population
In total, 522 unrelated Chinese Han individuals were included in this study. These individuals were collected from KBD-endemic areas of the Linyou and Yongshou counties of Shaanxi province, in northwest China. This group consisted of 274 KBD patients and 248 healthy controls. Radiographs of the right hand were taken for both the KBD patients and the healthy controls and read by veteran orthopedists. KBD was diagnosed according to the national diagnostic criteria of China (WS/T 207–2010). Patients with clinical symptoms or radiographic changes of other osteochondropathy were excluded. The healthy control was defined as no KBD and OA. The controls were randomly selected and were frequency-matched by age (53.37±10.79 years vs 51.71±17.85 years,t= 1.29,P>0.05) and sex (male/female, 125/149 vs
124/124,x2= 1,P>0.05) (Table 1), and cases were excluded if his/her first to third-degree
rela-tive had been selected. Fresh blood (5 mL) was collected from each subject. The study was per-formed in accordance with the Declaration of Helsinki and approved by the Human Ethics Committee of Xi'an Jiaotong University, PR of China. Written informed consent was also ob-tained from the subjects or their relatives.
SNP Selection
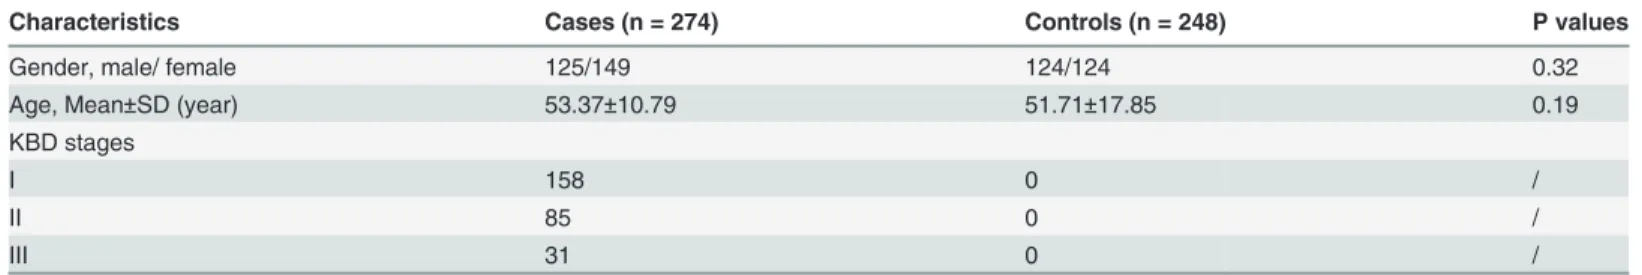
and HapMap database, and evaluated in this study. The selected SNPs were required to have a minor allele frequency (MAF)5% [21]. The information of 27 SNPs was shown inTable 2. Table 1. The characteristics of study subjects by groups.
Characteristics Cases (n = 274) Controls (n = 248) P values
Gender, male/ female 125/149 124/124 0.32
Age, Mean±SD (year) 53.37±10.79 51.71±17.85 0.19
KBD stages
I 158 0 /
II 85 0 /
III 31 0 /
doi:10.1371/journal.pone.0120365.t001
Table 2. The loci information of the 27 SNPs in COL9A1、COL9A2 and COL9A3 genes.
Gene and SNP Chromosome position Allelesa SNP location MAF HEW test (P)
COL9A1
rs592121 6:71041157 A/G exon 0.292 0.21
rs1064250 6:70983055 A/G 3'UTR 0.292 0.89
rs1135056 6:71018554 T/C exon 0.286 0.41
rs2274584 6:71018760 C/T Intron 0.127 0.14
rs3806099 6:71046424 A/G Intron 0.292 0.24
rs519068 6:71018765 T/C Intron 0.286 0.88
rs617600 6:71045633 A/C Intron 0.133 0.52
rs617985 6:71045670 C/T Intron 0.133 0.52
rs679521 6:71048909 G/C Intron 0.489 0.61
rs6928611 6:71047486 G/C Intron 0.067 0.18
rs2072650 6:71001006 C/T exon 0.071 0.93
rs12210870 6:71027222 A/G Intron 0.060 0.55
rs6910140 6:71000978 T/C exon 0.149 0.73
rs883708 6:71033259 A/G Intron 0.078 0.75
rs616642 6:71045407 A/G Intron 0.072 0.22
COL9A2
rs12077871 1:40545737 G/A exon 0.101 0.61
rs2076696 1:40544560 C/G Intron 0.304 0.95
rs209923 1:40557522 A/C Intron 0.367 0.63
rs1983658 1:40778377 T/C Intron 0.300 0.68
rs3737821 1:40540931 G/A exon 0.059 0.88
rs2075560 1:40545876 C/T Intron 0.163 0.95
rs2273195 1:40552428 G/T Intron 0.169 0.83
rs2228567 1:40773123 G/C Intron 0.085 0.17
COL9A3
rs2249766 20:60928992 T/A Intron 0.289 0.44
rs3765462 20:60938146 G/A Intron 0.125 0.21
rs741758 20:60933946 T/C Intron 0.101 0.27
rs760087 20:60938245 A/G Intron 0.429 0.27
aStands for the major/minor alleles
Genotyping analysis
Genomic DNA was extracted from the peripheral blood of the 274 KBD patients and 248 healthy controls using a blood DNA extraction kit (TIANGEN, Beijing, China). Genotyping was performed using the Sequenom MassARRAY system. Primers were designed using Seque-nom SNP Assay Design software version 3.0 for iPLEX reactions. The PCR contained: 0.8μL H2O, 0.5μL PCR buffer (20 mM MgCl2), 0.4μL 25 mM MgCl2, 0.1μL 25 mM dNTP mix, 1μL
primer mix (500 nM each), 0.5μL QC competitor, 0.5μL QA spike, 0.2μL PCR enzyme and
1μL sample DNA. The PCR was performed in a GeneAmp PCR System 9700 thermal cycler
(ABI 9700, PerkinElmer, U.S.A.) under the following conditions: denaturation at 95°C for 2 min, 45 cycles of 95°C for 30 s, 56°C for 30 s, and 72°C for 1 min, and extension at 72°C for 5 min. The PCR products were treated with a cocktail of 1.53μL H2O, 0.17μL 10×shrimp
alka-line phosphatase (SAP) buffer and 0.3μL SAP (1.7 U/m L) in a GeneAmp PCR System 9700 thermal cycler at 37°C for 40 min followed by 85°C for 5 min. The sing base extension (SBE) reaction contained 7μL of the SAP-treated PCR products and 2μL of iPLEX Pro mix (Seque-nom). The iPLEX Pro mix contained 0.2μL 10×iPLEX Pro buffer, 0.2μL iPLEX Pro termina-tion mix, 0.94μL primer mix (0.74–1.46μM, Sequenom), 0.041μL iPLEX1 enzyme, 0.5μL EXT QA spike, and 0.119μL H2O. The SBE reaction was performed in a GeneAmp PCR
Sys-tem 9700 thermal cycler under the following conditions: denaturation at 94°C for 30 s, 40 cy-cles of 94°C for 5 s and five cycy-cles of 52°C for 5 s and 80°C for 5 s, and extension at 72°C for 3 min. A total of 41μL of molecular-grade H2O and ion exchange resin (Sequenom) was then
added to each sample and the results were visualized using a MassARRAY Analyzer 4 system (Sequenom) using autorun settings.
Statistical analysis
The Hardy-Weinberg equilibrium (HWE) of each SNP was tested by the goodness-of-fitx2test to compare the expected frequencies of genotypes in controls, SNPs withP>0.05 were
consid-ered to be in HWE [22]. The Independent-Samples T test was used to determine differences ac-cording to age, and the chisquare or Fisher's exact test was performed to calculate the clinical parametric distributions. Unconditional logistic regression analysis models were used to evalu-ate the relationships between different genotypes and disease risk [Odds ratios (OR), 95% con-fidence intervals (95% CI)] adjusted by age and gender [23,24].To account for multiple testing, Bonferroni correction was applied. Significant associations were defined at p value<0.05/27 =
0.0018. [24]. Haplotypes and haplotype frequencies were calculated using Haploview software (version 4.2). Haplotypes with frequency less than 1% were combined. Statistical analysis was carried out using SPSS 17.0 for Windows. The haplotype with p value<0.05 was considered
statistically significant.
Results
Baseline characteristics
A total of 274 KBD patients and 248 age and sex matched controls were included in this study. No significant differences were observed between KBD and control group in age (53.37±10.79 vs 51.71±17.85,t= 1.29,P>0.05) and sex (male/female, 125/149 vs 124/124,x2= 1,P>0.05). In
Association of studied SNPs in genes COL9A1, COL9A2 and COL9A3
with KBD
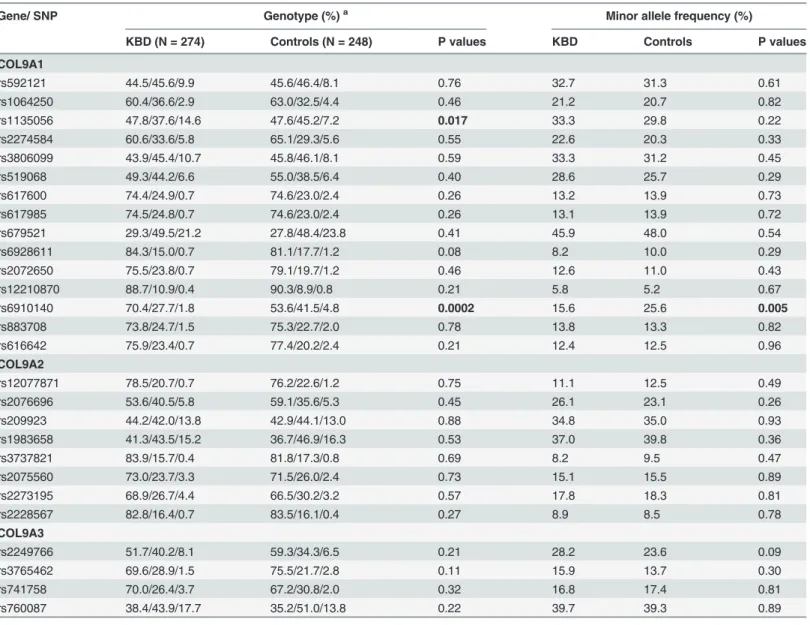
A case-control comparison of both the genotype and allele frequencies for the 27 SNPs is pre-sented inTable 3. All tested SNPs were in HWE (X2= 0.10–3.98,df= 2,P= 0.14–0.95) (Table 2). When the allele frequencies were compared between the KBD and controls, a signifi-cantX2value was detected at rs6910140 of COL9A1 gene (X2= 7.58,df= 1,P = 0.005). The dis-tribution frequencies of genotypes in rs1135056 and rs6910140 (X2= 8.12,df= 2,P= 0.017;
X2= 16.74,df= 2,P= 0.0002 respectively) were significantly different between the two groups (Table 3). However, the significant associations of allele frequency of rs6910140 and genotype frequency of rs1135056 did not survive Bonferroni correction (P>0.0018).
Table 3. Comparison of genotype and allele frequencies between cases and controls.
Gene/ SNP Genotype (%)a Minor allele frequency (%)
KBD (N = 274) Controls (N = 248) P values KBD Controls P values
COL9A1
rs592121 44.5/45.6/9.9 45.6/46.4/8.1 0.76 32.7 31.3 0.61
rs1064250 60.4/36.6/2.9 63.0/32.5/4.4 0.46 21.2 20.7 0.82
rs1135056 47.8/37.6/14.6 47.6/45.2/7.2 0.017 33.3 29.8 0.22
rs2274584 60.6/33.6/5.8 65.1/29.3/5.6 0.55 22.6 20.3 0.33
rs3806099 43.9/45.4/10.7 45.8/46.1/8.1 0.59 33.3 31.2 0.45
rs519068 49.3/44.2/6.6 55.0/38.5/6.4 0.40 28.6 25.7 0.29
rs617600 74.4/24.9/0.7 74.6/23.0/2.4 0.26 13.2 13.9 0.73
rs617985 74.5/24.8/0.7 74.6/23.0/2.4 0.26 13.1 13.9 0.72
rs679521 29.3/49.5/21.2 27.8/48.4/23.8 0.41 45.9 48.0 0.54
rs6928611 84.3/15.0/0.7 81.1/17.7/1.2 0.08 8.2 10.0 0.29
rs2072650 75.5/23.8/0.7 79.1/19.7/1.2 0.46 12.6 11.0 0.43
rs12210870 88.7/10.9/0.4 90.3/8.9/0.8 0.21 5.8 5.2 0.67
rs6910140 70.4/27.7/1.8 53.6/41.5/4.8 0.0002 15.6 25.6 0.005
rs883708 73.8/24.7/1.5 75.3/22.7/2.0 0.78 13.8 13.3 0.82
rs616642 75.9/23.4/0.7 77.4/20.2/2.4 0.21 12.4 12.5 0.96
COL9A2
rs12077871 78.5/20.7/0.7 76.2/22.6/1.2 0.75 11.1 12.5 0.49
rs2076696 53.6/40.5/5.8 59.1/35.6/5.3 0.45 26.1 23.1 0.26
rs209923 44.2/42.0/13.8 42.9/44.1/13.0 0.88 34.8 35.0 0.93
rs1983658 41.3/43.5/15.2 36.7/46.9/16.3 0.53 37.0 39.8 0.36
rs3737821 83.9/15.7/0.4 81.8/17.3/0.8 0.69 8.2 9.5 0.47
rs2075560 73.0/23.7/3.3 71.5/26.0/2.4 0.73 15.1 15.5 0.89
rs2273195 68.9/26.7/4.4 66.5/30.2/3.2 0.57 17.8 18.3 0.81
rs2228567 82.8/16.4/0.7 83.5/16.1/0.4 0.27 8.9 8.5 0.78
COL9A3
rs2249766 51.7/40.2/8.1 59.3/34.3/6.5 0.21 28.2 23.6 0.09
rs3765462 69.6/28.9/1.5 75.5/21.7/2.8 0.11 15.9 13.7 0.30
rs741758 70.0/26.4/3.7 67.2/30.8/2.0 0.32 16.8 17.4 0.81
rs760087 38.4/43.9/17.7 35.2/51.0/13.8 0.22 39.7 39.3 0.89
a Homozygote of the major allele/ heterozygote /homozygote of the minor allele.
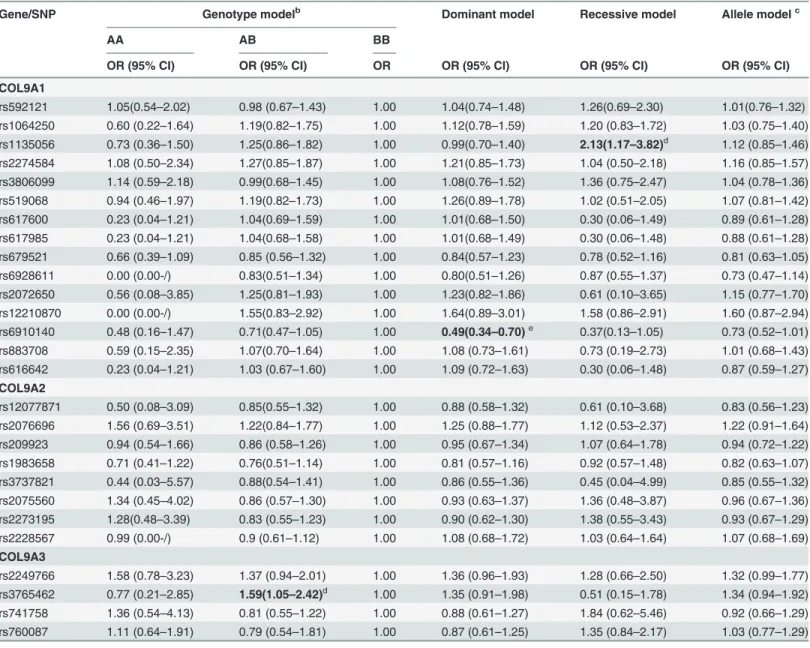
ORs and 95% CIs for KBD were calculated from unconditional logistic regression model for evaluating relative risks (Table 4). A weak association with increased KBD risk was observed among individuals with the heterozygous variant genotype (GA) at rs3765462 (adjusted OR:1.59, 95% CI: 1.05–2.42,P= 0.03), compared with the homozygous wild type (GG). Domi-nant model and recessive model were also applied for detecting association between COL9A and KBD. Adjusted ORs for rs1135056 in COL9A1 in the recessive model and rs6910140 in COL9A1 in the dominant model were statistically significant (OR = 2.13, 95% CI = 1.17–3.82,
Table 4. Analysis of association of the 27 SNPs gene polymorphism with the risk of KBDa.
Gene/SNP Genotype modelb Dominant model Recessive model Allele modelc
AA AB BB
OR (95% CI) OR (95% CI) OR OR (95% CI) OR (95% CI) OR (95% CI)
COL9A1
rs592121 1.05(0.54–2.02) 0.98 (0.67–1.43) 1.00 1.04(0.74–1.48) 1.26(0.69–2.30) 1.01(0.76–1.32) rs1064250 0.60 (0.22–1.64) 1.19(0.82–1.75) 1.00 1.12(0.78–1.59) 1.20 (0.83–1.72) 1.03 (0.75–1.40) rs1135056 0.73 (0.36–1.50) 1.25(0.86–1.82) 1.00 0.99(0.70–1.40) 2.13(1.17–3.82)d 1.12 (0.85–1.46) rs2274584 1.08 (0.50–2.34) 1.27(0.85–1.87) 1.00 1.21(0.85–1.73) 1.04 (0.50–2.18) 1.16 (0.85–1.57) rs3806099 1.14 (0.59–2.18) 0.99(0.68–1.45) 1.00 1.08(0.76–1.52) 1.36 (0.75–2.47) 1.04 (0.78–1.36) rs519068 0.94 (0.46–1.97) 1.19(0.82–1.73) 1.00 1.26(0.89–1.78) 1.02 (0.51–2.05) 1.07 (0.81–1.42) rs617600 0.23 (0.04–1.21) 1.04(0.69–1.59) 1.00 1.01(0.68–1.50) 0.30 (0.06–1.49) 0.89 (0.61–1.28) rs617985 0.23 (0.04–1.21) 1.04(0.68–1.58) 1.00 1.01(0.68–1.49) 0.30 (0.06–1.48) 0.88 (0.61–1.28) rs679521 0.66 (0.39–1.09) 0.85 (0.56–1.32) 1.00 0.84(0.57–1.23) 0.78 (0.52–1.16) 0.81 (0.63–1.05) rs6928611 0.00 (0.00-/) 0.83(0.51–1.34) 1.00 0.80(0.51–1.26) 0.87 (0.55–1.37) 0.73 (0.47–1.14) rs2072650 0.56 (0.08–3.85) 1.25(0.81–1.93) 1.00 1.23(0.82–1.86) 0.61 (0.10–3.65) 1.15 (0.77–1.70) rs12210870 0.00 (0.00-/) 1.55(0.83–2.92) 1.00 1.64(0.89–3.01) 1.58 (0.86–2.91) 1.60 (0.87–2.94) rs6910140 0.48 (0.16–1.47) 0.71(0.47–1.05) 1.00 0.49(0.34–0.70)e 0.37(0.13–1.05) 0.73 (0.52–1.01) rs883708 0.59 (0.15–2.35) 1.07(0.70–1.64) 1.00 1.08 (0.73–1.61) 0.73 (0.19–2.73) 1.01 (0.68–1.43) rs616642 0.23 (0.04–1.21) 1.03 (0.67–1.60) 1.00 1.09 (0.72–1.63) 0.30 (0.06–1.48) 0.87 (0.59–1.27)
COL9A2
rs12077871 0.50 (0.08–3.09) 0.85(0.55–1.32) 1.00 0.88 (0.58–1.32) 0.61 (0.10–3.68) 0.83 (0.56–1.23) rs2076696 1.56 (0.69–3.51) 1.22(0.84–1.77) 1.00 1.25 (0.88–1.77) 1.12 (0.53–2.37) 1.22 (0.91–1.64) rs209923 0.94 (0.54–1.66) 0.86 (0.58–1.26) 1.00 0.95 (0.67–1.34) 1.07 (0.64–1.78) 0.94 (0.72–1.22) rs1983658 0.71 (0.41–1.22) 0.76(0.51–1.14) 1.00 0.81 (0.57–1.16) 0.92 (0.57–1.48) 0.82 (0.63–1.07) rs3737821 0.44 (0.03–5.57) 0.88(0.54–1.41) 1.00 0.86 (0.55–1.36) 0.45 (0.04–4.99) 0.85 (0.55–1.32) rs2075560 1.34 (0.45–4.02) 0.86 (0.57–1.30) 1.00 0.93 (0.63–1.37) 1.36 (0.48–3.87) 0.96 (0.67–1.36) rs2273195 1.28(0.48–3.39) 0.83 (0.55–1.23) 1.00 0.90 (0.62–1.30) 1.38 (0.55–3.43) 0.93 (0.67–1.29) rs2228567 0.99 (0.00-/) 0.9 (0.61–1.12) 1.00 1.08 (0.68–1.72) 1.03 (0.64–1.64) 1.07 (0.68–1.69)
COL9A3
rs2249766 1.58 (0.78–3.23) 1.37 (0.94–2.01) 1.00 1.36 (0.96–1.93) 1.28 (0.66–2.50) 1.32 (0.99–1.77) rs3765462 0.77 (0.21–2.85) 1.59(1.05–2.42)d 1.00 1.35 (0.91–1.98) 0.51 (0.15–1.78) 1.34 (0.94–1.92) rs741758 1.36 (0.54–4.13) 0.81 (0.55–1.22) 1.00 0.88 (0.61–1.27) 1.84 (0.62–5.46) 0.92 (0.66–1.29) rs760087 1.11 (0.64–1.91) 0.79 (0.54–1.81) 1.00 0.87 (0.61–1.25) 1.35 (0.84–2.17) 1.03 (0.77–1.29)
a
Adjusted for age and gender;
bAB stands for the minor/major alleles, BB as the reference genotype; c
Major allele as the reference allele;
d
The significance did not remain after correction for multiple testing;
eThe signi
ficance remained after correction for multiple testing.
P= 0.01 and OR = 0.49, 95% CI = 0.34–0.70,P= 0.0001; respectively). But after Bonferroni cor-rection, only the SNP rs6910140 in the dominant model remained. The allele“C”of rs6910140 in COL9A1 had a significant protective effect on KBD.
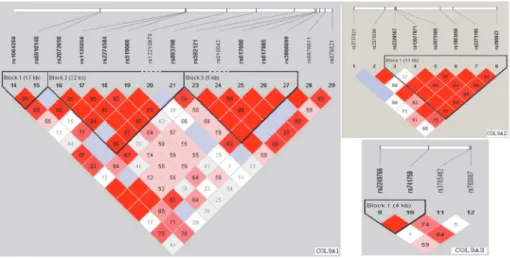
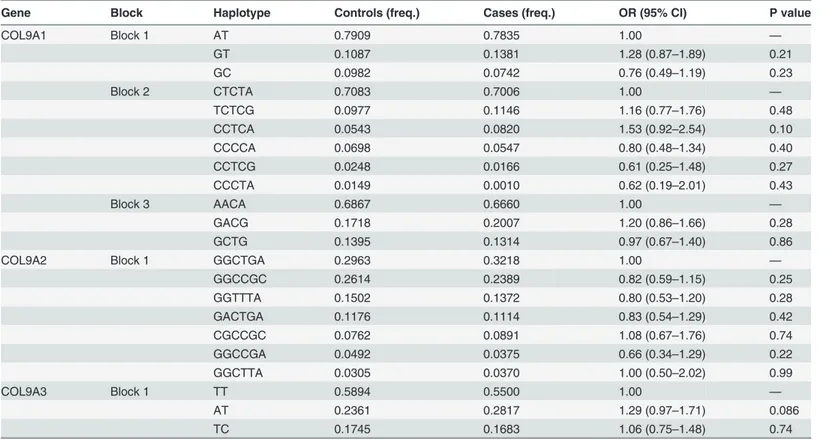
Linkage disequilibrium structure is shown inFig. 1. COL9A1 included 3 haplotype blocks, whereas COL9A2 and COL9A3 had only 1. The haplotypes of the different blocks of each gene were calculated as shown inTable 5. The most frequent haplotype was used as reference, haplo-type analysis of genes COL9A1、COL9A2 and COL9A3 did not detected any significant associ-ation with KBD (Table 5).
Association of polymorphisms of COL9A1 with the severity of KBD
It is not clear whether rs6910140 contributes to the severity of KBD. The association of rs6910140 in COL9A1 with the severity of KBD was monitored in the KBD group.Table 6 showed the distribution of alleles and genotypes for the subjects of the different KBD stages, the frequencies of genotypes and alleles in rs6910140 were significantly different among sub-jects of the three KBD stages. For the number of KBD patients with rs6910140 CC was very limited, dominant and recessive models were also applied to rectify this, the results showed an association of rs6910140 with the severity of KBD in dominant model (Table 6). Our findings showed rs6910140 in COL9A1 is related to the severity of KBD, and the wild type allele“C”
has a significant decreasing effect on the severity of KBD.
Discussion
The etiology of KBD remains unclear, genetic factors may particularly account for an individu-al’s susceptibility to KBD [6]. KBD and OA have similar pathological characteristics, such as chondrocyte necrosis and apoptosis, matrix degradation, and cartilage degeneration accompa-nied by absorption and repair [1], and mostly result in a secondary chronic osteoarthropathy [25]. The electron microscopic analysis have confirmed the chondrocyte necrosis and revealed a reduction in the collagen fibril diameter, and a loss of the fibril banding patterns in the carti-lage matrix of the KBD patients [26].The role of type IX collagen in the degradative events in-voked in the cartilage and bone of arthritic joints has long been appreciated. Several reports have suggested that the polymorphism of genes encoding collagen IX is associated with the risk Fig 1. The haplotype blocks of the three studied genes: COL9A1, COL9A2 and COL9A3.The numbers indicate the extent of linkage disequilibrium based on D’value between 2 SNPs calculated with Haploview 4.2
of osteoarthropathy [14],[27]. However, no study has been conducted to investigate the rela-tionship between KBD and COL9A. In this study, we selected twenty-seven SNPs from COL9A and performed an association analysis between COL9A and KBD.
In the present study, fifteen SNPs in COL9A1 were included to investigate the association between the gene COL9A1 and risk of KBD in the Chinese Han population. The distribution frequencies of genotypes in rs6910140 were significantly different between the two groups. The subjects carrying allele“C”have lower risk of KBD than the subjects without carrying allele
“C”. Additional analysis showed that rs6910140 was significantly associated with the clinical diagnose of KBD stages. These results suggest that polymorphism of the COL9A1 plays an im-portant role in the risk and severity of KBD in the Chinese Han population. Gene COL9A1 Table 5. Results of the haplotype analysis for the genes COL9A1、COL9A2 and COL9A3.
Gene Block Haplotype Controls (freq.) Cases (freq.) OR (95% CI) P value
COL9A1 Block 1 AT 0.7909 0.7835 1.00 —
GT 0.1087 0.1381 1.28 (0.87–1.89) 0.21
GC 0.0982 0.0742 0.76 (0.49–1.19) 0.23
Block 2 CTCTA 0.7083 0.7006 1.00 —
TCTCG 0.0977 0.1146 1.16 (0.77–1.76) 0.48
CCTCA 0.0543 0.0820 1.53 (0.92–2.54) 0.10
CCCCA 0.0698 0.0547 0.80 (0.48–1.34) 0.40
CCTCG 0.0248 0.0166 0.61 (0.25–1.48) 0.27
CCCTA 0.0149 0.0010 0.62 (0.19–2.01) 0.43
Block 3 AACA 0.6867 0.6660 1.00 —
GACG 0.1718 0.2007 1.20 (0.86–1.66) 0.28
GCTG 0.1395 0.1314 0.97 (0.67–1.40) 0.86
COL9A2 Block 1 GGCTGA 0.2963 0.3218 1.00 —
GGCCGC 0.2614 0.2389 0.82 (0.59–1.15) 0.25
GGTTTA 0.1502 0.1372 0.80 (0.53–1.20) 0.28
GACTGA 0.1176 0.1114 0.83 (0.54–1.29) 0.42
CGCCGC 0.0762 0.0891 1.08 (0.67–1.76) 0.74
GGCCGA 0.0492 0.0375 0.66 (0.34–1.29) 0.22
GGCTTA 0.0305 0.0370 1.00 (0.50–2.02) 0.99
COL9A3 Block 1 TT 0.5894 0.5500 1.00 —
AT 0.2361 0.2817 1.29 (0.97–1.71) 0.086
TC 0.1745 0.1683 1.06 (0.75–1.48) 0.74
doi:10.1371/journal.pone.0120365.t005
Table 6. Comparison of genotype and allele frequencies of rs6910140 in COL9A1 among subjects of different KBD stages.
KBD stages Alleles (%) Genotypes (%) Recessive model (%)
Dominant model (%)
T C TT TC CC TT+TC CC TT TC+CC
I(n = 158) 80.7 19.3 62.6 36.1 1.3 98.7 1.3 62.6 37.4
II(n = 85) 88.2 11.8 80.0 16.5 3.5 96.5 3.5 80.0 20.0
III(n = 31) 91.9 8.1 83.9 16.1 0.0 100.0 0.0 83.9 16.1
X2values 7.82 14.8 2.23 11.01
Pvalues 0.02 0.005 0.33 0.004
located on the long arm of chromosome 6. Several studies have provided evidences of associa-tion between COL9A1 gene and arthritis disease [16,28,29]. Our data also showed association between COL9A1 gene and KBD. Therefore, it is reasonable to infer that COL9A1 gene played an important role in one’s susceptibility to KBD who exposed to the same environmental. Locus rs6910140 is a non-synonymous SNP, there are limited studies for the function of rs6910140 in osteoarthropathy. Polymorphisms of rs6910140 in the COL9A1 gene may play an important role in determining the expression of a1(IX), we think it should be correlated to cartilage destruction by changing the expression of a1(IX) and related to KBD. Therefore, the α1(IX) protein expression and its effect on the risk of KBD should be explored in the
following studies.
However, our findings did not support an association between the COL9A2, COL9A3 genes and KBD in our population, even though the heterozygosity of rs3765462 in gene COL9A3 showed a weak association with an evaluated KBD risk. However, the significance did not sur-vive Bonferroni correction. Extensive studies have provided evidence for the associations be-tween the genes COL9A2, COL9A3 and osteochondropathy [19,30,31]. For example, genetic study in a Finnish population identified two polymorphisms that predict the introduction of a tryptophan (Trp) residue into the a2 (IX) or a 3(IX) chain, the Trp-encoding alleles were linked to increased risk of lumbar disc disease [30,31]. An association study performed by Japanese group found an association between a SNP in COL9A3 and knee OA [19]. In contrast, the same SNP in COL9A3 was analyzed in the Finnish population, and no association was found [20]. Our own data suggested that the selected SNPs in COL9A2, COL9A3 genes were not major susceptibility genes in our studied population. However, we should not dismiss a possi-ble association between the two genes and KBD. Our study was the first to explore the relation-ship between the polymorphisms of the selected genes and KBD, and there are also certain limitations in the study: The number of the selected SNPs was limited in genes COL9A2 and COL9A3 and the sample size was not large. Therefore the results need to be verified using well-designed, high-quality studies on well-defined populations.
In conclusion, we found that the rs6910140 in COL9A1 was associated with the susceptivity of KBD. The allele“C”of rs6910140 in COL9A1 had a significant protective effect on KBD. Further validation of the contribution of COL9A to the development of KBD in other popula-tions is warranted.
Supporting Information
S1 Dataset. Information of genotypes of cases and controls. (XLS)
Acknowledgments
For sample collection, the authors acknowledge help from the Centers for Disease Control and Prevention of Linyou and Yongshou counties. We also thank Tianbo Jin for his technical assistance.
Author Contributions
References
1. Cao J, Li S, Shi Z, Yue Y, Sun J, Chen J, et al. Articular cartilage metabolism in patients with Kashine-Beck Disease: an endemic osteoarthropathy in China. Osteoarthritis and Cartilage. 2008; 16:680–688. PMID:17945513
2. Mathieu F, Begaux F, Lan ZY, Suetens C, Hinsenkamp M. Clinical manifestations of Kashin-Beck dis-ease in Nyemo Valley, Tibet. Int Orthop. 1997; 21:151–156. PMID:9266292
3. Moreno R. Kashin–Beck osteoarthropathy in rural Tibet in relation to selenium and iodine status. N. Engl. J. Med.1998; 339: 1112–1120. PMID:9770558
4. Chasseur C, Suetens V, Michel F, Mathieu F, Begaux N, Nolard N, et al. A 4-year study of the mycologi-cal aspects of Kashin-Beck disease in Tibet. Int. Orthop. 2001; 25:154–158. PMID:11482530
5. Sudre P, Mathieu F. Kashin-Beck disease: from etiology to prevention or from prevention to etiology? Int Orthop. 2001; 25:175–179. PMID:11482536
6. Suete C, Moreno R, Chassear C, Mathieu F, Begaux F, Haubruge E, et al. Epidemiological support for a multifactorial aetiology of Kashin-Beck disease in Tibet. Intern Orthop (SICOT). 2001; 25:180–187.
7. Shi XW, Guo X, Lv AL, Kang L, Zhou YL, Zhang YZ, et al. Heritability estimates and linkage analysis of 23 short tandem repeat loci on chromosomes 2,11,and 12 in an endemic osteochondropathy in China. Scand J Rheumatol.2010; 39: 259–265. doi:10.3109/03009740903270599PMID:20166850
8. Wang S, Duan Ch, Zhang F, Ma WJ, Guo X. Regulatory gene networks and signaling pathways from primary osteoarthritis and Kashin–Beck disease, an endemic osteoarthritis, identified by three analysis software. Gene. 2013; 512: 89–96. doi:10.1016/j.gene.2012.10.006PMID:23069848
9. Zhang F, Guo X, Wang WZ, Yan H, Li CY. Genome-wide gene expression analysis suggests an impor-tant role of hypoxia in the pathogenesis of endemic osteochondropathy Kashin-Beck Disease. PLoS ONE. 2011; 6: e22983. doi:10.1371/journal.pone.0022983PMID:21829570
10. Zhao QM, Guo X, Lai JH, Tan WH, Wang WZ, Dang XQ. Association of TNF-αand Fas gene promoter polymorphism with the risk of Kashin-Beck disease in Northwest Chinese population. Clin Rheumatol. 2012; 31:1051–1057. doi:10.1007/s10067-012-1975-7PMID:22431252
11. Shi XW, Guo X, Ren FL, Li J, Wu XM. The effect of short tandem repeat loci and low selenium levels on endemic osteoarthritis in China. J Bone Joint Surg Am. 2010; 92:72–80. doi:10.2106/JBJS.H.00502 PMID:20048098
12. Mendler M, Eich-Bender SG, Vaughan L, Winterhalter KH, Bruckner P. Cartilage contains mixed fibrils of collagen types II, IX, and XI. J. Cell. Biol. 1989; 108:191–197. PMID:2463256
13. Bönnemann CG, Cox GF, Shapiro F, Wu JJ, Feener CA, Thompson TG, et al. A mutation in the alpha 3 chain of type IX collagen causes autosomal dominant multiple epiphyseal dysplasia with mild myopa-thy. Proc Natl.Acad. Sci. USA. 2000; 97: 1212–1217. PMID:10655510
14. Czarny-Ratajczak M, Lohiniva J, Rogala P, Kozlowski K, Perälä M, Carter L, et al. A mutation in COL9A1 causes multiple epiphyseal dysplasia: further evidence for locus heterogeneity. Am. J. Hum. Genet. 2001; 69: 969–980. PMID:11565064
15. Lohiniva J, Paassilta P, Seppänen U, Vierimaa O, Kivirikko S, Ala-Kokko L, et al. Splicing mutations in the COL3 domain of collagen IX cause multiple epiphy-seal dysplasia. Am J Med Genet. 2000; 90:216–222. PMID:10678658
16. Mustafa Z, Chapman K, Irven C, Carr AJ, Clipsham K, Chitnavis J, et al. Linkage analysis of candidate genes as susceptibility loci for osteoarthritis-suggestive linkage of COL9A1 to female hip osteoarthritis. Rheuma-tology (Oxford). 2000; 39: 299–306.
17. Fassler R, Schnegelsberg PN, Dausman J, Shinya T, Muragaki Y, McCarthy MT, et al. Mice lacking a1 (IX) collagen develop noninflammatory degenerative joint disease. Proc Natl Acad Sci USA.1994; 91: 5070–5074. PMID:8197187
18. Seki S, Kawaguchi Y, Mori M, Mio F, Chiba K, Mikami Y, et al. Association study of COL9A2 with lumbar disc disease in the Japanese population. J Hum Genet. 2006; 51: 1063–1067. PMID:17024315
19. Ikeda T, Mabuchi A, Fukuda A, Kawakami A, Ryo Y, Yamamoto S, et al. Association analysis of single nucleotide polymorphisms in cartilage-specific collagen genes with knee and hip osteoarthritis in the Japanese population. J Bone Miner Res. 2002; 17: 1290–1296. PMID:12096843
20. Jakkula E, Melkoniemi M, Kiviranta I, Lohiniva J, Räinä SS, Perälä M, et al. The role of sequence varia-tions within the genes encoding collagen II, IX and XI in non-syndromic,early-onset osteoarthritis.Oste-oarthritis Cartilage. 2005; 13: 497–507. PMID:15922184
22. Zhou J, Huang Y, Huang RS, Wang F, Xu L, Le Y, et al. A case-control study provides evidence of as-sociation for a common SNP rs974819 in PDGFD to coronary heart disease and suggests a sex-depen-dent effect. Thromb Res. 2012; 130: 602–606. doi:10.1016/j.thromres.2012.05.023PMID:22704460
23. Sham PC, Curtis D. Monte Carlo tests for associations between disease and alleles at highly polymor-phic loci. Ann Hum Genet. 1995; 59: 97–105. PMID:7762987
24. Rouault K, Scotet V, Autret S, Gaucher F, Dubrana F, Tanguy D, et al. Do HOXB9 and COL1A1 genes play a role in congenital dislocation of the hip? Study in a Caucasian population. Osteoarthritis Carti-lage. 2009; 17: 1099–1105. doi:10.1016/j.joca.2008.12.012PMID:19341834
25. Guo X, Ma WJ, Zhang F, Ren FL, Qu CJ, Lammi MJ. Recent advances in the research of an endemic osteochond ropathy in China: Kashin-Beck disease. Osteoarthritis and Cartilage. 2014; 12: 1774– 1783.
26. Zhang GQ, Liu JX, Yu JY, Shi YX, Zhang SJ. Ultrastructure of chondrocytes in articular cartilage of Kashin-Beck disease.Chin J Endemiol. 1989; 8: 27–30.
27. Jackson GC, Marcus-Soekarman D, Stolte-Dijkstra I, Verrips A, Taylor JA, Briggs MD. Type IX collagen gene mutations can result in multiple epiphyseal dysplasia that is associated with osteochondritis dis-secans and a mild myopathy. Am J Med Genet A. 2010; 152: 863–869.
28. Videman T, Saarela J, Kaprio J, Näkki A, Levälahti E, Gill K, et al. Associations of 25 structural, degra-dative, and inflammatory candidate genes with lumbar disc desiccation, bulging, and height narrowing. Arthritis Rheum. 2009; 60: 470–481. doi:10.1002/art.24268PMID:19180518
29. Carlsen S, Nandakumar KS, Holmdahl R. Type IX collagen deficiency enhances the binding of carti-lage-specific antibodies and arthritis severity. Arthritis Res Ther. 2006; 8: R102. PMID:16813664
30. Annunen S, Paassilta P, Lohiniva J, Perälä M, Pihlajamaa T, Karppinen J, et al. An allele of COL9A2 associated with intervertebral disc disease. Science. 1999; 285: 409–412. PMID:10411504