RAGE
and
APE1
Genes in Lung Cancer among Han
Chinese
Hongming Pan1,2., Wenquan Niu3., Lan He2
, Bin Wang2, Jun Cao2, Feng Zhao1, Ying Liu1, Shen Li1, Huijian Wu1*
1School of Life Science and Biotechnology, Dalian University of Technology, Dalian, Liaoning, China,2Basic Medical Science College, Qiqihar Medical University, Qiqihar, Heilongjiang, China,3State Key Laboratory of Medical Genomics, Ruijin Hospital, Shanghai Jiao Tong University School of Medicine, Shanghai, China
Abstract
Background:Lung cancer is the leading cause of cancer mortality in China. Given the ubiquitous nature of gene-to-gene interaction in lung carcinogenesis, we sought to evaluate five common polymorphisms from advanced glycosylation end product-specific receptor (RAGE) and apurinic/apyrimidinic endonuclease 1 (APE1) genes in association with lung cancer
among Han Chinese.
Methods and Results: 819 patients with lung cancer and 803 cancer-free controls were recruited from Qiqihar city. Genotypes of five examined polymorphisms (RAGE gene: rs1800625, rs1800624, rs2070600; APE1 gene: rs1760944,
rs1130409) were determined by ligase detection reaction method. Data were analyzed by R software and multifactor dimensionality reduction (MDR). Hardy-Weinberg equilibrium was satisfied for all five polymorphisms. Overall differences in the genotype and allele distributions were significant for rs1800625 (Pgenotype,0.0005; Pallele,0.0005), rs2070600
(Pgenotype= 0.005; Pallele= 0.004) and rs1130409 (Pgenotype= 0.009; Pallele= 0.004) polymorphisms. Haplotype C-A-A (alleles
in order of rs1800625, rs1800624 and rs2070600) ofRAGEgene was overrepresented in patients, and conferred a 2.1-fold
increased risk of lung cancer (95% confidence interval: 1.52–2.91), independent of confounding factors. Further application of MDR method to five examined polymorphisms identified the overall best interaction model including rs2070600 and rs1130409 polymorphisms. This model had a maximal testing accuracy of 64.63% and a maximal cross-validation consistency of 9 out of 10 at the significant level of 0.006.
Conclusions:Our findings demonstrated a potential interactive contribution ofRAGEandAPE1genes to the pathogenesis
of lung cancer among Han Chinese. Further studies are warranted to confirm or refute these findings.
Citation:Pan H, Niu W, He L, Wang B, Cao J, et al. (2013) Contributory Role of Five Common Polymorphisms ofRAGEandAPE1Genes in Lung Cancer among Han Chinese. PLoS ONE 8(7): e69018. doi:10.1371/journal.pone.0069018
Editor:Giuseppe Novelli, Tor Vergata University of Rome, Italy
ReceivedMarch 7, 2013;AcceptedJune 2, 2013;PublishedJuly 11, 2013
Copyright:ß2013 Pan et al. This is an open-access article distributed under the terms of the Creative Commons Attribution License, which permits unrestricted use, distribution, and reproduction in any medium, provided the original author and source are credited.
Funding:This work was supported by the National Natural Science Foundation of China (31171353, 31271500), the Ministry of Science and Technology of China (973 Program: 2011CB504201), the Project of Department of Education of Heilongjiang Province (12531780), and the Opening Project of Key Laboratory of Anti-tumor Nature Products R&D, College of Heilongjiang Province. The funders had no role in study design, data collection and analysis, decision to publish, or preparation of the manuscript.
Competing Interests:The authors have declared that no competing interests exist.
* E-mail: [email protected]
.These authors contributed equally to this work.
Introduction
Lung cancer is the leading cause of cancer mortality in China, and its escalating prevalence presents a major public health challenge [1]. To unravel the genetic underpinnings of lung cancer, a proliferating range of single-locus investigations to genome-wide scans have been undertaken; however, neither a gene nor a variant hitherto has been confirmed uniformly across ethnic groups. One compelling reason might be attributable to the lack of consideration of gene-to-gene interaction, which is increasingly recognized as an ubiquitous component in the underlying etiology of most common diseases [2]. To shed some light on this issue, we, in this study, focused on two candidate genes, advanced glycosylation end product-specific receptor (RAGE) and apurinic/apyrimidinic endonuclease 1 (APE1), to
explore their interactive association of common genetic defects with lung cancer risk.
binding activity of many transcription factors responsible for cancer promotion and progression.In vitro knock-down ofAPE1 gene was observed to enhance the killing effect of hematoporphr-phyrin derivative-mediated photodynamic therapy on non-small cell lung cancer cells [5]. As the genomic sequences ofRAGEand APE1 genes are highly polymorphic, it is of added interest to identify which genetic defect(s) might have functional potentials to affect the final bioavailability of these two genes, and thus to the pathogenesis of lung cancer.
To generate more information, we focused on five common polymorphisms from RAGE (rs1800625, rs1800624 and rs2070600) and APE1 (rs1760944 and rs1130409) genes, and investigated their individual and interactive contribution to lung cancer risk among Han Chinese.
Methods
Study Population
All study participants were of Han Chinese descent, and resided in Qiqihar city, Heilongjiang province. This was a hospital-based case-control study encompassing 819 patients with lung cancer and 803 cancer-free controls. The institutional review board of Qiqihar Medical University approved this study, and each participant provided informed written consent at enrollment.
Demographic Information
Data on age, gender, smoking, drinking, chronic obstructive pulmonary disease (COPD), and family history (within three generations) of cancer were recorded from each participant. COPD was diagnosed retrospectively. Smoking was defined as current smoking of at least one cigarette per day during the latest three months. Drinking was defined as having two or more standard drinks per week for men and one or more standard drinks per week for women during the latest three months.
Diagnostic Information
The computed tomography (CT) scans were adopted to diagnose the presence of lung cancer, which was confirmed by senior respiratory physicians. When necessary, diagnosis was further confirmed by pathological biopsy. Participants with normal CT scan results and without family history of known cancers were treated as cancer-free controls. Lung cancer was clinically classified into squamous cell cancer, adenocarcinoma, and small cell cancer.
Genotyping
Venous blood samples (2–5 mL) were collected in EDTA tubes for genomic DNA extraction (TIANamp Blood DNA Kit) and subsequent batch genotyping. Five examined polymorphisms were genotyped by the polymerase chain reaction-ligase detection reactions (PCR-LDR) method. Amplification parameters were 94uC for 2 min, 35 cycles of 94uC for 15 s, 60uC for 15 s, 72uC for 30 s, and a final extension step at 72uC for 5 min. Two specific probes and one common probe were synthesized for each polymorphism. The common probe was labeled at the 39 end with 6-carboxy-fluorescein and phosphorylated at the 59end. The reacting conditions of LDR were 94uC for 2 min, 20 cycles of 94uC for 30 s and 60uC for 3 min. After reaction, 1mL LDR reaction products were mixed with 1mL ROX passive reference and 1mL loading buffer, and then denatured at 95uC for 3 min and chilled rapidly in ice water. The fluorescent products of LDR were differentiated using ABI sequencer 377 (Applied Biosystems, USA).
Statistical Analysis
Data were statistically analyzed with the use of the open-source R software (version 2.10) available at http://www.r-project.org and multifactor dimensionality reduction (MDR) (version 2.0) available at http://sourceforge.net/projects/mdr. A priori study power was estimated using PS (Power and Sample Size Calculations) software (version 3.0).
Unpaired t-test and x2 test were used to compare continuous and categorical variables between patients and controls, respec-tively. Hardy-Weinberg equilibrium was evaluated by using a goodness-of-fit test. Logistic regression analyses were adopted under the assumptions of additive, dominant and recessive models for each polymorphism examined. Odds ratio (OR) and its corresponding 95% confidence interval (CI) were computed to quantify the association of genotypes with lung cancer risk. Statistical significance was set at P,0.05.
Haplotype frequencies and their risk prediction were calculated by Haplo.stats software developed by R software. In detail, haplo.em program was used to estimate frequencies; haplo.cc and haplo.glm programs were used to estimate OR and 95% CI according to a generalized linear model [12]. The differences in the estimated haplotype frequencies between patients and controls were based on simulated P-values. Simulated statistics are based on randomly permuting the trait and covariates and then computing the haplotype score statistics. The haplo.em, haplo.cc and haplo.glm were implemented using Haplo.stats software.
Gene-to-gene interactions were conducted by MDR method. MDR is a nonparametric (i.e., no hypothesis about the value of a statistical parameter is made) and model-free (i.e., assumes no particular inheritance model) data-mining alternative to classical logistic regression to detect and characterize nonlinear interac-tions among discrete variables [13,14]. The general idea behind MDR method is that is reduces the dimensionality of the multilocus data by pooling the combinations of genotypes that can be defined as high risk and low risk according to the case-control ratio for the specific multilocus genotype [15]. In this study, all possible combinations of one to five polymorphisms were constructed, and a Bayes classifier in the context of 10-fold cross-validation was used to estimate the testing accuracy of each best model. A single best model had maximal testing accuracy and maximal cross-validation consistency, and the latter measured the number of times of 10 divisions of the data that the best model was found. Statistical significance was evaluated using a 1000-fold permutation test to compare observed testing accuracies with those expected under the null hypothesis of null association. Permutation testing corrected for multiple testing by repeating the entire analysis on 1000 datasets that were consistent with the null hypothesis.
Results
Baseline Characteristics
Baseline characteristics of the study population are summarized in Table 1. Distributions of age, gender and family history of cancers were comparable between patients with lung cancer and controls (P.0.05). Percentages of smokers (P,0.0005) and drinkers (P,0.0005), as well as history of COPD (P,0.0005), were remarkably higher in patients than in controls.
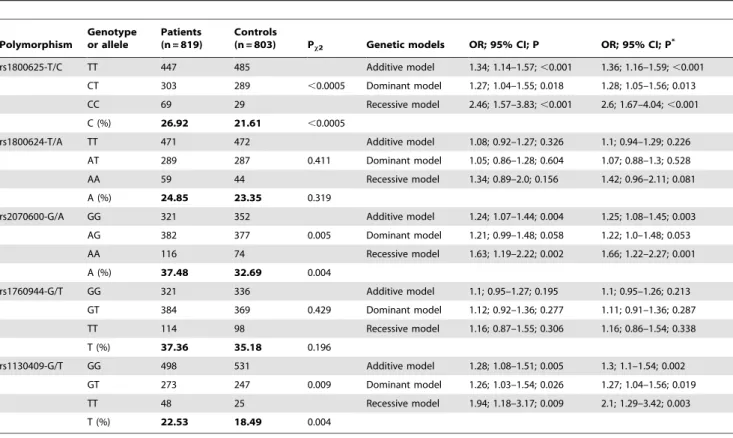
Single-locus Analysis
controls for all polymorphisms. Overall, there were significant differences in the genotype and allele distributions of rs1800625 (Pgenotype,0.0005; Pallele,0.0005), rs2070600 (Pgenotype= 0.005;
Pallele= 0.004) polymorphisms in RAGE gene and rs1130409
(Pgenotype= 0.009; Pallele= 0.004) polymorphism in APE1 gene,
and the estimated study power to detect these differences was 94.2%, 81.6% and 81.3%, respectively.
Across all genetic models, carriers of mutant allele or genotype of polymorphisms rs1800625 and rs1130409 polymorphisms were significantly associated with lung cancer risk, especially under the recessive model, even after adjusting for confounding factors. With regard to rs2070600 polymorphism, significance was merely attained under additive and recessive models.
Haplotype Analysis
Given that RAGE and APE1 genes are mapped to different chromosomes, haplotype analyses were conducted separately for each gene. Haplotype frequencies and their risk prediction for lung cancer are presented in Table 3. Frequencies of the most common haplotype in both RAGE (T-T-G in order of rs1800625, rs1800624, and rs2070600, Psim= 0.315) andAPE1(G-G in order
of rs1760944 and rs1130409, Psim= 0.084) genes were similar
between patients and controls. Compared with controls, haplotype C-A-A in RAGE gene was overrepresented in patients (Study power: 99.5%), and was associated with a 2.1-fold increased risk of lung cancer (95% CI: 1.52–2.91) before adjustment and a 2.15-fold increased risk after adjustment (95% CI: 1.55–2.97). There were no significant differences in the haplotype frequencies of APE1gene between two groups.
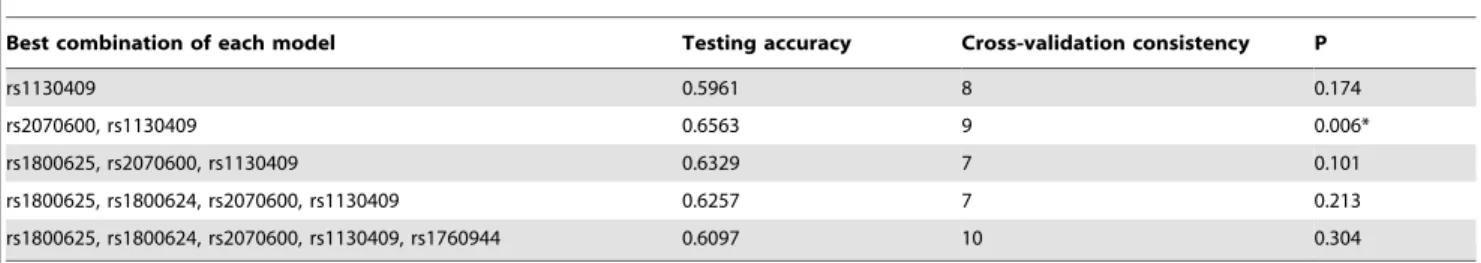
Gene-to-gene Interaction Analysis
An exhaustive MDR analysis on the possible interaction of five examined polymorphisms is summarized in Table 4. Each best model was accompanied with its testing accuracy, cross-validation consistency and significant level determined by permutation testing. The overall best MDR model encompassed polymorphism rs2070600 in RAGE gene and rs1130409 in APE1 gene. This model had a maximal testing accuracy of 64.63% and a maximal
cross-validation consistency of 9 out of 10 at the significant level of 0.006.
Discussion
In this study, we sought to investigate the association of five common polymorphisms from two candidate genes with lung cancer risk in a large Han Chinese population involving 1622 individuals. The most noteworthy finding was that genetic interaction between RAGE and APE1 genes might confer a potentially increased risk for lung cancer, which was reinforced by the results of single-locus and haplotype analyses. To the authors’ knowledge, this study represents the first so far to explore the potential interaction betweenRAGEand APE1genetic polymor-phisms in predisposition to lung cancer.
In view of potential biological candidacy, the mechanisms for the involvement of RAGE and APE1 in lung carcinogenesis remains to be elucidated. A literature search revealed little evidence on the association of RAGE gene polymorphisms with lung cancer. In a previous study by Schenk et al [9], a promoter polymorphism (T-388A) in RAGE gene was reported to be a putative risk locus for the development of non-small cell lung cancer. Extending this observation, we, in a large Han Chinese population, examined three common polymorphisms in RAGE gene and found that carriers of mutant genotypes of promoter polymorphism rs1800625 and coding polymorphism rs2070600 in 3rd exon exhibited strikingly increased risk for lung cancer, which was further potentiated by our following haplotype analyses. More recently, a systematic review of 3491 lung cancer patients and 4708 controls detected significant association of Asp148Glu (rs1130409) polymorphism with lung cancer, especially in Asian populations [16], in agreement with the results of our single-locus analyses. In this context, it is reasonable to hypothesize that genetic defects ofRAGEandAPE1genes might increase the risk of developing lung cancer.
Although the candidate gene approach cannot replace the genome-wide scan strategy in unraveling the genetic architecture of complex diseases, it is an essential alternative strategy [17], particularly when the selection of candidate genes is biologically sound, the recruited population is relatively large and homoge-neous, and the analytical methods are solid. As recommended, recruitment of 1000 individuals or more in each group is required to yield a firm conclusion [18]. Despite our sample sizes encompassing 819 patients and 803 controls does not give us this capability, given the wide differences of genetic distributions, a priori power calculation suggested that we had more than 80% power to detect the significant polymorphisms or haplotypes of realistic effect sizes. Notably in this study, all subjects were ethnically homogeneous and enrolled from Heilongjiang province, where the prevalence of lung cancer is relatively high due to the indoor air pollution from the unventilated coal-fueled stoves. Moreover, there were no deviations from the Hardy-Weinberg equilibrium for all examined polymorphisms, excluding the possibility of biased results by faulty genotyping or population stratification [19]. Further data from 1622 study participants were analyzed with statistical consideration of traditional confounders. Although residual confounding by incompletely measured or unmeasured physiologic covariates might exist, it seems unlikely that our findings might be interpreted by confounding.
To enhance the likelihood of identifying disease-causing genetic defects, we employed a promising data-mining analytical ap-proach, MDR, which is nonparametric and genetic model-free nature in design [20]. Considering the ubiquity of genetic interactions in the pathogenesis of complex diseases, the
identi-Table 1.The baseline characteristics of study population.
Characteristics
Patients (n = 819)
Controls
(n = 803) P**
Age (years) 57.35 (10.51) 57.04 (9.72) 0.846
Sex (male) 64.84% 64.76% 0.974
Smokers 36.26% 7.97% ,0.0005
Drinkers 16.85% 8.09% ,0.0005
COPD history 14.53% 4.73% ,0.0005
Family history of cancers 11.36% 10.83 0.738
Lung cancer subtypes
Squamous cell cancer 36.16% 2*
Adenocarcinoma 31.75% 2
Small cell cancer 19.79% 2
Others 12.3%
Abbreviations: COPD, chronic obstructive pulmonary disease. Data are expressed as mean (standard deviation or SD) or percentage as indicated. *data not available.
**P values were calculated by using unpaired t-test for age, and byx2 test for
fication and characterization of susceptible genes or variants require a thorough understanding of gene-to-gene interaction [21]. Using MDR model, we teased out two polymorphisms respectively fromRAGEand APE1 genes with strong interactive effect, reinforcing the results of our single-locus and haplotype analyses, and lending support for gene-to-gene interaction in the development of lung cancer. Therefore, MDR method might represent the first step in providing clues to guide further research. Interpretation of our results, however, should be viewed in light of several limitations. First, this study was retrospective in design, which precludes further comments on the cause-effect relationship [22]. Second, we only focused on five common polymorphisms, and is encouraged to examine more polymorphisms, especially the low-penetrance polymorphisms from other promising cancer-susceptibility genes, such asPTGS2andCYP2E1genes [23]. More importantly, because lung cancer is a multifactorial disease [24], characterizing the interaction of polymorphisms from different chromosomes is regarded as an effective approach to elucidate its genetic architecture. Third, the MDR method used in this study has some underling drawbacks including computational intensive-ness, indistinct interpretation, lack of sensitivity, and heterogene-ity-free assumption [20,25]. Fourth, the fact that our study participants were of Han Chinese ancestry limited the generaliz-ability of our findings, calling for further confirmation in other ethnic groups.
Despite these limitations, our results collectively demonstrated a potential interactive contribution ofRAGEandAPE1genes to the pathogenesis of lung cancer among Han Chinese. Nevertheless, for practical reasons, we hope that this study will not remain just
Table 2.Genotype distributions and allele frequencies of five examined polymorphisms between lung cancer patients and controls, as well as the risk prediction under additive, dominant and recessive genetic models.
Polymorphism
Genotype or allele
Patients (n = 819)
Controls
(n = 803) Px2 Genetic models OR; 95% CI; P OR; 95% CI; P*
rs1800625-T/C TT 447 485 Additive model 1.34; 1.14–1.57;,0.001 1.36; 1.16–1.59;,0.001
CT 303 289 ,0.0005 Dominant model 1.27; 1.04–1.55; 0.018 1.28; 1.05–1.56; 0.013
CC 69 29 Recessive model 2.46; 1.57–3.83;,0.001 2.6; 1.67–4.04;,0.001
C (%) 26.92 21.61 ,0.0005
rs1800624-T/A TT 471 472 Additive model 1.08; 0.92–1.27; 0.326 1.1; 0.94–1.29; 0.226
AT 289 287 0.411 Dominant model 1.05; 0.86–1.28; 0.604 1.07; 0.88–1.3; 0.528
AA 59 44 Recessive model 1.34; 0.89–2.0; 0.156 1.42; 0.96–2.11; 0.081
A (%) 24.85 23.35 0.319
rs2070600-G/A GG 321 352 Additive model 1.24; 1.07–1.44; 0.004 1.25; 1.08–1.45; 0.003
AG 382 377 0.005 Dominant model 1.21; 0.99–1.48; 0.058 1.22; 1.0–1.48; 0.053
AA 116 74 Recessive model 1.63; 1.19–2.22; 0.002 1.66; 1.22–2.27; 0.001
A (%) 37.48 32.69 0.004
rs1760944-G/T GG 321 336 Additive model 1.1; 0.95–1.27; 0.195 1.1; 0.95–1.26; 0.213
GT 384 369 0.429 Dominant model 1.12; 0.92–1.36; 0.277 1.11; 0.91–1.36; 0.287
TT 114 98 Recessive model 1.16; 0.87–1.55; 0.306 1.16; 0.86–1.54; 0.338
T (%) 37.36 35.18 0.196
rs1130409-G/T GG 498 531 Additive model 1.28; 1.08–1.51; 0.005 1.3; 1.1–1.54; 0.002
GT 273 247 0.009 Dominant model 1.26; 1.03–1.54; 0.026 1.27; 1.04–1.56; 0.019
TT 48 25 Recessive model 1.94; 1.18–3.17; 0.009 2.1; 1.29–3.42; 0.003
T (%) 22.53 18.49 0.004
Abbreviations: OR, odds ratio; 95% CI, 95% confidence interval. *P values were adjusted for age, gender, smoking and drinking.
Px2was calculated byx2test for differences in genotypes and alleles between patients and controls.
doi:10.1371/journal.pone.0069018.t002
Table 3.Haplotype frequencies of examined polymorphisms between lung cancer patients and controls, as well as their risk prediction.
Haplotype Patients Controls Psim OR; 95% CI OR; 95% CI*
RAGEgene (in order of rs1800625–rs1800624–rs2070600)
T-T-G 30.23% 32.95% 0.315 Reference group Reference group
T-A-G 11.74% 11.96% 0.855 1.01; 0.79–1.29 1.04; 0.82–1.32
C-T-G 17.35% 19.15% 0.259 0.99; 0.8–1.21 0.98; 0.79–1.19
C-A-G 10.19% 9.11% 0.334 1.22; 0.95–1.58 1.24; 0.96–1.59
C-A-A 7.72% 3.99% 0.009 2.1; 1.52–2.91 2.15; 1.55–2.97
T-T-A 13.12% 12.55% 0.681 1.14; 0.91–1.43 1.12; 0.89–1.41
C-T-A 7.06% 6.0% 0.259 1.29; 0.96–1.74 1.31; 0.97–1.76
APE1gene (in order of rs1760944–rs1130409)
G-G 43.24% 45.87% 0.084 Reference group Reference group
T-G 28.53% 25.94% 0.195 1.16; 0.98–1.37 1.17; 0.99–1.38
G-T 18.81% 20.17% 0.249 0.95; 0.79–1.15 0.97; 0.81–1.17
T-T 9.42% 8.02% 0.568 1.38; 1.06–1.79 1.34; 1.03–1.75
Abbreviations: OR, odds ratio; 95% CI, 95% confidence interval. Psim: simulated P-value, which was calculated based on randomly permuting the trait and covariates and then computing the haplotype score statistics.
another endpoint of research instead of a beginning to establish background data to further investigate the molecular mechanisms ofRAGEandAPE1genes in lung carcinogenesis.
Author Contributions
Conceived and designed the experiments: HP HW. Performed the experiments: HP WN. Analyzed the data: HP WN. Contributed reagents/materials/analysis tools: LH BW JC FZ YL SL. Wrote the paper: WN.
References
1. Guo S, Li X, Gao M, Li Y, Song B, et al. (2013) The Relationship between XRCC1 and XRCC3 Gene Polymorphisms and Lung Cancer Risk in Northeastern Chinese. PLoS One 8: e56213.
2. Moore JH, Williams SM (2009) Epistasis and its implications for personal genetics. Am J Hum Genet 85: 309–320.
3. de Bittencourt Pasquali MA, Gelain DP, Zeidan-Chulia F, Pires AS, Gasparotto J, et al. (2013) Vitamin A (retinol) downregulates the receptor for advanced glycation endproducts (RAGE) by oxidant-dependent activation of p38 MAPK and NF-kB in human lung cancer A549 cells. Cell Signal 25: 939–954. 4. Jing RR, Cui M, Sun BL, Yu J, Wang HM (2010) Tissue-specific expression
profiling of receptor for advanced glycation end products and its soluble forms in esophageal and lung cancer. Genet Test Mol Biomarkers 14: 355–361. 5. Yang ZZ, Li MX, Zhang YS, Xiang DB, Dai N, et al. (2010) Knock down of the
dual functional protein apurinic/apyrimidinic endonuclease 1 enhances the killing effect of hematoporphrphyrin derivative-mediated photodynamic therapy on non-small cell lung cancer cells in vitro and in a xenograft model. Cancer Sci 101: 180–187.
6. Lu J, Zhang S, Chen D, Wang H, Wu W, et al. (2009) Functional characterization of a promoter polymorphism in APE1/Ref-1 that contributes to reduced lung cancer susceptibility. FASEB J 23: 3459–3469.
7. Buckley ST, Ehrhardt C (2010) The receptor for advanced glycation end products (RAGE) and the lung. J Biomed Biotechnol 2010: 917108. 8. Shirasawa M, Fujiwara N, Hirabayashi S, Ohno H, Iida J, et al. (2004) Receptor
for advanced glycation end-products is a marker of type I lung alveolar cells. Genes Cells 9: 165–174.
9. Schenk S, Schraml P, Bendik I, Ludwig CU (2001) A novel polymorphism in the promoter of the RAGE gene is associated with non-small cell lung cancer. Lung Cancer 32: 7–12.
10. Jing R, Cui M, Wang J, Wang H (2010) Receptor for advanced glycation end products (RAGE) soluble form (sRAGE): a new biomarker for lung cancer. Neoplasma 57: 55–61.
11. Bartling B, Demling N, Silber RE, Simm A (2006) Proliferative stimulus of lung fibroblasts on lung cancer cells is impaired by the receptor for advanced glycation end-products. Am J Respir Cell Mol Biol 34: 83–91.
12. Stram DO, Leigh Pearce C, Bretsky P, Freedman M, Hirschhorn JN, et al. (2003) Modeling and E-M estimation of haplotype-specific relative risks from genotype data for a case-control study of unrelated individuals. Hum Hered 55: 179–190.
13. Pattin KA, White BC, Barney N, Gui J, Nelson HH, et al. (2009) A computationally efficient hypothesis testing method for epistasis analysis using multifactor dimensionality reduction. Genet Epidemiol 33: 87–94.
14. Hahn LW, Ritchie MD, Moore JH (2003) Multifactor dimensionality reduction software for detecting gene-gene and gene-environment interactions. Bioinfor-matics 19: 376–382.
15. Ritchie MD, Motsinger AA (2005) Multifactor dimensionality reduction for detecting gene-gene and gene-environment interactions in pharmacogenomics studies. Pharmacogenomics 6: 823–834.
16. Wei W, He XF, Qin JB, Su J, Li SX, et al. (2012) Association between the OGG1 Ser326Cys and APEX1 Asp148Glu polymorphisms and lung cancer risk: a meta-analysis. Mol Biol Rep 39: 11249–11262.
17. Yokota J, Shiraishi K, Kohno T (2010) Genetic basis for susceptibility to lung cancer: Recent progress and future directions. Adv Cancer Res 109: 51–72. 18. Cardon LR, Bell JI (2001) Association study designs for complex diseases. Nat
Rev Genet 2: 91–99.
19. Sha Q, Zhang S (2011) A test of Hardy-Weinberg equilibrium in structured populations. Genet Epidemiol 35: 671–678.
20. Gui J, Andrew AS, Andrews P, Nelson HM, Kelsey KT, et al. (2010) A simple and computationally efficient sampling approach to covariate adjustment for multifactor dimensionality reduction analysis of epistasis. Hum Hered 70: 219– 225.
21. Moore JH (2010) Detecting, characterizing, and interpreting nonlinear gene-gene interactions using multifactor dimensionality reduction. Adv Genet 72: 101–116.
22. Gu M, Dong X, Zhang X, Wang X, Qi Y, et al. (2012) Strong association between two polymorphisms on 15q25.1 and lung cancer risk: a meta-analysis. PLoS One 7: e37970.
23. Guo S, Li X, Gao M, Kong H, Li Y, et al. (2012) Synergistic association of PTGS2 and CYP2E1 genetic polymorphisms with lung cancer risk in northeastern Chinese. PLoS One 7: e39814.
24. Ihsan R, Chauhan PS, Mishra AK, Yadav DS, Kaushal M, et al. (2011) Multiple analytical approaches reveal distinct gene-environment interactions in smokers and non smokers in lung cancer. PLoS One 6: e29431.
25. Moore JH, Ritchie MD (2004) STUDENTJAMA. The challenges of whole-genome approaches to common diseases. JAMA 291: 1642–1643.
Table 4.Summary of MDR analysis.
Best combination of each model Testing accuracy Cross-validation consistency P
rs1130409 0.5961 8 0.174
rs2070600, rs1130409 0.6563 9 0.006*
rs1800625, rs2070600, rs1130409 0.6329 7 0.101
rs1800625, rs1800624, rs2070600, rs1130409 0.6257 7 0.213
rs1800625, rs1800624, rs2070600, rs1130409, rs1760944 0.6097 10 0.304