Submitted 4 March 2015 Accepted 16 June 2015 Published23 July 2015 Corresponding author Alexey Shipunov,
Academic editor Leon Higley
Additional Information and Declarations can be found on page 6
DOI10.7717/peerj.1087 Copyright
2015 Choi et al.
Distributed under
Creative Commons CC-BY 4.0 OPEN ACCESS
All that is gold does not glitter? Age,
taxonomy, and ancient plant DNA quality
JinHee Choi, HyeJi Lee and Alexey Shipunov
Department of Biology, Minot State University, Minot, ND, USA
ABSTRACT
More than 600 herbarium samples from four distantly related groups of flowering plants were used for DNA extraction and subsequent measurements of DNA purity and concentration. We did not find any significant relation between DNA purity and the age of the sample. However, DNA yields were different between plant groups studied. We believe that there there should be no reservations about “old” samples if the goal is to extract more DNA of better purity. We argue that the older herbarium samples are the mine for the future DNA studies, and have the value not less than the “fresh” specimens.
Subjects Plant Science, Taxonomy
Keywords DNA extraction, Herbarium samples, Plantageae, Picraminaceae,Aronia, Buxineae
INTRODUCTION
Numerous museums and agencies collect millions of herbarium specimens, establishing “dry gardens” that preserve plant species diversity. To date, many of the studies related with the herbaria are morphological. However, there are a growing number of investigations where extracting of DNA from the dried samples (Savolainen et al., 1995) is done in order to investigate the evolution of plants.
The study of “ancient DNA” originated from herbarium collections, even from old ones, and has already provided many useful results which argue strongly for the preservation of museum collections. DNA from herbarium samples was used to find origins of the European potato from samples before 1850 (Ames & Spooner, 2008). DNA was successfully extracted, amplified, and sequenced from two historicalPinuscollections dated from 1811 (De Castro & Menale, 2004). Roullier and others (2013) used samples dated back to 1769 to clarify the distribution routes of sweet potato in the Oceania. The recently published research on the origin of watermelon (Chomicki & Renner, 2015) used the successfully amplified and sequenced DNA from the herbarium sample of watermelon holotype collected in 1773.
DNA and the age of sample? Is the quality of the extracted DNA generally different between taxonomic groups of plants? To answer, these questions require the significant amount of samples and the reasonable uniformity of DNA extraction conditions (Erkens et al., 2008; Neubig et al., 2014).
In our laboratory, we are currently running several taxonomic projects that necessitate the extraction of DNA from herbarium samples of multiple different lineages of plants and ages of material, namely (1) Plantagineae tribe of Plantaginaceae (Aragoa,Littorella
andPlantagos.l.), (2) suborder Buxinae (or order Buxales:Didymelesfrom Didymelaceae and all genera of Buxaceae, including the newly placedHaptanthus), (3) Picramniaceae (Picramnia,Alvaradoaand recently describedNothotalisia), and finally (4) genusAronia
from Rosaceae. These four plant lineages are dramatically different in their evolutionary origins, geography, and ecology; these differences increase our chances to reveal the reliable patterns in the results of DNA extraction. Also, we accumulated the amount of data that allows for the comprehensive statistical analysis and comparisons. Consequently, as a secondary effort, we have taken this opportunity to compare the DNA extraction results, which in turn might help to answer questions raised above.
MATERIALS AND METHODS
Overall, we used standard approaches to the DNA extraction and employed commercial DNA extraction kits. DNA was extracted using mostly a MO BIO PowerPlant DNA Isolation Kit (MO BIO Laboratories, Carlsbad, California, USA) and NUCLEOSPIN Plant II Kit (MACHEREY-NAGEL GmbH & Co. KG, D¨uren, Germany). Dry plant leaf material (typically, 0.05–0.09 g) was powdered using a sterile mortar and pestle and then generally processed in accordance with the supplied protocol. However, based on the results from Costa & Roberts (2014)and our own experience, we increased the lysis time to 30 min and used thermomixer on the slow rotation speed (350 rpm) instead of water bath. Nanodrop 1000 Spectrophotometer (Thermo Scientific, Wilmington, Delaware, USA) was used to assess the concentration and purity (the 260/280 nm ratio of absorbance) of DNA sample.
DNA concentration and purity values revealed with Nanodrop 1000 Spectrophotometer are likely not ideal tools to characterize the ultimate quality of the extracted DNA. However, in our 628 samples they worked as reliable and statistically significant predictors of the amplification and sequencing success (data not shown, but in a forthcoming complementary manuscript). Spectrophotometric DNA purity is especially useful for this purpose. Consequently, we regard them as useful tools which allow us to assess the DNA quality.
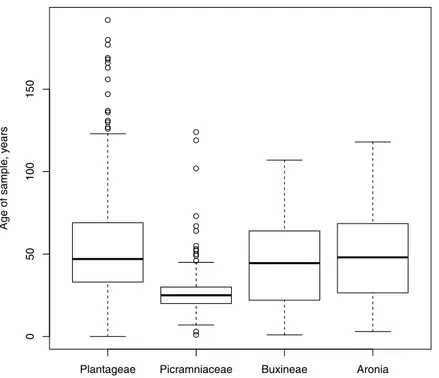
Figure 1 Box plots showing the distribution, mean and variability of the ages of our samples.The freshest samples were 3–5 years ago while the oldest was collected in 1820.
For all statistic calculations, R environment (R Core Team, 2014) was used.
RESULTS
Four studied groups of plants are not closely related. In fact, they dramatically differ in ecology and geography in morphology. Consequently, in order to better understand the results of this study, we analyzed the data in subsets of the different included plant groups and their comparisons between DNA concentration and purity and age are as follows:
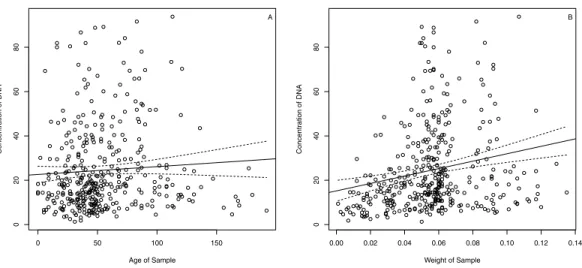
(1) Plantagineae. The statistical analysis of the available data revealed that there was no relation (Fig. 2A) between concentration of the DNA and age of sample (adjusted R-squared of the linear model= −0.001,t-testp-value for the slope=0.229). There was also no significant relation between the purity of the DNA, measured from the absorption ratio 260/280 nm, and age of sample (adjusted R-squared of linear model =0.004,t-testp-value for the slope=0.106). Naturally, there was a positive (but still weak) relation (Fig. 2B) between the concentration of the DNA and sample dry-weight prior to extraction (adjusted R-squared of linear model=0.042,t-testp-value for the slope≪0.001).
(2) Buxineae. Similarly to Plantagineae, Buxineae had no (or only weak) relation between age of the sample and the DNA purity (adjusted R-squared of linear model=0.031,
t-testp-value for the slope=0.079). Concentration of the DNA and the age of the sample were also unrelated (adjusted R-squared of linear model= −0.012,t-test
Figure 2 DNA concentration vs. sample age (A) and sample weight (B) for the Plantageae samples in this study.The dashed lines indicate 95% confidence bands.
(3) Picramniaceae. The linear model was not statistically significant (adjusted R-squared of linear model= −0.001,t-testp-value for the slope=0.34). The same was true for the concentration vs. age (adjusted R-squared of linear model=0.005,t-testp-value for the slope=0.199).
(4) Aronia. The discussed parameters were not statistically related as in the previous three cases. For purity vs. age, adjusted R-squared of linear model=0.035,t-testp-value for the slope was equal to 0.145. For concentration vs. age, adjusted R-squared of linear model=0.026 andt-testp-value for the slope=0.176.
All four groups
The average purity of DNA was different between our plant groups: while most of them are around 1.7 260/280 (1.7, 1.67 and 1.72 for Plantagineae, Buxineae andAronia, respectively), Picramniaceae yields DNA of 1.57 average purity. This is supported with Kruskal–Wallis test (p-value≪0.05). Pairwise comparison of groups (Wilcoxon tests with
Holm correction) revealed that the difference attributed to Picraminaceae was significant (p-value≪0.05) or marginally significant (p-value=0.06) with an exception ofAronia (p-value=0.20). Average ages of our samples (Fig. 1) were also different by plant group but in that case Picraminaceae samples were significantly younger (Kruskal–Wallis testp-value ≪0.05).
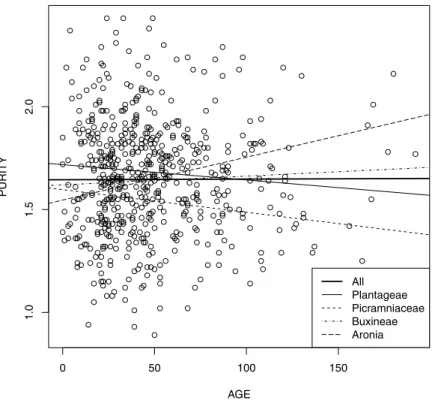
Figure 3 DNA purityvs. sample age for all four groups studied.
The comparative analysis of four linear models representing dependence of DNA purity from the relative age of sample (Fig. 3) revealed that while all intercepts were statistically different or marginally statistically different (p-values vary from 0.065 forAroniato 0.007–0.008 for other groups), slopes were not different with the exception of Buxineae (p-value=0.022). Moreover, AIC value was more optimal for the model without slopes (1535.7 vs. 1537.6). The overall significance of last model was reliable (Fisher test=3.553,
df =4 and 611,p-value≈0.01). DNA extraction kits
The comparison of two age/purity linear models, each represented one protocol (142 and 244 extractions from different samples) found that while there was a slight difference in purity (Wilcoxon testp-value=0.015), there was no significant differences between intersects and slopes of two models (allp-values>0.05).
DISCUSSION AND CONCLUSIONS
shown that the size of the extracted DNA fragments decreases with age (Erkens et al., 2008;Adams & Sharma, 2010;Neubig et al., 2014). Nevertheless, the fragment size is not the ultimate predictor of the sequencing success. Smaller (“barcoding”) DNA markers (Kuzmina & Ivanova, 2011) as well as next-gen sequencing techniques (Staats et al., 2011) decrease the importance of this relation.
Another interesting result is that differences between studied taxonomical groups exist but were restricted with purity and relative concentration of samples. Interaction between age and purity (slopes of trend lines inFig. 3) is not generally significant and therefore is not constrained taxonomically. This proves our hypothesis that non-significance of purity/age relation is the general phenomenon. Also, two commercial protocols used did not influence this dependence.
While the observed features ofAronia(non-significance of many comparisons and visually positive purity/age slope) are probably results of under-sampling (35 samples only), the significantly lower quality of Picramniaceae DNA begs explanation. Most likely, it is due to the complicated collection conditions (Adams, 2011): most species grow in wet tropical forests (Thomas, 2004) and therefore drying Picramniaceae samples is generally more complicated and at least longer than samples of plants from three other groups. Treatment for the pest control could be another important factor which lowered the DNA quality of the imported herbarium. There is also an evidence of the multiple secondary compounds specific for Picramniaceae (Jacobs, 2003). These compounds might also influence the final condition of the extracted DNA (S¨arkinen et al., 2012). Similar constraints were found byNeubig et al. (2014)in their investigation of DNA extracted from the variety of plant groups where some families (e.g., Melastomataceae) showed significantly lower extraction success.
In all, we believe that our research emphasizes the importance of museum collections of any age. We argue that the older herbarium samples are the mine for the future DNA studies, and have the value not less than the “fresh” specimens.
ACKNOWLEDGEMENTS
We are grateful to the curators of US, NY, HUH, MO, CAS, UC, JEPS, LE, MW and MHA herbarium collections for the permission to work with their herbarium material. We thank our colleagues from the Barcoding of Life Consortium (especially Maria Kuzmina) for the fruitful collaboration for the SAPNA project, and our reviewers for their help in improving this manuscript.
ADDITIONAL INFORMATION AND DECLARATIONS
Funding
Grant Disclosures
The following grant information was disclosed by the authors: College of Art and Sciences.
Department of Biology of Minot State University. North Dakota INBRE.
Competing Interests
The authors declare there are no competing interests.
Author Contributions
• JinHee Choi performed the experiments, contributed reagents/materials/analysis tools, wrote the paper, reviewed drafts of the paper.
• HyeJi Lee performed the experiments, analyzed the data, contributed reagents/materials/analysis tools, wrote the paper, reviewed drafts of the paper.
• Alexey Shipunov conceived and designed the experiments, analyzed the data, con-tributed reagents/materials/analysis tools, wrote the paper, prepared figures and/or tables, reviewed drafts of the paper.
Data Deposition
The following information was supplied regarding the deposition of related data: Data can be downloaded from:http://ashipunov.info/shipunov/open/nanodrop.zip.
REFERENCES
Adams RP. 2011.DNA from herbarium specimens: II. Correlation of DNA degradation with
humidity.Phytologia93:351–359.
Adams RP, Sharma LN. 2010.DNA from herbarium specimens: I. Correlation of DNA size with
specimen age.Phytologia92:346–353.
Ames M, Spooner DM. 2008.DNA from herbarium specimens settles a controversy about origins
of the European potato.American Journal of Botany95:252–257DOI 10.3732/ajb.95.2.252.
Chomicki G, Renner SS. 2015. Watermelon origin solved with molecular phylogenetics
including Linnaean material: another example of museomics.New Phytologist205:526–532
DOI 10.1111/nph.13163.
Costa CM, Roberts RP. 2014.Techniques for improving the quality and quantity of DNA extracted
from herbarium specimens.Phytoneuron2014-48:1–8.
De Castro O, Menale B. 2004.PCR amplification of Michele Tenore’s historical specimens and
facility to utilize an alternative approach to resolve taxonomic problems.Taxon53:147–151
DOI 10.2307/4135500.
Dr´abkov´a L. 2014.DNA extraction from herbarium specimens. In: Besse P, ed.Molecular plant
taxonomy. New York: Springer, 69–84.
Dr´abkov´a L, Kirschner JAN, Vlˆcek ˆC. 2002.Comparison of seven DNA extraction and
amplification protocols in historical herbarium specimens of Juncaceae.Plant Molecular Biology Reporter20:161–175DOI 10.1007/BF02799431.
Erkens RH, Cross H, Maas JW, Hoenselaar K, Chatrou LW. 2008.Assessment of age and
greenness of herbarium specimens as predictors for successful extraction and amplification
Jacobs H. 2003.Comparative phytochemistry of PicramniaandAlvaradoa, genera of the newly established family Picramniaceae.Biochemical Systematics and Ecology31:773–783
DOI 10.1016/S0305-1978(02)00268-5.
Kuzmina M, Ivanova N. 2011.PCR amplification for plants and fungi.Available athttp://www.
ccdb.ca/CCDB DOCS/CCDB Amplification-Plants.pdf(accessed 6 February 2013).
Neubig KM, Whitten WM, Abbott JR, Elliott S, Soltis DE, Soltis PS. 2014.Variables affecting
DNA preservation in archival DNA specimens. In: Applequist WL, Campbell LM, eds.DNA
banking in the 21st century: proceedings of the U.S. workshop on DNA banking. St. Louis: The William L. Brown Center at the Missouri Botanical Garden, 81–136.
R Core Team. 2014.R: a language and environment for statistical computing. Vienna: R Foundation
for Statistical Computing.Available athttp://www.R-project.org/.
Roullier C, Benoit L, McKey DB, Lebot V. 2013.Historical collections reveal patterns of diffusion of sweet potato in Oceania obscured by modern plant movements and recombination.
Proceedings of the National Academy of Sciences of the United States of America110:2205–2210
DOI 10.1073/pnas.1211049110.
S¨arkinen T, Staats M, Richardson JE, Cowan RS, Bakker FT. 2012.How to open the treasure
chest? Optimising DNA extraction from herbarium specimens.PLoS ONE7(8):e43808
DOI 10.1371/journal.pone.0043808.
Samarakoon T, Wang SY, Alford MH. 2013.Enhancing PCR amplification of DNA from
recalcitrant plant specimens using a trehalose-based additive.Applications in Plant Sciences 1(1):1200236DOI 10.3732/apps.1200236.
Savolainen V, Cu´enoud P, Spichiger R, Martinez MD, Cr`evecoeur M, Manen JF. 1995.The use
of herbarium specimens in DNA phylogenetics: evaluation and improvement.Plant Systematics
and Evolution197:87–98DOI 10.1007/BF00984634.
Staats M, Cuenca A, Richardson JE, Vrielink-van Ginkel R, Petersen G, Seberg O,
Bakker FT. 2011.DNA damage in plant herbarium tissue.PLoS ONE 6(12):e28448
DOI 10.1371/journal.pone.0028448.
Telle S, Thines M. 2008.Amplification ofcox2 (∼620 bp) from 2 mg of up to 129 years old
herbarium specimens, comparing 19 extraction methods and 15 polymerases.PLoS ONE
3(10):e3584DOI 10.1371/journal.pone.0003584.
Thomas WW. 2004.Picramniaceae. In: Smith N, Mori SA, Henderson A, Stevenson DW, Heald