A Robust Protocol to Increase NimbleGen
SeqCap EZ Multiplexing Capacity to 96
Samples
Ilse M. van der Werf*, R. Frank Kooy, Geert Vandeweyer
Department of Medical Genetics, University of Antwerp, Antwerp, Belgium
Abstract
Contemporary genetic studies frequently involve sequencing of a targeted gene panel, for instance consisting of a set of genes associated with a specific disease. The NimbleGen SeqCap EZ Choice kit is commonly used for the targeted enrichment of sequencing libraries comprising a target size up to 7 Mb. A major drawback of this commercially available meth-od is the exclusive use of single-indexing, meaning that at most 24 samples can be multi-plexed in a single reaction. In case of relatively small target sizes, this will lead to excessive amounts of data per sample. We present an extended version of the NimbleGen SeqCap EZ protocol which allows to robustly multiplex up to 96 samples. We achieved this by incor-porating Illumina dual-indexing based custom adapters into the original protocol. To further extend the optimization of cost-efficient sequencing of custom target panels, we studied the effect of higher pre-enrichment pooling factors and show that pre-enrichment pooling of up to 12 samples does not affect the quality of the data. To facilitate evaluation of capture effi-ciency in custom design panels, we also provide a detailed reporting tool.
Introduction
Over the last years next-generation sequencing has been applied in many (human) genetics studies. Whole-exome sequencing is an effective technique to screen the great majority of the genes in the genome for the presence of sequence alterations in an unbiased fashion. In medical genetics, it is predominantly used to identify causal genes for genetic disorders, including neu-rodevelopmental disorders such as intellectual disability and autism spectrum disorders [1–3]. For these purposes the advantages of an unbiased candidate gene discovery outweigh the disad-vantages of incomplete coverage of the target region. Indeed, even when sequencing at high depth, a significant number of genes typically remain insufficiently covered in whole-exome se-quencing experiments [4]. When the objective is to screen a relatively limited set of known genes with absolute coverage for sequence abnormalities, such as required in routine diagnos-tics, targeted sequencing of a set of selected genes is more robust.
Among the commercially available technologies, hybridization based in-solution capture (e.g. NimbleGen SeqCap EZ (Roche, Basel, Switzerland) or SureSelect Target Enrichment (Agilent
a11111
OPEN ACCESS
Citation:van der Werf IM, Kooy RF, Vandeweyer G (2015) A Robust Protocol to Increase NimbleGen SeqCap EZ Multiplexing Capacity to 96 Samples. PLoS ONE 10(4): e0123872. doi:10.1371/journal. pone.0123872
Received:November 12, 2014
Accepted:February 23, 2015
Published:April 14, 2015
Copyright:© 2015 van der Werf et al. This is an open access article distributed under the terms of the
Creative Commons Attribution License, which permits unrestricted use, distribution, and reproduction in any medium, provided the original author and source are credited.
Data Availability Statement:All relevant data are within the paper and its Supporting Information files.
Funding:This work was funded by the Belgian National Fund for Scientific Research-Flanders (FWO) to GV and RFK and the Special Research Fund of the University of Antwerp [Bijzonder Onderzoeksfonds (BOF-IWT)] to IMvdW. The funders had no role in study design, data collection and analysis, decision to publish, or preparation of the manuscript.
ROI, and is mainly represented by the fraction of enriched DNA fragments belonging to the de-signed target. For example, the enzymatic restriction-site based HaloPlex design principle typi-cally leads to a significant extension of the captured region, measuring up to twice the original ROI [5]. As a consequence, a major proportion of sequencing capacity is lost to reads flanking the ROI. A second important aspect of enrichment efficiency is the stability of the assay. Despite frequent use of average coverage as a global quality threshold, it does not guarantee an even dis-tribution of coverage depth over the whole target region. When enrichment efficiency differs widely within the assay, high average coverage, and thus absolute sequencing capacity is needed to achieve sufficient coverage of the complete ROI. A metric to compare assay stability is the per-centage of bases in the ROI covered by a set fraction of the average base coverage (typically 0.2X). Although assay stability can vary between different assays of the same technology, ampli-con based enrichment from HaloPlex ampli-consistently has a lower stability (e.g. 90% of ROI at 0.04Xin [6]) compared to hybridization based capturing (e.g. 97.5% of ROI at 0.1Xin [7], 98.7% of ROI at 0.2Xin this study). Within the hybridization-based technologies, Nimblegen SeqCap enrichment produces a near-normal distribution of the per-base coverage, whereas Agi-lent SureSelect coverage distribution shows a heavy tail towards higher values, indicating over-representation of a significant proportion of the targets [8]. Finally, further direct comparison of Agilent and NimbleGen in-solution capture assays demonstrated a narrower insert size range and a lower inter-capture variability in coverage for NimbleGen SeqCap EZ, indicating a slightly more robust technique [8]. Based on these studies, the NimbleGen SeqCap EZ technology can be considered to have the highest target enrichment efficiency for both exome and small panel en-richment [4,8].
There is however a major downside to SeqCap EZ enrichment as the standard workflow only provides labeling of samples with single index adapters, which limits the maximum multi-plexing capacity to 24 samples per sequencing experiment. As even the capacity of the low throughput Illumina MiSeq system (Illumina, San Diego, CA, USA) by far exceeds the require-ments for multiplexing 24 samples enriched for small target sizes, this leads to excessive cover-age and unnecessary experimental costs. Using MiSeq V2 chemistry, one could sequence a target region of up to 1.6 Mb in a single multiplexed 96 sample run with 2x150 bp sequencing to obtain an average coverage of at least 30X, a commonly used cut-off for reliable variant call-ing [9]. By alleviatcall-ing the multiplexcall-ing limitation, more cost-efficient sequenccall-ing can be achieved for the kit showing the highest target enrichment efficiency of the commercially available products.
the presented protocol on the data quality through detailed coverage analysis reports and genotyping concordance.
Methods
Preparation of
‘
home-made
’
dual-index adapters and blocking oligos
The most recent dual-index adapter sequences were derived from the Illumina sequence letter [11] (Oligonucleotide sequences © 2007–2013 Illumina, Inc. All rights reserved. Derivative works created by Illumina customers are authorized for use with Illumina instruments and products only. All other uses are strictly prohibited) and ordered with HPLC purification. Re-quired modifications are a 5’-phosphate group for D7 adapters and a phosphothiorate bond between the last two nucleotides on the 3’end for D5 adapters. The lyophilized oligos were dis-solved in annealing buffer (10 mM Tris-HCl, pH8.0, 10 mM NaCl, 1 mM EDTA) to a final concentration of 200μM. By mixing each adapter pair in equal volumes (e.g. 10μl D5 + 10μl
D7), all 96 possible index combinations were prepared. Formation of the Y-shaped adapter di-mers was initiated by heating the mixtures to 95°C in a thermal cycler for 5 minutes, followed by cooling down to 4°C at a rate of 0.1°C/s. Finally, the mixtures were diluted with elution buff-er (10 mM Tris-HCl, pH8.0) to a concentration of 10μM, as specified in the NimbleGen
proto-col for starting the enrichment protoproto-col with 1μg of DNA (protocol adapted from [12]). D5
blocking oligos were designed to have the same sequences as the respective D5 adapters, where-as for D7 blocking oligos the reverse complement of the respective D7 adapter sequences wwhere-as used. All blocking oligos were modified with a 3’inverted dT and SAGE purified. The lyophi-lized oligos were dissolved in molecular biology grade water (5Prime, Hilden, Germany) to a final concentration of 100μM.
A schematic representation of the structure and modifications of the adapter and blocking oligo sequences is provided inFig 1.
Proof-of-principle experiment
As a proof-of-principle we multiplexed and sequenced 34 DNA samples that were enriched using a custom NimbleGen SeqCap EZ Choice kit. The DNA samples were obtained from blood, and selected from a follow-up research cohort which was approved by the Ethics com-mittee of the Antwerp University Hospital and the University of Antwerp (EC file 13/1/13). No additional consent was needed, as the data were analyzed anonymously for this study. For each sample, one microgram of high quality genomic DNA was fragmented with a Covaris M220 in-strument, using screw-cap microtubes (Covaris, Woburn, MA, USA). Library preparation was performed with the KAPA Library Preparation Kit for Illumina platforms (Kapa Biosystems). The manufacturer’s DNA sample preparation protocol for Roche NimbleGen SeqCap EZ Choice and Exome products (KAPA Biosystems, KR0935—v1.14) was followed, using the
‘home-made’dual-index adapters at step 6.1 of the protocol. To further reduce experimental
Fig 1. Schematic structural representation of the adapter and blocking oligo sequences and the required modifications.Full-length sequences can be derived from the Illumina sequence letter [11].Index = sequence of 6–8 nucleotides that makes each adapter unique,*= phosphothiorate bond,/invdT/ =
inverted dT,/phos/ = phosphate group,rc.= reverse complement. Oligonucleotide sequences © 2007–2013 Illumina, Inc. All rights reserved. Derivative works created by Illumina customers are authorized for use with Illumina instruments and products only. All other uses are strictly prohibited.
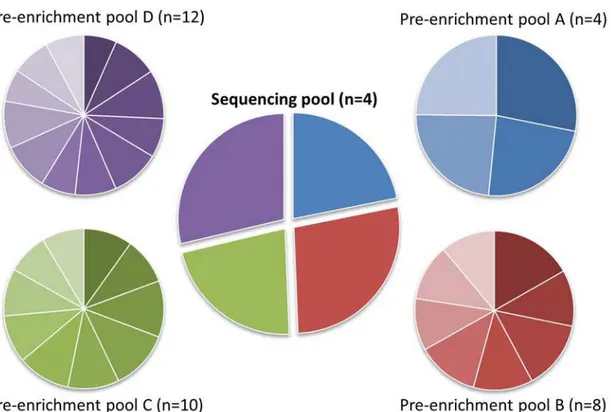
costs, we evaluated the impact of pre-enrichment pooling using different numbers of samples. We prepared 4 pre-enrichment pools by equimolarly pooling 4, 8, 10 and 12 samples (Fig 2, pre-enrichment pool A-D respectively). The enrichment panel design, generated using the on-line NimbleDesign tool (Roche) contained 18 genes with a cumulative target size of 157 kb and a predicted target gene coverage of 99.8%. NimbleGen SeqCap EZ Choice library enrichment was performed according to the manufacturer’s protocol (NimbleGen SeqCap EZ Library SR User’s Guide, version 4.2). At chapter 5 step 4 of the protocol, the appropriate‘home-made’
blocking oligos were used. After performing the SeqCap EZ enrichment protocol, the four pools were equimolarly pooled (Fig 2, sequencing pool) to a single pool that was sequenced with a 2x150 bp MiSeq run using MiSeq v2 chemistry (Illumina). The full sequences used for the‘home-made’adapters and blocking oligos are available upon request; the indices used in this experiment are summarized inS1 Table.
Data-analysis
Quality control and mapping of the raw sequencing reads was achieved using a slightly modified version of our exome sequencing pipeline [3]. In short, adapter sequences were removed with Cutadapt v.1.2.1 [13] after which bases with a Phred score<30 were removed from the 3’read end with an in-house developed tool [3]. The remaining high-quality reads were mapped against the reference genome with BWA-MEM v.0.7.4 [14]. PCR-duplicates were removed with Picard v1.88 [15] and the mapping was optimized with GATK v.2.8.1 indel realignment and base quali-ty recalibration [16,17]. Variants were called with GATK Unified Genotyper after which anno-tation, filtering and interpretation of the variants was done using VariantDB [18].
Fig 2. Read distributions by pool, based on the percentage of reads per index.Pre-enrichment pools were pooled before target capture. Sequencing pool consists of the 4 pre-enrichment pools, combined in a single sequencing run.
Genotype Concordance
Illumina SNP-array data were previously obtained from 30 samples using a HumanCytoSNP-12 v2.1 beadchip on an iScan system, following standard protocols as provided by the manufacturer (Illumina). SNP genotypes were extracted from Illumina GenomeStudio (v2011.1) using the Genotyping module (v.1.9.4). Concordance between NGS and SNP-array genotypes was defined as identical calls with both techniques.
Evaluation of Target Capture performance
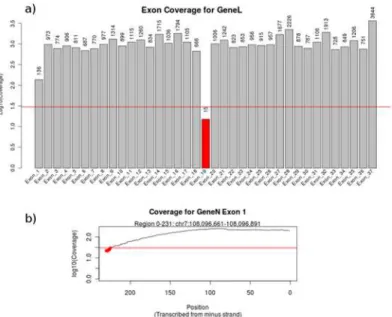
Target enrichment was evaluated using an in-house tool, available in both a standalone version and through integration with galaxy (https://toolshed.g2.bx.psu.edu/view/geert-vandeweyer/ coverage_report) [19–21]. Total read count and mapping performance is calculated using sam-tools v.0.1.19 [22]. Coverage is calculated within regions of interest using BedTools v.2.17.0 and transformed to on-target mapping performance, average coverage at exon- and base-level, the percentage of bases covered by at least a selected depth and enrichment stability, repre-sented by the percentage of bases covered by at least 0.2 times the average read depth [23]. Re-sults are presented in a PDF report, including the samtools and transformed bedtools values, and per-gene charts of exon coverage (Fig 3a). The user can also request per exon plots of base level coverage, to inspect or identify small drops in coverage depth (Fig 3b). An example of the resulting coverage report is shown inS1 Fig.
Results
Analysis of the sequencing data revealed that all included indices were recognized and were well distributed over the pools and the respective samples within a pool (Fig 2). The minor variation in distribution falls within the range of standard pipetting inaccuracies.S2 Figsummarizes the coverage distribution per exon over all samples, demonstrating that in our design only four of the 360 targeted exons repeatedly drop below the 30X coverage threshold. A detailed description
Fig 3. Sections from a coverage report.A) Representation of exon coverage, grouped by gene based on information in the provided BED file. The horizontal red line indicates a user-provided coverage threshold. B) Coverage at base level for one exon, allowing the identification of local drops in sequencing depth.
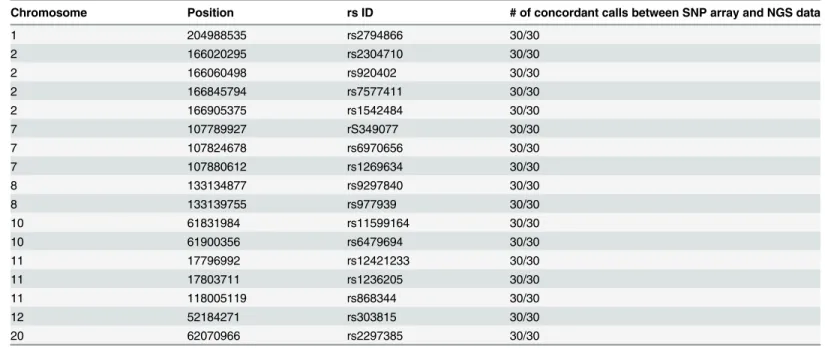
of the dataset is provided inTable 1. Independent sample Kruskal-Wallis tests indicated signifi-cant differences between the means of all groups for each measure. These differences can largely be explained by the different depth of coverage for each pool. As the pools were equimolarly pooled for sequencing, each pool represents approximately one quarter of the sequencing output. Every pool consists of different numbers of samples causing individual samples to be sequenced with different depth, depending on the number of samples in the pool. A lower sequencing depth will by definition result in a lower mean base coverage, a trend that we indeed observe when in-creasing the number of samples per pool. With a decrease in sequencing depth, one may also ex-pect a decrease in the percentage of bases with more than 30X coverage. Indeed, a small decrease in the percentage of bases with more than 30X coverage was detected when increasing the pooling factor, however the resulting percentage remains very high and is not significantly different be-tween pools C and D (n = 10 or 12 respectively, p = 0.088, post-hoc Fisher’s least significant dif-ference test). The stability of the assay is reflected in the percentage of reads with a coverage that is higher than 20% of the average coverage. This percentage is significantly higher in pool A com-pared to the other pools (p<0.001), but the means of the three larger pools do not differ signifi-cantly (p>0.25, post-hoc Tamhene test), from which we can conclude that higher pre-pooling factors do not severely affect the stability of the assay. The percentage of reads mapped on-target is less dependent on the sequencing depth and mainly depends on the efficiency of the capture re-action. As a result, this parameter can fluctuate between different enrichment designs and be-tween different capture reactions, but should be in the same order of magnitude for the same design. As each pool was used for a separate capture reaction, the average reads mapped on-target per pool slightly differ, but independent of the pooling factor. In fact, the pool with the largest pooling factor (pool D) has the highest mean percentage of reads mapped on-target, with a value of 79.4%. In addition to inter-capture stability, the average percentage of on-target reads is also within range of libraries prepared with the standard NimbleGen SeqCap EZ single-index adapters and enriched using NimbleGen SeqCap EZ Human Exome Library v3.0 in our laboratory (68.4%, ±7.8% (S.D.)). These results show that the‘home-made’blocking oligos against the dual-index adapter sequences successfully prevented the enrichment of aspecific targets in the custom en-richment, without compromising the enrichment stability over the target region. To test whether pre-enrichment pooling affects the genotyping quality, we compared the sequencing data with SNP array data that were previously obtained for 30 of the 34 samples. A total of 17 SNPs (Table 2) were shared between both datasets, all 17 SNPs in all 30 samples were concordant, sug-gesting that higher pre-enrichment pooling factors do not influence the genotyping quality.
(n = 4) Pool B (n = 8)
243±37 99.26±0.20 74.4±0.5 98.69±0.10
Pool C (n = 10)
157±18 98.69±0.22 75.2±0.3 98.64±0.12
Pool D (n = 12)
180±26 98.80±0.22 79.4±0.5 98.60±0.08
Total (n = 34)
232±127 98.99±0.41 76.6±2.2 98.68±0.16
Discussion
Many studies illustrated the importance of next-generation sequencing and especially whole-exome sequencing to identify causative mutations in genetic diseases [3,24,25]. However, de-spite the gradual decrease of experimental costs, whole-exome sequencing is still only sporadically used in routine diagnostics as the costs remain relatively high. Targeted screening using next-gen-eration sequencing platforms is a cost-efficient alternative if the desired sequencing capacity to identify the diseacausing mutation is relatively limited in comparison with whole-exome se-quencing. This is for instance the case in the diagnostic testing for disorders with a limited genetic heterogeneity. Moreover, the more complete coverage achieved with targeted sequencing results in higher sensitivity and specificity rates, important factors in routine diagnostics. Another major advantage of targeted screening over whole-exome sequencing, especially in diagnostic settings, is the reduced risk of finding unanticipated or incidental findings. These refer to the discovery of mutations in disease genes unrelated to the disorder for which a diagnosis is requested. Major eth-ical discussions are ongoing within the genetic community about whether or not to report these incidental findings to the patients [26]. By only studying the genes known to be involved in the emergence of the phenotype of a patient, the risk of finding unsought mutations is significantly reduced. Besides the benefits of targeted sequencing in a diagnostic setting, the technique can also be a very interesting alternative for whole-exome sequencing in research projects focusing on spe-cific disorders or pathways as more samples can be sequenced at a lower cost.
In summary, we increased the multiplexing capacity from 24 to 96 samples for NimbleGen SeqCap EZ Choice enrichment, by demonstrating that the dual-indexing of KAPA libraries is compatible with this enrichment protocol using a custom set of adapter and blocking oligos. Fur-thermore, we showed that pre-enrichment pooling of up to 12 samples is feasible and does not lead to significant data loss per sample, which decreases the costs per sample even further. The total costs per sample are reduced with a factor 2 for a 192 sample project, using this extended protocol compared to the standard NimbleGen SeqCap EZ protocols, and can be reduced even further when including more samples (S3 Fig). Hence, this enhanced protocol provides a robust
Table 2. Overview of SNPs shared by the targeted enrichment sequencing data and the array data.
Chromosome Position rs ID # of concordant calls between SNP array and NGS data
1 204988535 rs2794866 30/30
2 166020295 rs2304710 30/30
2 166060498 rs920402 30/30
2 166845794 rs7577411 30/30
2 166905375 rs1542484 30/30
7 107789927 rS349077 30/30
7 107824678 rs6970656 30/30
7 107880612 rs1269634 30/30
8 133134877 rs9297840 30/30
8 133139755 rs977939 30/30
10 61831984 rs11599164 30/30
10 61900356 rs6479694 30/30
11 17796992 rs12421233 30/30
11 17803711 rs1236205 30/30
11 118005119 rs868344 30/30
12 52184271 rs303815 30/30
20 62070966 rs2297385 30/30
S1 Table. Overview of the pool distribution and indices.D-codes refer to Illumina Index identifiers as described in the Illumina Sequence Letter, version August 2014. (http://support.illumina.com/downloads/illumina-customer-sequence-letter.html, Oligo-nucleotide sequences © 2007–2013 Illumina, Inc. All rights reserved.)
(PDF)
S1 Fig. Example of a coverage report.The coverage report encompasses the target region cov-erage and cumulative normalized base-covcov-erage plots, general statistics of the alignment, sum-mary plots of the exon coverage per gene and detailed plots of exons that (partially) failed to reach the applied coverage threshold.
(PDF)
S2 Fig. Coverage distribution per gene.For each gene a graph is depicted, showing the mean coverage per exon over all samples (n = 34). Error bars reflect ±1 standard deviation. The com-monly used threshold of 30X coverage is indicated in each graph with a black line.
(PDF)
S3 Fig. Cost-comparison of NimbleGen single-indexing vs. the presented dual-indexing protocol.
(PDF)
S1 Dataset. Coverage reports of all samples, containing all data required for the analyses presented here.
(GZ)
Author Contributions
Conceived and designed the experiments: IMvdW RFK GV. Performed the experiments: IMvdW. Analyzed the data: IMvdW GV. Contributed reagents/materials/analysis tools: RFK GV. Wrote the paper: IMvdW RFK GV. Designed the software used in analysis: GV.
References
1. de Ligt J, Willemsen MH, van Bon BW, Kleefstra T, Yntema HG, Kroes T, et al. Diagnostic exome se-quencing in persons with severe intellectual disability. N Engl J Med. 2012; 367(20):1921–9. doi:10. 1056/NEJMoa1206524PMID:23033978
2. Iossifov I, Ronemus M, Levy D, Wang Z, Hakker I, Rosenbaum J, et al. De novo gene disruptions in chil-dren on the autistic spectrum. Neuron. 2012; 74(2):285–99. doi:10.1016/j.neuron.2012.04.009PMID:
22542183
3. Helsmoortel C, Vandeweyer G, Ordoukhanian P, Van Nieuwerburgh F, Van der Aa N, Kooy RF. Chal-lenges and opportunities in the investigation of unexplained intellectual disability using family based whole exome sequencing. Clin Genet. 2014:In press doi:10.1111/cge.12470
4. Clark MJ, Chen R, Lam HY, Karczewski KJ, Chen R, Euskirchen G, et al. Performance comparison of exome DNA sequencing technologies. Nat Biotechnol. 2011; 29(10):908–14. doi:10.1038/nbt.1975
PMID:21947028
5. Aparisi MJ, Aller E, Fuster-Garcia C, Garcia-Garcia G, Rodrigo R, Vazquez-Manrique RP, et al. Tar-geted next generation sequencing for molecular diagnosis of Usher syndrome. Orphanet J Rare Dis. 2014; 9(1):168. doi:10.1186/s13023-014-0168-7PMID:25404053
7. Johansen CT, Dube JB, Loyzer MN, MacDonald A, Carter DE, McIntyre AD, et al. LipidSeq: a next-gen-eration clinical resequencing panel for monogenic dyslipidemias. J Lipid Res. 2014; 55(4):765–72. doi:
10.1194/jlr.D045963PMID:24503134
8. Bodi K, Perera AG, Adams PS, Bintzler D, Dewar K, Grove DS, et al. Comparison of commercially avail-able target enrichment methods for next-generation sequencing. J Biomol Tech. 2013; 24(2):73–86. doi:10.7171/jbt.13-2402-002PMID:23814499
9. Illumina. Technical Note: Estimating Sequencing Coverage. 2014.
10. Nimblegen website. Available:http://www.nimblegen.com/products/lit/06629725001.pdfAccessed 16/ 03/2015.
11. Illumina website. Available:http://support.illumina.com/downloads/illumina-customer-sequence-letter. htmlAccessed 16/03/2015.
12. KAPABiosystems. KAPA Library Preparation Kit—Recommendations for ordering adapters. 2013. 13. Martin M. Cutadapt removes adapter sequences from high-throughput sequencing reads. EMBnet
Journal. 2011; 17(1):10–2.
14. Li H, Durbin R. Fast and accurate short read alignment with Burrows-Wheeler transform. Bioinformat-ics. 2009; 25(14):1754–60. doi:10.1093/bioinformatics/btp324PMID:19451168
15. Picard website. Available:http://broadinstitute.github.io/picard/Accessed 16/03/2015.
16. McKenna A, Hanna M, Banks E, Sivachenko A, Cibulskis K, Kernytsky A, et al. The Genome Analysis Toolkit: a MapReduce framework for analyzing next-generation DNA sequencing data. Genome Res. 2010; 20(9):1297–303. doi:10.1101/gr.107524.110PMID:20644199
17. DePristo MA, Banks E, Poplin R, Garimella KV, Maguire JR, Hartl C, et al. A framework for variation dis-covery and genotyping using next-generation DNA sequencing data. Nat Genet. 2011; 43(5):491–8. doi:10.1038/ng.806PMID:21478889
18. Vandeweyer G, Van Laer L, Loeys B, Van den Bulcke T, Kooy RF. VariantDB: a flexible annotation and filtering portal for next generation sequencing data. Genome Med. 2014; 6(10):74. doi:10.1186/ s13073-014-0074-6PMID:25352915
19. Blankenberg D, Von Kuster G, Coraor N, Ananda G, Lazarus R, Mangan M, et al. Galaxy: a web-based genome analysis tool for experimentalists. Curr Protoc Mol Biol. 2010;Chapter 19:Unit 19 0 1–21. doi:
10.1002/0471142727.mb1910s89PMID:20373502
20. Goecks J, Nekrutenko A, Taylor J, Galaxy T. Galaxy: a comprehensive approach for supporting acces-sible, reproducible, and transparent computational research in the life sciences. Genome Biol. 2010; 11(8):R86. doi:10.1186/gb-2010-11-8-r86PMID:20738864
21. Giardine B, Riemer C, Hardison RC, Burhans R, Elnitski L, Shah P, et al. Galaxy: a platform for interac-tive large-scale genome analysis. Genome Res. 2005; 15(10):1451–5. doi:10.1101/gr.4086505PMID:
16169926
22. Li H, Handsaker B, Wysoker A, Fennell T, Ruan J, Homer N, et al. The Sequence Alignment/Map for-mat and SAMtools. Bioinforfor-matics. 2009; 25(16):2078–9. doi:10.1093/bioinformatics/btp352PMID:
19505943
23. Quinlan AR, Hall IM. BEDTools: a flexible suite of utilities for comparing genomic features. Bioinformat-ics. 2010; 26(6):841–2. doi:10.1093/bioinformatics/btq033PMID:20110278
24. Yang Y, Muzny DM, Reid JG, Bainbridge MN, Willis A, Ward PA, et al. Clinical whole-exome sequenc-ing for the diagnosis of mendelian disorders. N Engl J Med. 2013; 369(16):1502–11. doi:10.1056/ NEJMoa1306555PMID:24088041
25. Bamshad MJ, Ng SB, Bigham AW, Tabor HK, Emond MJ, Nickerson DA, et al. Exome sequencing as a tool for Mendelian disease gene discovery. Nat Rev Genet. 2011; 12(11):745–55. doi:10.1038/ nrg3031PMID:21946919
26. Lemke AA, Bick D, Dimmock D, Simpson P, Veith R. Perspectives of clinical genetics professionals to-ward genome sequencing and incidental findings: a survey study. Clin Genet. 2013; 84(3):230–6. doi: