Article
Simulation of arthropod abundance from plant composition
WenJun Zhang
School of Life Sciences, Sun Yat-sen University, Guangzhou 510275, China; International Academy of Ecology and Environmental Sciences, Hong Kong
E-mail: [email protected], [email protected]
Received 15 January 2011; Accepted 12 March 2011; Published online 1 April 2011 IAEES
Abstract
The relationship between arthropod abundance and plant composition is extremely complex. It is very hard to develop a mechanistic model to describe the relationship. This study aimed to simulate arthropod abundance from plant composition on grassland using an artificial neural network developed by the author, and to compare simulation performances between the neural network and conventional models.
The results revealed that there were complex interactions between plants and arthropods, and the arthropod abundance on grassland was significantly determined of plant families and their cover-degrees rather than plant species and their cover-degrees.
Neural network exhibited a better simulation performance than multivariate regression and response surface model. Cross validation indicated that prediction performance of neural network was also superior to these models. It was concluded that neural network is an effective tool to model arthropod abundance from plant composition on grassland.
A moderate dimensionality for input space may be determined to produce a reasonably trained neural network. Such procedures for dimensionality reduction as PCE, etc., were suggested being used in the data treatment in neural network modeling. A high dimensionality for input space and a few samples in the input set would result in the deficient learning of neural network. Randomization procedure for sample submission would help to eliminate the sequence correlation but may result in a worse performance in simulation and prediction. It was suggested that randomization procedure could be used to the sample submission for these situations with a lot of samples and a lower dimensionality.
Keywords arthropod abundance; plant composition; artificial neural network; multivariate regression; response surface model; simulation.
1 Introduction
According to a statistic report, arthropods account for 90% of global species (Pimental et al., 1992). On a temperate grassland, arthropods hold a huge biomass (1,000 kg/ha), seconded to plant (20,000 kg/ha) and microorganisms (7,000 kg/ha) but much higher than mammals (1.2 kg/ha), birds (0.3 kg/ha), and nemantodes (120 kg/ha) (Pimental et al., 1992; Chen and Ma, 2001). Arthropods govern the structures and functions of natural ecosystems, but are always ignored by researchers (Wilson, 1987).
and Letourmeau, 1984; Altieri, 1994, 1995). Community with more complex plant species composition will contain more diverse insects (Szentriralyi and Kozar, 1991; Sheng et al., 1997). Some forest studies disclosed that the relationship between plant community and insect community is significant (Dong et al., 2005; Jia et al., 2006). However, there is a positive correlation between plant community and predatory and parasitic insect community, and a negative correlation between plant community and defoliator insect community (Dong et al., 2005). Dominant arthropod population on farmland is negatively regulated by vegetational diversity, but a positive regulation would occur in some cases (Andow, 1991). Many facts revealed that significant but complex relationships exist between arthropods and plant composition. Mechanisms to yield these relationships could not be clearly explained (Schultz and Wieland, 1997). They are generally nonlinear relationships (Pastor-Barcenas et al., 2005).
Artificial neural networks (ANNs) are universal function approximators for nonlinear relationships (Acharya et al., 2006; Bianconi et al., 2010; Nour et al., 2006; Zhang and Barrion, 2006; Zhang et al., 2007). ANNs could offer the advantages of simplified and more automated model synthesis and analytical input-output models (Abdel-Aal, 2004; Tan et al., 2006). They are considered to be more effective in time series prediction than previous procedures based on dynamical system theory (Ballester et al., 2002). A large number of studies were reported concerning applications of ANNs. For instance, the forecast of short and middle long-term concentration levels (Viotti et al., 2002), subsurface modeling (Almasri and Kaluarachchi, 2005), modeling hourly temperature with the alternative abductive networks (Abdel-Aal, 2004), neural network modeling of sediment transfer (Abrahart and White, 2001), and subsurface drain outflow and nitrate-nitrogen concentration in tile effluent and surface ozone (Sharma et al., 2003; Pastor-Barcenas, et al., 2005), estimation of endoparasitic load using morphological descriptors (Loot et al., 2002), etc. Most recent applications of ANNs were the use of a feed-forward multilayer perceptron neural network model to predict flow and phosphorus concentration (Nour et al., 2006), the uses of BP ANN to describe nitrogen dioxide dispersion (Nagendra and Khare, 2006), and for reservoir eutrophication prediction (Kuo et al., 2007).
In recent years empirical models regained popularity due to the complexity and nonlinearity of ecosystems (Tan et al., 2006). Various conventional models, mostly empirical models, have been used to compare simulation performances between ANNs and these models. Five models, i.e., linear models (LMs), generalized additive models (GAMs), classification and regression trees (CARTs), multivariate adaptive regression splines (MARS), and ANNs, were compared with each other, and it was found that ANNs were superior to LMs, GAMs, and CART (Moisen and Frescino, 2002). ANNs were proved to outperform other models like multiple regression in predicting the number of salmonids (McKenna, 2005). ANNs can provide a feasible alternative to more classical spatial statistical techniques (Pearson et al., 2002). In addition to the above applications, ANNs have been widely used in many other areas, such as pattern classifications of various ecosystems (Cereghino et al., 2001; Zhang and Qi, 2002; Marchant and Onyango, 2003; Filippi and Jensen, 2006).
In the research areas of arthropods and plant communities, ANNs are occasionally used to make simulation and prediction. They were used to explain the observed structure of functional feeding groups of aquatic macro-invertebrates (Jørgensen et al., 2002); Self-Organizing Map ANN was used to determine pest species assemblages for global regions (Worner and Gevrey, 2006); BP and RBF ANNs were used to simulate and predict species richness of rice arthropods (Zhang and Barrion, 2006). ANNs were proved to outperform some conventional models like logistic regression and multiple discriminant model in predicting community composition (Olden et al., 2006). Up till now, there are not researches for modeling arthropod abundance from plant composition on grassland.
performances between neural network and conventional models.
2 Material and Methods 2.1 Field sampling
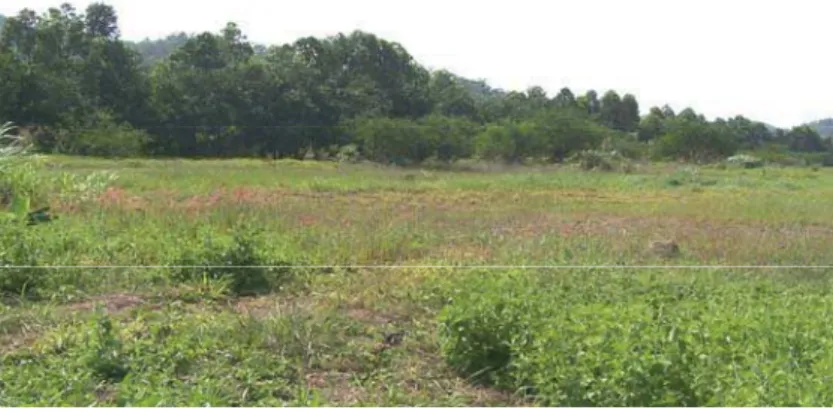
Plant composition and arthropod abundance were recorded on the natural grassland with an area ~1 ha, Zhuhai, China (Fig. 1). In total 50 samples, each with an equal size of 1u1 m, were investigated on the grassland. Plant species and their cover-degrees were recorded and measured, and individuals of various arthropods were collected and counted for each sample.
Fig. 1 The natural grassland for field sampling, Zhuhai, China (Photo courtesy QQ Lin).
2.2 Neural network
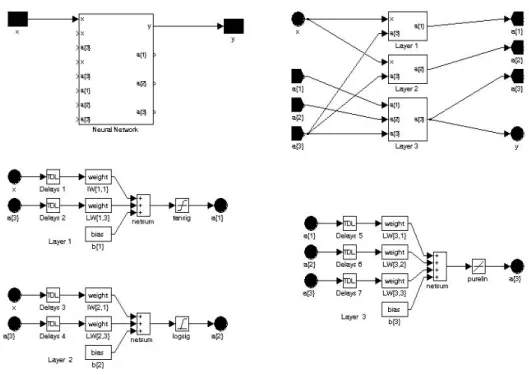
A three-layer neural network was developed for modeling arthropod abundance from plant composition (Fig. 2; Zhang, 2010). Thirty neurons were used in both the first and second layers. Bias was used to all of the layers. Transfer functions for layers 1~3 were hyperbolic tangent sigmoid transfer function (tansig), logarithmic sigmoid transfer function (logsig), and linear transfer function (purelin), respectively. Weights and bias for each layer were initiated by Nguyen-Widrow algorithm (Hagan et al., 1996; Mathworks, 2002; Fecit, 2003). Network initialization was made with a function that initializes each layer i according to its own initialization function (initlay). Network was trained by Levenberg-Marquardt backpropagation algorithm (trainlm). Desired performance function was mean squared error performance function (mse). Both the first and second layers received the same inputs from sample space and yielded outputs for the third layer. The third layer learned from the input space. For each layer the net input functions (netsum) calculated the layer’s net input by combining its weighted inputs and biases.
The neural network designed above is a nonlinear mapping from input space to output space, i.e., F: RpėRm, and f(X)=Y. For the input set, xięRp, and output set, yięRm, there is a mapping g satisfying g(xi)=yi,
i=1,2,…,n. A mapping fę)={f|f:RpėRm}, which is the optimal approximation ontog, is obtained by training the neural network. The resulted network is a nonlinear function and will approximate g(x) in such a way:
|f(x)- g(x)| <¦, xęRp, (1)
where x=(x1, x2,…,xp), and¦>0 is a given constant.
In present study, m=1, p was the number of indices for plant composition, xi was the vector of plant
The neural network was developed by using Matlab (Mathworks, 2002) in present research.
2.3 Other methods
2.3.1 Multivariate model
The multivariate regression (He, 2001; Mathworks, 2002) was used for modeling arthropod abundance from plant composition:
f(x)=a+bTx, (2)
where f(x): arthropod abundance (individuals per sample); a: constant; b=(b1,b2, …,bp)T: parametric vector;
x=(x1, x2,…,xp) T: the vector of plant composition (p plant taxa, e.g., species, families, etc.).
Fig. 2 Architecture of the neural network designed.
2.3.2 Response surface model (RSM)
The response surface model (He, 2001; Mathworks, 2002) was also used in present modeling:
f(x)=a+ bTx+ xTcx, (3)
where f(x): arthropod abundance (individuals per sample); x=(x1, x2,…,xp) T: the vector of plant composition;
b=(b1,b2, …,bp)T, c=(c1,c2, …,cp)T: parametric vectors; a: constant.
2.3.3 Principal Components Extraction (PCE)
PCE is often used in data reduction to identify a small number of factors that explain most of the variance that is observed in a much larger number of manifest variables (SPSS, 2006). In present study it was used to reduce the dimensionality of input space and generate independent principal components from a larger number of plant taxa without significant lose of variance information.
(1) Plant family data. In the modeling of arthropod abundance from plant family data, in total of 17 plant families (17-dimensional input space, R17), 50 samples (n=50) were used to train neural network or to build multivariate regression. The output space is a one-dimensional space (arthropod abundance).
(2) PCE based data. PCE procedure from plant family data yielded p principal components. The seventeen-dimensional input space was thus transformed into a p-dimensional input space (Rp). Fifty samples in the p-dimensional input space were used to train neural network, or to build multivariate regression and response surface model. The output space is a one-dimensional space, i.e., real domain R (arthropod abundance).
(3) Cross validation. Each sample was separately removed from the input set of 50 samples, and the remaining samples were used to train model and to predict the removed samples using the trained model. Comparisons between the predicted and observed arthropod abundances were made and Pearson correlation coefficient (r) and statistic significance were calculated to validate models.
(4) Samples were submitted to neural network in two ways, i.e., their natural IDs, and randomized sequences of samples.
3 Results
3.1 Taxonomic composition of plants and arthropods
Totally 17 families were found on the grassland, among which Gramineae (64.82%), Compositae (22.06%), and Leguminosae (9.31%) were the dominant plant families. Other plant families, such as Malvaceae, etc., held only 3.81% of total cover-degree.
Most of the arthropods recorded were insects, belonging to the orders Homoptera (37.99%), Diptera (21.06%), Orthoptera (14.37%), Hymenoptera (7.68%), Coleoptera (5.71%), Dermaptera (3.94%), Hemiptera (2.95%), Lepidoptera (2.17%), Isoptera (1.18%), and Odonata, Blattaria, Mantodea (<1%), etc. Other arthropods, such as spiders (2.17%), etc., were also recorded.
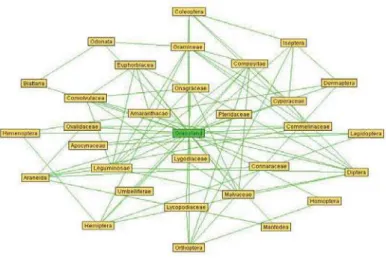
Using the algorithm for biological interaction network (Zhang, 2007), an interaction network for plant families-arthropods was obtained, as indicated in Fig. 3. There are a lot of direct or indirect interactions between plants and arthropods in the network as follows: (Oxalidaceae,Araneida), (Leguminosae, Diptera), (Leguminosae, Araneida), (Gramineae, Hemiptera), (Gramineae, Diptera), (Gramineae, Coleoptera), (Gramineae, Odonata), (Apocynaceae, Lepidoptera), (Malvaceae, Diptera), (Compositae, Hemiptera), (Compositae, Diptera),(Compositae, Orthoptera),(Onagraceae, Diptera),(Connaraceae, Araneida), (Cyperaceae,
Coleoptera), (Cyperaceae, Isoptera), (Lycopodiaceae, Orthoptera), (Convolvulacea, Diptera), (Commelinaceae, Coleoptera), (Commelinaceae, Araneida). The results for the interaction network indicated that many of the plant-arthropod interactions on grassland were positive interactions, except for the negative interactions (Leguminosae, Araneida), (Gramineae, Hemiptera), (Gramineae, Diptera), and (Compositae, Orthoptera). Theoretically, it will be possible to model arthropod abundance from plant family composition.
3.2 Modeling arthropod abundance
Multivariate regression fitted with plant species data (50 samples, 48 plant species) revealed that arthropod abundance could not be reasonably described by plant species and their cover-degrees (r=0.1995, p=0.05). However, the multivariate regression fitted with plant family data (50 samples, 17 plant families) demonstrated that arthropod abundance was significantly determined of plant families and their cover-degrees (r=0.4182,
p<0.005; Fig. 4). Neural network performed better than multivariate regression in the simulation of arthropod abundance based on the plant family data, as illustrated in Fig. 4.
The p (p=2,3,4,5,6) principal components were yielded from plant family data using PCE procedure. Fifty samples in the p-dimensional input space were used to train neural network by 10,000 epochs.
Fig. 4 Simulation performances of neural network and multivariate regression. Family data (50 samples, 17 plant families) were used to train models. Samples were submitted to neural network in their natural IDs.
Table 1 Comparisons between simulated and observed arthropod abundances. Simulation was conducted based on p (p=2,3,4,5,6) principal components. Samples were submitted to neural network in their natural IDs.
2 PCs 3 PCs 4 PCs 5 PCs 6 PCs
Simulated= Simulated= Simulated= Simulated= Simulated= 6.5152+0.3674*Obser
ved
3.3760+0.6803*Obser ved
0.7896+0.9240*Obser ved
2.3718+0.7801*Obser ved
6.6830+0.3652*Obser ved
Fig 5 Simulation performances of neural network, multivariate regression, and response surface model. Four principal components extracted from family data (50 samples, 17 plant families) were used to train models. Samples were submitted to neural network in their natural IDs.
The results revealed that the simulation based on four principal components exhibited the best goodness. The four principal components better explained about 50% of variation observed in the plant family data.
The simulation performance of neural network from plant family data appeared to be worse than that from PCE-extracted data (Fig. 4), even not better than the performance based on two principal components (2 PCs, Table 1). Simulation performance with four PCs (regression constant0, regression coefficient1, p<0.05, mse=5.9944) is much better than that with plant family data.
From the results above, we suggest that a suitable dimensionality of input space is necessary for producing a soundly trained neural network. For the situations with large number of indices for plant composition, the reduction of indices, for example, by PCE, is suggested in training neural network. A high dimensionality for input space and a few samples in the input set would result in the deficient learning of neural network.
With the data of four principal components, multivariate regression and response surface model were developed. Compared with neural network, response surface model could not sufficiently fit arthropod abundance (Fig. 5). Multivariate regression exhibited the worst performance in all of these models.
Different from the above cases, if samples were submitted to neural network in randomized sequences, the neural network would effectively serve (regression constant=2.688, regression coefficient=0.74, p<0.05, mse=15.1725; Fig. 6), but its performance would be worse than the trained neural network in which the samples were submitted in their natural IDs.
3.3 Cross validation of models
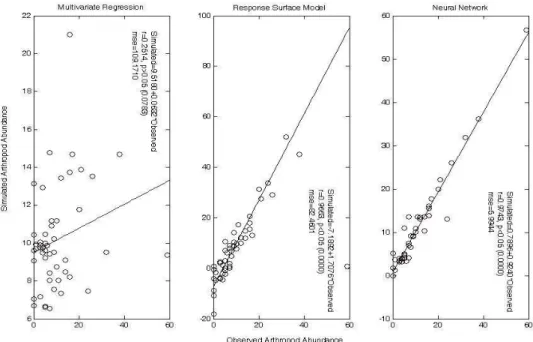
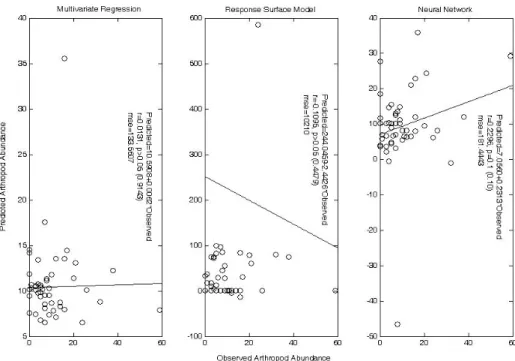
The cross validation based on four principal components, in which samples were submitted to neural network in their natural IDs, revealed that neural network exhibited a better robustness in predicting unknown samples (r=0.2296, p=0.1; Fig. 7), while multivariate regression (r=0.0131, p=0.9143>0.05) and response surface model (r=0.1096, p=0.4479>0.05) could not effectively predict unknown samples.
Fig. 7 Cross validation of multivariate regression, response surface model, and neural network. Four principal components were used to train models. Samples were submitted to neural network
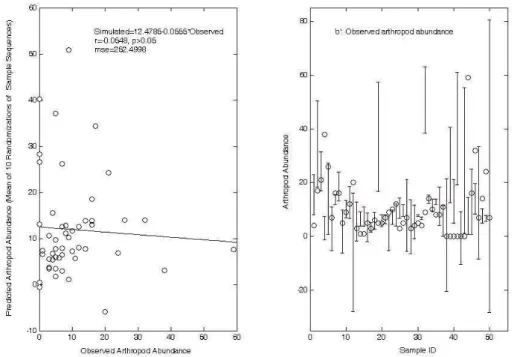
If samples are submitted to neural network in randomized sequences, the neural network will badly function in the cross validation. About half of the observed data fell beyond the 95% confidence interval of the predicted, as illustrated in Fig. 8.
4 Conclusions and discussion
It is concluded from this study that arthropod abundance on grassland is governed from plant families and their cover-degrees (plant composition). Neural network are superior to multivariate regression and response surface model in modeling arthropod abundance from plant composition.
A suitable dimensionality for input space is expected to produce a reasonably trained neural network. Procedures for dimensionality reduction, such as PCE, etc., are suggested being used in the data treatment in neural network modeling. A high dimensionality of input space and a few samples in the input set would result in the deficient learning of neural network.
We used randomization procedure to reduce the sequence correlation in sample submission. It is obvious that sequence correlation has been eliminated, but neural network modeling performance was lowered. Sequential submission of samples would yield a neural network with undetermined information and thus produce unpractical prediction to unknown samples. We suggest that randomization procedure can be used to the sample submission for the situations with a large number of samples and a lower dimensionality of input space.
Fig. 8 Cross validation of neural network. Left: Prediction (mean of ten randomizations of sample sequences); Right: Arthropod abundance: the observed, and predicted 95% confidence interval from ten randomizations of sample sequences
connects. (4) Input delays, input weights, layer weights. (5) Initiate functions, adapt functions, and other settings.
Over-learning always occurs in the neural network modeling. Some ways may be used to reduce over-learning, e.g., limiting the complexity of the neural network, training neural network with noise, using such techniques weight decay, and limiting the training of the network (Ozesmi et al., 2006).
Data quality is also crucial to train a neural network with strong predictive power. Data quality may be improved by a good experimental or sampling design for data acquisition, eliminating data redundancy like the PCE procedure used in present study, and randomization procedure used here, etc. (Kilic et al., 2007).
The explanatory power of neural network in data interpretation is not discussed in present study. This is an important aspect for explore the potential powers of neural networks. Fortunately some methods to explore neural network’s power in data interpretation, like Neural Interpretation Diagram, sensitivity analysis, Garson’s algorithm, inference rule extraction, randomization approach, etc., have been developed for practical uses (Bradshaw et al., 2002; Olden and Jackson, 2002; Gevrey et al., 2006).
Studies on neural network modeling in arthropods and plant communities are relative fewer in ecological and environmental areas (Lek and Baran, 1997; JЛrgensen et al., 2002; Worner and Gevrey, 2006; Zhang and Barrion, 2006). Researches towards neural network solutions for these problems are thus expected in the future.
Acknowledgments
This project was supported by “National Basic Research Program of China”(973 Program)(No. 2006CB102005). We thank all participants of field investigation, identification, and spreadsheet preparation, postgraduate WG Zhou, HQ Dai, undergraduates SP Li, QQ Lin, QN Wang, SY Zhu, G Wang, WX Yan, BX Dou, HY Xie, HM Xu, YX Huang, and all other undergraduates of ecology 2005, Sun Yat-sen University, China.
References
Abdel-Aal RE. 2004. Hourly temperature forecasting using abductive networks. Engineering Applications of Artificial Intelligence, 17: 543-556
Abrahart RJ, White SM. 2001. Modelling sediment transfer in Malawi: comparing backpropagation neural network solutions against a multiple linear regression benchmark using small data set. Physics and Chemistry of the Earth (B), 26(1): 19-24
Acharya C, Mohanty S, Sukla LB, Misra VN. 2006. Prediction of sulphur removal with Acidithiobacillus sp. using artificial neural networks. Ecological Modelling, 190(1-2): 223-230
Almasri MN, Kaluarachchi JJ. 2005. Modular neural networks to predict the nitrate distribution in ground water using the on-ground nitrogen loading and recharge data. Environmental Modelling and Software, 20: 851-871
Altieri MA. 1994. Biodiversity and Pest Management in Agroecosystems. Haworth Press, New York Altieri MA. 1995. Agroecology: the Science of Sustainable Agriculture. Westview Press, Boulder
Altieri MA, Letourneau DK. 1984. Vegetation diversity and insect pest outbreaks. CRC Critical Reviews in Plant Sciences, 2: 131–169.
Andow DA. 1991. Vegetational diversity and arthropod population response. Annual Review of Entomology, 36: 561–586.
Ecological Modelling, 156(1): 27-41
Bianconi A, Zuben CJV, de Souza Serapião AB, José S Govone . 2010. The use of artificial neural networks in analysing the nutritional ecology of Chrysomya megacephala (F.) (Diptera: Calliphoridae), compared with a statistical model. Australian Journal of Entomology, 49: 201–212ae
Bradshaw CJA, Davis LS, Purvis M, Zhou QQ, Benwell GL. 2002. Using artificial neural networks to model the suitability of coastline for breeding by New Zealand fur seals (Arctocephalus forsteri). Ecological Modelling, 148(2): 111-131
Cereghino R, Giraudel JL, Compin A. 2001. Spatial analysis of stream invertebrates distribution in the Adour-Garonne drainage basin (France), using Kohonen self organizing maps. Ecological Modelling, 146: 167-180
Chen LZ, Ma KP. 2001. Biodiversity Science: Principles and Practices. Shanghai Science and Technology Press, Shanghai
Dong BL, Ji LZ, Wei CY, Wang M, Xiao DM. 2005. Relationship between plant community and insect community in Korean pine broad-leaved mixed forest of Changbai Mountain. Chinese Journal of Ecology, 24(9): 1013-1016
Fecit. 2003. Analysis and Design of Neural Networks in MATLAB 6.5, Electronics Industry Press, Beijing Filippi AM, Jensen JR. 2006. Fuzzy learning vector quantization for hyperspectral coastal vegetation
classification. Remote Sensing of Environment, 100: 512-530
Gevrey M, Dimopoulos I, Lek S. 2006. Two-way interaction of input variables in the sensitivity analysis of neural network models. Ecological Modelling, 195(1-2): 43-50
Hagan MT, Demuth HB, Beale MH. 1996. Neural Network Design. PWS Publishing Company, California He RB. 2001. MATLAB 6: Engineering Computation and Applications. Chongqing University Press,
Chongqing
Jia CS, Chi DF, Hu YY. 2006. Effects of forest plant communities on forest insect communities. Journal of Anhui Agricultural Science, 34(9): 1871-1872, 1883
JЛrgensen SE, Verdonschot P, Lek S. 2002. Explanation of the observed structure of functional feeding groups of aquatic macro-invertebrates by an ecological model and the maximum exergy principle. Ecological Modelling, 158(3): 223-231
Kilic H, Soyupak S, Tuzun I, Ince O, Basaran G. 2007. An automata networks based preprocessing technique for artificial neural network modelling of primary production levels in reservoirs. Ecological Modelling, 201(3-4): 359-368
Kuo JT, Hsieh MH, Lung WS, She N. 2007. Using artificial neural network for reservoir eutrophication prediction. Ecological Modelling, 200(1-2): 171-177
Lek S, Baran P. 1997. Estimations of trout density and biomass: a neural networks approach. Nonlinear Analysis, Theory, Methods & Applications, 30(8): 4985-4990
Loot G, Giraudel JL, Lek S. 2002. A non-destructive morphometric technique to predict Ligula intestinalis L. plerocercoid load in roach (Rutilus rutilus L.) abdominal cavity. Ecological Modelling, 156(1): 1-11
Marchant JA, Onyango CM. 2003. Comparison of a Bayesian classifier with a multilayer feed-forward neural network using the example of plant/weed/soil discrimination. Computers and Electronics in Agriculture, 39: 3-22
Mathworks. 2002. Neural Network Toolbox, MATLAB 6.5
McKenna JE. 2005. Application of neural networks to prediction of fish diversity and salmonid production in the Lake Ontario basin. Transactions of The American Fisheries Society, 134(1):28-43
Ecological Modelling, 157(2-3): 209-225
Nagendra SMS, Khare M. 2006. Artificial neural network approach for modelling nitrogen dioxide dispersion from vehicular exhaust emissions. Ecological Modelling, 190(1-2): 99-115
Nour MH, Smith DW, El-Din MG, Prepas EE. 2006. The application of artificial neural networks to flow and phosphorus dynamics in small streams on the Boreal Plain, with emphasis on the role of wetlands. Ecological Modelling, 191(1): 19-32
Olden JD, Jackson DA. 2002. Illuminating the "black box": a randomization approach for understanding variable contributions in artificial neural networks. Ecological Modelling, 154(1-2): 135-150
Olden JD, Joy MK, Death RG. 2006. Rediscovering the species in community-wide predictive modeling. Ecological Applications, 16(4): 1449-1460
Ozesmi SL, Tan CO, Ozesmi U. 2006. Methodological issues in building, training, and testing artificial neural networks in ecological applications. Ecological Modelling, 195(1-2): 83-93
Pastor-Barcenas O, Soria-Olivas E, Martn-Guerrero JD. 2005. Unbiased sensitivity analysis and pruning techniques in neural networks for surface ozone modeling. Ecological Modelling, 182: 149–158
Pearson RG, Dawson TP, Berry PM, Harrison PA. 2002. SPECIES: A Spatial Evaluation of Climate Impact on the Envelope of Species. Ecological Modelling, 154(3): 289-300
Pimental D, Stachow U, Takacs DA, Brubakeret HW, Dumas AR, Meaney JJ, O’Neil JAS, Onsi DE, Cozilius DB. 1992. Conserving biological diversity in agricultural/forestry systems. Bioscience, 42(5): 354-362 Schultz A, Wieland R. 1997. The use of neural networks in agroecologica modeling. Computers and
Electronics in Agriculture, 18:73-90
Sharma V, Negi SC, Rudra RP, Yang S. 2003. Neural networks for predicting nitrate-nitrogen in drainage water. Agricultural Water Management, 63:169–183
Sheng SG, Gao BJ, Zhang YH, Wang ZW, Wang HX, Wang XJ. 1997. Studies on the structure of the insect communities in different plant types. Journal of Agricultural University of Hebei, 20(4): 61-65
SPSS Inc. 2006. SPSS 15.0 for Windows Release 15.0.0.0
Szentkirályi F, Kozár F. 1991. How many species are there in apple insect communities? Testing the resource diversity and intermediate disturbance hypotheses. Ecological Entomology, 16: 491–503
Tan CO, Ozesmi U, Beklioglu M, Per E, Kurt B. 2006. Predictive models in ecology: Comparison of performances and assessment of applicability. Ecological Informatics, 1(2): 195-211
Viotti P, Liuti G, Di Genova P. 2002. Atmospheric urban pollution: applications of an artificial neural network (ANN) to the city of Perugia. Ecological Modelling, 148(1): 27-46
Wilson EO. 1987. The little things that run the world. Conservation Biology, 1: 344-346
Worner SP, Gevrey M. 2006. Modelling global insect pest species assemblages to determine risk of invasion. Journal of Applied Ecology, 43(5): 858-867
Zhang WJ. 2010. Computational Ecology: Artificial Neural Networks and Their Applications. World Scientific, Singapore
Zhang WJ. 2007. Computer inference of network of ecological interactions from sampling data. Environmental Monitoring and Assessment, 124: 253-261
Zhang WJ, Bai CJ, Liu GD. 2007. Neural network modeling of ecosystems: a case study on cabbage growth system. Ecological Modelling, 201: 317-325
Zhang WJ, Barrion AT. 2006. Function approximation and documentation of sampling data using artificial neural networks. Environmental Monitoring and Assessment, 122: 185-201