Submitted6 February 2016
Accepted 13 June 2016
Published21 July 2016
Corresponding authors
Rui Alves, [email protected] Francesc Solsona,
Academic editor
Alfonso Valencia
Additional Information and Declarations can be found on page 13
DOI10.7717/peerj.2211 Copyright
2016 Alves et al.
Distributed under
Creative Commons CC-BY 4.0 OPEN ACCESS
Computer-assisted initial diagnosis of
rare diseases
Rui Alves1,2,*, Marc Piñol3,*, Jordi Vilaplana3,4, Ivan Teixidó3,4, Joaquim Cruz1,2,
Jorge Comas1,2,3,4, Ester Vilaprinyo1,2, Albert Sorribas1,2and Francesc Solsona3,4
1Departament de Cienciès Mèdiques Bàsiques, Universitat de Lleida, Lleida, Catalunya, Spain 2IRBLleida, Lleida, Catalunya, Spain
3Departament d’Informàtica i Enginyeria Industrial, Universitat de Lleida, Lleida, Catalunya, Spain 4INSPIRES, Lleida, Catalunya, Spain
*These authors contributed equally to this work.
ABSTRACT
Introduction.Most documented rare diseases have genetic origin. Because of their low individual frequency, an initial diagnosis based on phenotypic symptoms is not always easy, as practitioners might never have been exposed to patients suffering from the relevant disease. It is thus important to develop tools that facilitate symptom-based initial diagnosis of rare diseases by clinicians. In this work we aimed at developing a computational approach to aid in that initial diagnosis. We also aimed at implementing this approach in a user friendly web prototype. We call this tool Rare Disease Discovery. Finally, we also aimed at testing the performance of the prototype.
Methods.Rare Disease Discovery uses the publicly available ORPHANET data set of association between rare diseases and their symptoms to automatically predict the most likely rare diseases based on a patient’s symptoms. We apply the method to retrospectively diagnose a cohort of 187 rare disease patients with confirmed diagnosis. Subsequently we test the precision, sensitivity, and global performance of the system under different scenarios by running large scale Monte Carlo simulations. All settings account for situations where absent and/or unrelated symptoms are considered in the diagnosis.
Results. We find that this expert system has high diagnostic precision (≥80%) and sensitivity (≥99%), and is robust to both absent and unrelated symptoms.
Discussion.The Rare Disease Discovery prediction engine appears to provide a fast and robust method for initial assisted differential diagnosis of rare diseases. We coupled this engine with a user-friendly web interface and it can be freely accessed at http://disease-discovery.udl.cat/. The code and most current database for the whole project can be downloaded fromhttps://github.com/Wrrzag/DiseaseDiscovery/tree/no_classifiers.
SubjectsBioinformatics, Evidence Based Medicine, Translational Medicine, Science and Medical Education, Computational Science
Keywords Computer assisted diagnosis, Rare diseases, eHealth, Family doctors, User-friendly webserver
INTRODUCTION
one in every 2,000 individuals (EURORDIS Consortium,2016;Lavandeira,2002;Schieppati et al.,2008). Overall, more than 10,000 such diseases have been documented (Rath et al.,2012;McKusick,2008;ORPHANET,2015), and about 10% of the population suffers from some rare disease (Schieppati et al.,2008). Most known rare diseases have genetic origin (Rath et al.,2012;McKusick,2008). The association between specific diseases and the genes that might cause them can be found at the OMIM database (McKusick,2008).
Because of their low individual frequency, initial diagnosis of rare diseases by clinicians is not always easy (Polizzi et al.,2014). Often, those clinicians might never have been exposed to patients suffering from the disease. In addition, as it can be seen in ORPHANET (Maiella et al.,2013), many different diseases have a partially overlapping spectrum of symptoms that can confuse the diagnosis. In general, conclusive diagnosis for most rare diseases comes from a genetic test that identifies the genetic variations associated to that disease. These tests tend to be expensive and/or target a specific (small set of) disease(s). Given all these constraints, it is important to develop methods and tools to facilitate a quick and accurate symptom-based initial diagnosis of rare diseases.
Symptom-based diagnosis is a pattern recognition/classification problem, where an accurate prediction (the correct disease) must be made, based on a set of input characteristics (the symptoms). This is a classical computational problem, and computer-assisted medical diagnosis (CAD) can have many forms (Eadie, Taylor & Gibson,2012). CAD is routinely used in clinical image analysis (see for exampleWang & Summers,2012), although other applications, such as telemedicine, are also becoming frequent (Lopman et al.,2006;Soyer et al.,2005;Steele et al.,2005).
Symptom-based Differential Diagnosis (DDX) generators that assist medical doctors in automatically generating initial diagnosis have been originally developed in the mid nineteen eighties (Barnett et al.,1987). A recent comparative analysis of these methods reveals that their accuracy and sensitivity did not significantly improve since (Bond et al.,2012;Umscheid & Hanson,2012). Nevertheless, DDX generators could in principle be an optimal solution for an initial diagnosis of rare diseases. However, given that the cost-effectiveness of eHealth solutions appears to be debatable (Black et al.,2011;Free et al.,2013a;Free et al.,2013b;McLean et al.,2013;Eysenbach et al.,2002;Avery et al.,2012;
Free et al.,2011;Howitt et al.,2012;Sheikh et al.,2014;Morrison et al.,2013;Huckvale et al.,
2012;Greenhalgh & Swinglehurst,2011;Mazzucato, Houyez & Facchin,2014), using such a computer-based solution should either be free or have a low cost.
freely available to the medical community. Other free computational tools that assist in rare disease patient treatment and management do exist. For example, RAMEDIS (Töpel et al.,2010) provides a highly accurate and manually curated resource of human variations and corresponding phenotypes for rare metabolic diseases. DiseaseCard (Lopes & Oliveira,
2013) provides a similar service, with automated curation. The office of Rare Diseases from the NIH (Daneshvari, Youssof & Kroth, 2013;Genetic and Rare Diseases (GARD) Information Center,2016) is another useful resource for diagnosis and follow up of rare diseases. However, these tools do not provide a DDX generator that allow for doctors to get quick differential diagnostic options of rare diseases.
Developing a specific and freely accessible DDX generator for rare diseases requires two types of data. First, appropriate data sources associating specific symptoms to genetic diseases should be available. A highly curated, often updated, dataset containing information about the association between symptoms and rare diseases is available to the community at ORPHANET (Maiella et al.,2013). Second, a large and freely available golden standard dataset of rare disease patients is needed to test and validate the DDX generator. Although many initiatives are collecting data for tens to hundreds of thousands of rare disease patients (e.g.,Choquet & Landais,2014;Koutouzov,2010), these dataset have yet to made publicly available.
With these constraints in mind we set out to develop and test a prototype rare disease DDX generator, which we call Rare Disease Discovery. Using the ORPHANET dataset as a source of information regarding the association between symptoms and rare diseases, we developed Rare Disease Discovery (RDD,http://disease-discovery.udl.cat/). This free DDX generator prototype is specific for rare diseases and automatically predicts the most likely rare diseases based on the known set of symptoms provided by the user.
METHODS
Data sources & software
A highly curated list of rare diseases, associated to their respective symptoms, was downloaded from ORPHANET (ORPHANET,2015) on September 2015. A MySQL database where each disease is associated to its symptoms was built. The web technology underlying RDD is described in detail in the Supporting Methods section ofAppendix S1. All calculations and experiments were done using local Mathematica scripts.
Diagnostic score function and disease ranking
The goal of RDD is to estimate which are the most likely rare diseases a patient might suffer from, based on the symptoms shown by that patient and on the symptoms that are associated to each rare disease in the ORPHANET dataset. To rank diseases and provide a differential diagnosis, RDD uses the scoring functionDSifromEq. (1).
DSi=1− n
Max[SUser,SDiseasei]
. (1)
In Eq. (1), SUser represents the number of symptoms provided by the user, SDiseasei
Max[SUser,SDiseasei]represents the largest number betweenSUserandSDiseasei.nrepresents
the number of symptoms that are different between the set submitted by the user and the set associated to any given rare disease in the database. The fraction Max[S n
User,SDiseasei]
is always smaller than two and larger than or equal to zero. If all symptoms submitted by the user are the same as those from a disease and that disease has exactly the same symptoms as those provided by the user,n=0. If the symptoms provided by the user and the symptoms associated to a disease are all different andSUser=SDiseasei,n=2. Thus,−1≤DSi≤1.
RDD differentially diagnoses a patient by letting the user choose the list of symptoms that are relevant for the specific case of interest. Once this list is selected, RDD calculatesDSi
for all diseases stored in the database. Then, RDD ranks the diseases in order of increasing
DSi, presenting the disease with the highest score as the most likely. In the Supporting Methods section ofAppendix S1we discuss the performance of other scoring functions and prediction methods that were tested and discarded.
Retrospective study of previously diagnosed rare disease patients We selected all usable patients with a confirmed rare disease diagnosis from the RAMEDIS (Töpel et al.,2010) collection of patients in order to retrospectively use their symptoms and evaluate the diagnostic performance of RDD on a real set of patients. See Supporting Methods and Supporting Figure 1 inAppendix S1for selection details.
Calculating sensitivity and accuracy of the DDX predictions and significance of the DSi score
Monte Carlo simulations were used to calculate the precisionpand sensitivitysof RDD.p
is given byEq. (2)andsis given byEq. (3):
p= number of correctly predicted rare diseases
number of correctly predicted rare diseases+number of incorrectly predicted rare diseases (2)
s=number of correctly predicted rare diseases
total number of rare diseases . (3)
A prediction is considered to be correct if the disease that is ranked byDSi as the most likely is the correct disease.
The global performance of RDD was also calculated using the F1-Score, which is the harmonic mean ofpands:
F1-Score=2p×s
p+s. (4)
In addition, Monte Carlo simulations were also used to calculate the statistical significance of the scoreDSi. All simulations were done using Mathematica (Wolfram,1999).
Benchmarking the Rare Disease Discovery algorithm
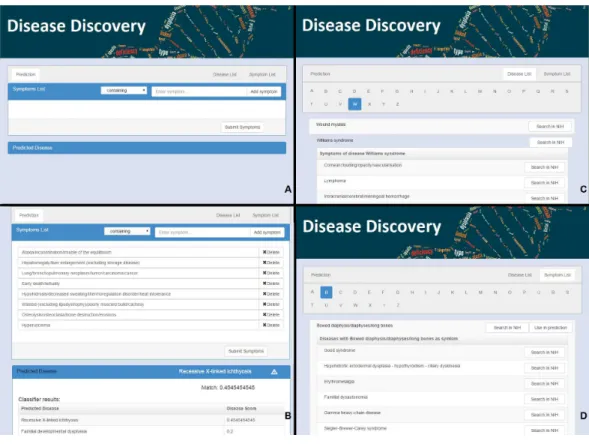
Figure 1 The web interface for Rare Disease Discovery.(A) Entry screen. Users can type and select var-ious symptoms. Once all relevant symptoms have been selected, the user can press ‘‘Submit Symptoms.’’ (B) Example of a differential diagnosis provided by the program. (C) List of diseases in the database, with its associated symptoms. (D) List of symptoms in the database, with its associated diseases.
unreported and unrelated symptoms affects prediction outcome of the RDD algorithm. The second experiment tested how unreported symptoms affect the prediction performance of the RDD algorithm. The third and fourth experiments estimate the minimum value forDSithat can be considered to be statistically significant and the minimum difference betweenDSivalues that is statistically significant, respectively.
RESULTS
Using the Rare Disease Discovery web
the browser (Fig. 1B). If the user clicks the name of any of the diseases, s/he will be taken to the RDD webpage with the list of symptoms for that disease. On that page s/he can also find external links about the disease at NIH.
The alphabetically ordered list of rare diseases, together with its associated symptoms can be directly accessed by pressing the ‘‘Disease List’’ pane (Fig. 1C). The alphabetically ordered list of symptoms, together with its associated diseases can be accessed by pressing the ‘‘Symptom List’’ pane (Fig. 1D). Users can also select symptoms directly from this pane and use them for prediction. NIH searches can be automatically launched for the disease or the symptom of interest.
Illustrative examples of RDD usage
To illustrate the use of RDD, we randomly selected 10 diseases from the database. For each disease, we:
(1) Calculate the number of symptoms associated to that disease in the database. (2) Randomly select the order of those symptoms.
(3) Use the first symptom in the list to predict the disease. (4) Calculate theDSiscore and rank for the disease.
(5) Use the first five symptoms in the list to predict the disease (see Supporting Table 1 in
Appendix S1).
(6) Calculate theDSiscore and rank for the disease.
(7) Identify the minimal number of symptoms that rank the original disease as the most likely prediction, and the score associated to those symptoms.
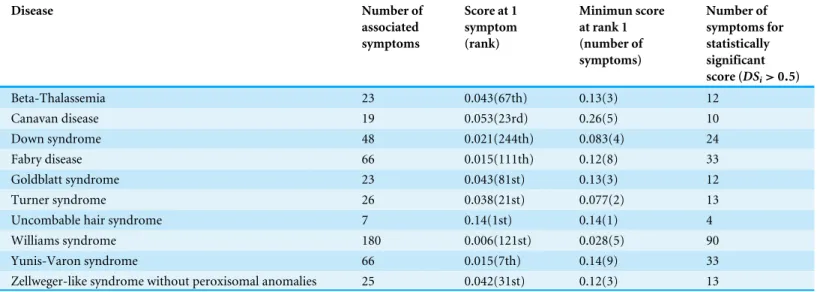
Results are summarized inTable 1. We see that one symptom is not sufficient to correctly identify any of the tested rare disease as the most likely. However, with 5 symptoms, 7 of the diseases are correctly predicted (although withDSiscores below significance level), and 9 of the diseases are ranked among the top-2 most likely.
Table 1 Examples of prediction results for a randomly chosen set of ten rare diseases.Diseases are identified in column 1. Column 2 indicates the total number of symptoms associated to the disease in the ORPHANET dataset. Column 3 presentsDSifor the disease when one symptom is
sub-mitted to RDD, as well as the ranking of the disease in the list of predictions. Column 4 showsDSifor the disease when five symptoms are
simulta-neously submitted to RDD, as well as the ranking of the disease in the list of predictions. Column 5 displays minimumDSiat which the disease is
ranked as the most likely prediction, as well as the number of symptoms needed for that value ofDSito be obtained. Finally, column 6 indicates the
number of symptoms that makeDSi≥0.5 for the disease, which is the value above whichDSiis statistically significant. Details about the symptoms are given in Supporting Table 1 ofAppendix S1.
Disease Number of
associated symptoms
Score at 1 symptom (rank)
Minimun score at rank 1 (number of symptoms)
Number of symptoms for statistically significant score (DSi>0.5)
Beta-Thalassemia 23 0.043(67th) 0.13(3) 12
Canavan disease 19 0.053(23rd) 0.26(5) 10
Down syndrome 48 0.021(244th) 0.083(4) 24
Fabry disease 66 0.015(111th) 0.12(8) 33
Goldblatt syndrome 23 0.043(81st) 0.13(3) 12
Turner syndrome 26 0.038(21st) 0.077(2) 13
Uncombable hair syndrome 7 0.14(1st) 0.14(1) 4
Williams syndrome 180 0.006(121st) 0.028(5) 90
Yunis-Varon syndrome 66 0.015(7th) 0.14(9) 33
Zellweger-like syndrome without peroxisomal anomalies 25 0.042(31st) 0.12(3) 13
Comparison to other DDX generators
RDD’s performance was also compared with that of other DDX engines that were freely available for illustrative purposes. After searching through the literature and the programs analyzed inBond et al.(2012), this limited us to our own RDD (RareDiseaseDiscovery), in addition to DiagnosisPro, ISABEL, Phenomizer, and FindZebra. While DiagnosisPro and ISABEL are general DDX generator, RDD, FindZebra and Phenomizer are DDX generators that are specific for genetic diseases. We did not include the disease diagnostic assistance tool from ORPHANET in the comparison because that service is no longer maintained.
By using the same ten diseases with their associated symptoms described in columns two and four of Supporting Table 1 ofAppendix S1, we asked each of the DDX generators to come up with a diagnosis of the disease. Results are summarized in Table 2. ISABEL identifies the correct disease as a possibility in three of the ten diseases. Diagnosis Pro identifies the correct disease as a possibility in four of the ten diseases. FindZebra identifies correctly nine of the diseases. RDD and Phenomizer identify the correct disease as a possibility in all ten cases.
Table 2 Comparison of predictions between DDX generators.Here we compare the most likely diagnosis of four well-known and freely available (at least for testing purposes) DDX generators with that provided by Rare Disease Discovery, when considering the joint symptoms used to perform the study summarized in columns 1 and 4 ofTable 1.
Disease Diagnosis pro ISABEL Phenomizer FindZebra Rare Disease Discovery
Beta-Thalassemia + + + ∗ +
Canavan disease ∗ ∗ + + +
Down syndrome ∗ ∗ + + +
Fabry disease + + + + +
Goldblatt syndrome ∗ ∗ + + +
Turner syndrome ∗ + + + +
Uncombable hair syndrome ∗ ∗ + + +
Williams syndrome + ∗ + + +
Yunis-Varon syndrome ∗ ∗ + + +
Zellweger-like syndrome without peroxisomal anomalies + ∗ + + +
Notes.
+Suggests the appropriate disease in the top 10 ranked list of predictions.
∗Does not suggest the appropriate disease in any position of the top 10 ranked list of predictions.
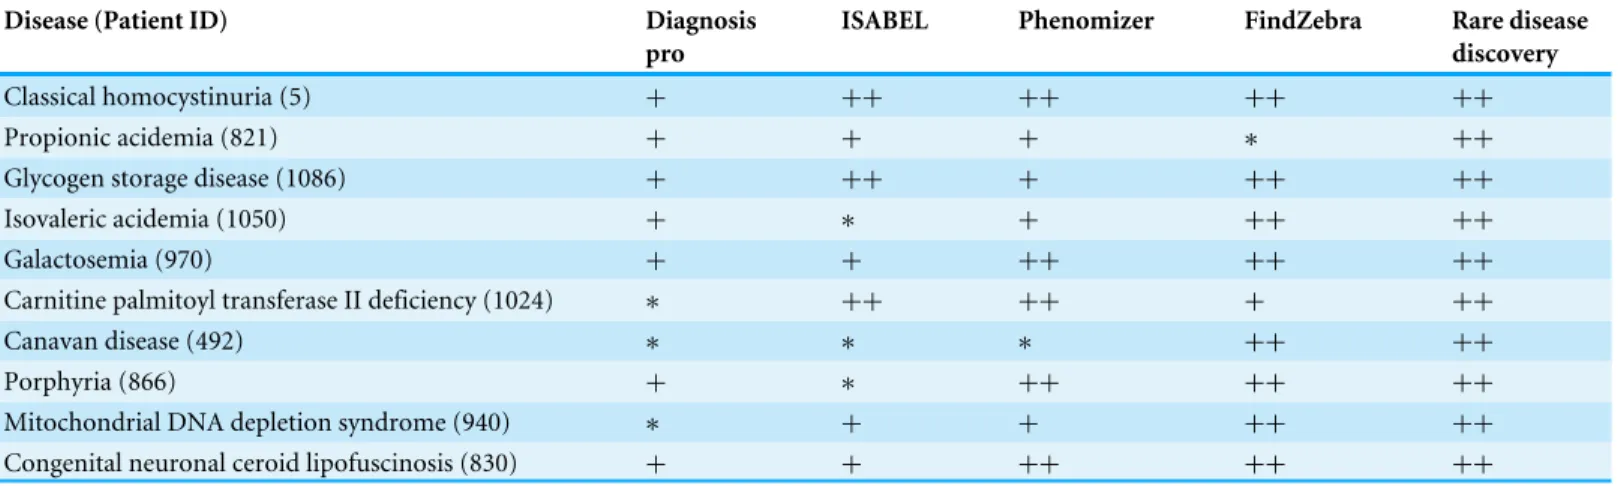
Table 3 Comparison of predictions between DDX generators.Here we compare the most likely diagnosis of four well-known and freely available
(at least for testing purposes) DDX generators with that provided by Rare Disease Discovery. 10 patients with different symptoms and/or diseases were randomly selected from the RAMEDIS dataset. All symptoms were used.
Disease (Patient ID) Diagnosis pro
ISABEL Phenomizer FindZebra Rare disease discovery
Classical homocystinuria (5) + ++ ++ ++ ++
Propionic acidemia (821) + + + ∗ ++
Glycogen storage disease (1086) + ++ + ++ ++
Isovaleric acidemia (1050) + ∗ + ++ ++
Galactosemia (970) + + ++ ++ ++
Carnitine palmitoyl transferase II deficiency (1024) ∗ ++ ++ + ++
Canavan disease (492) ∗ ∗ ∗ ++ ++
Porphyria (866) + ∗ ++ ++ ++
Mitochondrial DNA depletion syndrome (940) ∗ + + ++ ++
Congenital neuronal ceroid lipofuscinosis (830) + + ++ ++ ++
Notes.
+Suggests the appropriate disease in the top 100 list of possible diseases.
++Suggests the appropriate disease in the top 10 list of predictions.
∗Does not suggest the appropriate disease in any position of the top 100 list of predictions.
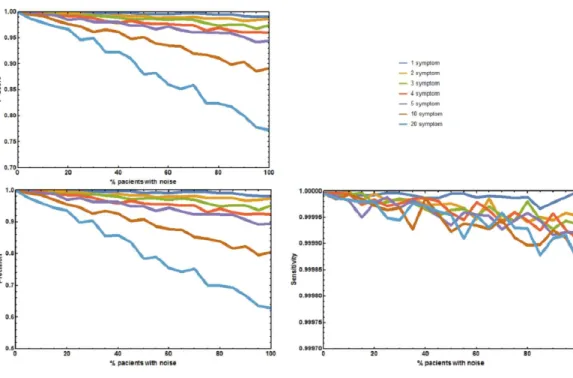
Figure 2 Joint effect of unreported and unrelated symptoms on the predictive accuracy of Rare Dis-ease Discovery.(A) Plot of F1-Score as a function of the % of patients with a known rare disease where 1, 2, 3, 4, 5, 10, or 20 symptoms were randomly added or deleted. (B) Plot of Precision as a function of the % of patients with a known rare disease where 1, 2, 3, 4, 5, 10, or 20 symptoms were randomly added or deleted. (C) Plot of Sensitivity as a function of the % of patients with a known rare disease where 1, 2, 3, 4, 5, 10, or 20 symptoms were randomly added or deleted. Without noise, the F1-Score is always 1. The F1-Score decreases as noise (% of patients with deleted symptoms) increases. This is mainly due to a de-crease in precision. Sensitivity is always low because the number of false positives is always orders or mag-nitude smaller than the number of true negatives. In the worst case scenario (20 incorrect symptoms in 100% of the patients), the appropriate disease is contained in the set of diseases with the highest score for more than 80% of the patients.
Benchmarking the rare disease discovery prototype
Four additional benchmark tests were needed to evaluate the effect of absent and unrelated symptoms on the diagnostic performance of RDD under more realistic, well controlled conditions. The first experiment measured the aggregate effect of absent and unrelated symptoms in predicting the correct disease. The precisionp, sensitivitys, andF1-Score of RDD were calculated (Fig. 2). When no symptoms are added or deletedp,s, andF1-Score
are always 1, and the correct disease is predicted 100% of the times. As the number of incorrect symptoms increases, pdecreases, whilesremains approximately constant. Decreases in eitherpor theF1-Score only becomes larger than 5% when the number of symptoms that are randomly added or deleted is equal to or higher than 10 in most of the patients.
The second experiment tested the effect of unreported/absent symptoms in predicting the correct disease. The precision p, sensitivitys, andF1-Score of RDD were calculated (Fig. 3). When no symptoms are deletedp,s, andF1-Scoreare always 1. The correct disease is predicted 100% of the times. As the number of patients with deleted symptoms increases,
Figure 3 Effect of unreported symptoms on the predictive accuracy of Rare Disease Discovery.
(A) Plot of F1-Score as a function of the % of patients with a known rare disease where 25%, 50%, and 75% of the symptoms were randomly deleted. (B) Plot of Precision as a function of the % of patients with a known rare disease where 25%, 50%, and 75% of the symptoms were randomly deleted. (C) Plot of Sensitivity as a function of the % of patients with a known rare disease where 25%, 50%, and 75% of the symptoms were randomly deleted. Without noise (no deleted symptoms), the F1-Score is always 1. The F1-Score decreases as noise (% of patients with deleted symptoms) increases. This is mainly due to a decrease in precision. Sensitivity is always low because the number of false positives is always orders or magnitude smaller than the number of true negatives. In the worst case scenario (75% deleted symptoms in 100% of the patients), the appropriate disease is contained in the set of diseases with the highest score for more than 90% of the patients.
larger than 5% for the sets where 75% of the symptoms are deleted in 50% or more of the patients.
The two final experiments were used to determine statistical significance of both, the value of theDSiscore used to rank the diseases and the difference between twoDSiscores. These experiments estimate that a scoreDSi≥0.5 has a probability lower than 0.0001
of being obtained by choosing a random set of symptoms (see Supporting Methods and Supporting Figure 3 inAppendix S1). In addition, it also suggests that differences between
DSi scores lower than 0.01 are significant (p-value < 0.001), as long as more than three symptoms are simultaneously submitted to RDD. If only one symptom is submitted, then twoDSiscores must differ by more than 0.14 (p-value < 0.001). Further details are given in Supporting Methods and Supporting Table 2 ofAppendix S1.
DISCUSSION
Rare disease discovery
In the vast majority of cases, a definitive and precise diagnostic of a rare disease requires genetic tests. However, in order to direct patients towards the appropriate medical specialists, family doctors need to make a preliminary diagnosis of the potential rare diseases that are consistent with the symptoms observed in the patient. These symptoms are either macroscopic phenotypic observations or clinical parameters from generic biochemical tests. It is at this stage of the diagnosis that rare disease DDX generators are likely to be most useful. Here we presented an approach to create such a DDX generator, Rare Disease Discovery. We implemented that approach as a fast, free, and user-friendly web prototype for initial CAD of patients with suspected rare diseases. We also tested the performance of this prototype in the limited context of the datasets that are available to us.
RDD runs typically take a few seconds, depending on the number of symptoms selected by the user. In the limited conditions under which we could test it, RDD has high precision and sensitivity in our benchmark experiments, suggesting that its diagnostic performance might be robust to situations where not all symptoms have been identified or are directly related with the disease the user is trying to identify. Precision is less robust to these factors than sensitivity, because the number of false positives is always orders or magnitude smaller than the number of true negatives. This makes precision decrease with noise much more sharply than sensitivity. We also show that even when the ranking scoreDSi is below significance level, the correct disease is frequently in the set of diseases with the top ten highestDSi. This is also observed in our retrospective studied of 187 previously diagnosed patients. Nevertheless, we remark that testing the performance of the application on much larger, more diverse, anonymized datasets of real patients is needed to validate RDD and its performance. To our knowledge, such datasets are not freely available to the community at present, although they may exist (see below).
Finally, we note that the approach underlying RDD can in principle be extended to any set of diseases. If one has a database associating symptoms to diseases, then one can test the same score function we use and benchmark that score using tests that are similar to the ones performed for RDD, establishing limits of statistical significance for the score function in the context of that database.
Comparing RDD to similar tools
FindZebra repeats this performance for eight out of ten patients and Phenomizer for five out of ten patients. However, both FindZebra and Phenomizer provide the correct disease in its top 100 list of possibilities for nine out of the ten patients. As expected, RDD, FindZebra, and Phenomizer significantly outperform DDX engines that where designed for CAD of general diseases (ISABEL and DiagnosisPro). We note that these experiments were run using the default settings of all programs. In the case of Phenomizer we also repeated the experiments changing the similarity measure and the multiple testing procedure of the program. However, the results remained qualitatively similar. To be more confident about the comparative performance of the RDD prototype with respect to Phenomizer and FindZebra, a batch study for the one hundred and eighty seven patients from the RAMEDIS dataset would have been desirable. However, a level of access to these tools that would permit automating this study is not available to the general public and this comparison could not be performed. RDD performs fairly well in this dataset, as the clinically diagnosed disease was on the top ten (fifty) list of predictions for more than 60% (80%) of the patients.
We note the qualitatively different approach that these three tools take to ranking the list of possible diseases for a given set of symptoms. Phenomizer takes what we would call a purely statistical approach and calculates the probability that a subset of symptoms could be generated from the complete set of symptom of a disease simply by accident. FindZebra performs a similar analysis for the random occurrence of specific terms in web documents. In contrast, RDD ranks the diseases based on a normalized hamming-like distance between the list of symptoms provided by the user and the list of symptoms from every disease in its database. Internally, RDD establishes the likelihood that a given score is significant or not, informs the user about it, but does not use this significance in the ranking of diseases. We speculate that a meta-server combining RDD, Phenomizer, and FindZebra and providing a consensus diagnostic list would be more accurate than any of the three programs alone. To facilitate this possibility we provide the RDD code and databases as a GitHub project (https://github.com/Wrrzag/DiseaseDiscovery/tree/no_classifiers).
Limitations
It is clear that any rare disease that is not included in that database can not be identified by RDD. However, this is also true for all other computer-assisted DDX tools, such as Phenomizer, or FindZebra, which can only identify diseases that are in their respective databases. Overall, the architecture of RDD allows for an easy replacement of the ORPHANET dataset by any other more comprehensive or more adequate dataset that may become available in the future.
An additional important limitation of this study is the size and lack of diversity in the dataset of real patients that we use to evaluate how RDD performs on a real world scenario. This limitation will remain until larger, more diverse datasets of patients are made freely available to the community. We remark that there are projects that have the potential to generate such datasets (e.g., Choquet & Landais,2014;Koutouzov,2010), enabling a more thorough validation of this and other rare disease DDX prototypes. For example, CEMARA reports having data for 235,000 rare disease patients. However, an anonymized version of that data is not readily available for public use. If, or when, such a database becomes available we will use it to further validate and test RDD. In addition we are actively looking for clinical teams that are interested in using the RDD prototype for testing.
CONCLUSIONS
Rare Disease Discovery is a high performance web prototype for CAD of rare diseases. Its diagnostic performance appears to be robust to situations where not all symptoms have been identified or are directly related with the disease the user is trying to identify. The diagnostic performance of the prototype on a limited set of 187 rare disease patients was good. If this diagnostic performance could be tested and confirmed on larger and more diverse sets of rare disease patients, RDD might potentially become a helpful tool for initial assisted diagnosis of rare disease patients.
ACKNOWLEDGEMENTS
We thank Drs. Gerard Piñol, Javier Trujillano, and Montse Rue for a critical reading of the paper and helpful suggestions.
ADDITIONAL INFORMATION AND DECLARATIONS
Funding
This work was partially supported by the MEyC under contracts TIN2014-53234-C2-2-R, TIN2011-28689-C02-02 and BFU2010-17704 and by Universitat de Lleida and Departament de Ciències Mèdiques Bàsiques with bridge grants to RA. The authors are members of the research groups 2014-SGR163 and 2014-SGR243, funded by the Generalitat de Catalunya. The funders had no role in study design, data collection and analysis, decision to publish, or preparation of the manuscript.
Grant Disclosures
The following grant information was disclosed by the authors:
Universitat de Lleida and Departament de Ciències Mèdiques Bàsiques. Generalitat de Catalunya: 2014-SGR163, 2014-SGR243.
Competing Interests
The authors declare there are no competing interests.
Author Contributions
• Rui Alves conceived and designed the experiments, performed the experiments, analyzed the data, contributed reagents/materials/analysis tools, wrote the paper, prepared figures and/or tables, reviewed drafts of the paper.
• Marc Piñol performed the experiments, contributed reagents/materials/analysis tools, wrote the paper, prepared figures and/or tables, reviewed drafts of the paper.
• Jordi Vilaplana and Ivan Teixidó analyzed the data, contributed reagents/materials/anal-ysis tools, reviewed drafts of the paper.
• Joaquim Cruz and Jorge Comas performed the experiments, reviewed drafts of the paper.
• Ester Vilaprinyo analyzed the data, prepared figures and/or tables, reviewed drafts of the paper.
• Albert Sorribas analyzed the data, wrote the paper, prepared figures and/or tables, reviewed drafts of the paper.
• Francesc Solsona conceived and designed the experiments, contributed reagents/mate-rials/analysis tools, prepared figures and/or tables, reviewed drafts of the paper.
Data Availability
The following information was supplied regarding data availability:
GitHub:https://github.com/Wrrzag/DiseaseDiscovery/tree/no_classifiers.
Supplemental Information
Supplemental information for this article can be found online athttp://dx.doi.org/10.7717/ peerj.2211#supplemental-information.
REFERENCES
Avery AJ, Rodgers S, Cantrill JA, Armstrong S, Cresswell K, Eden M, Elliott RA, Howard R, Kendrick D, Morris CJ, Prescott RJ, Swanwick G, Franklin M, Putman K, Boyd M, Sheikh A. 2012.A pharmacist-led information technology intervention for medication errors (PINCER): a multicentre, cluster randomised, controlled trial and cost-effectiveness analysis.Lancet 379:1310–1319
DOI 10.1016/S0140-6736(11)61817-5.
Barnett GO, Cimino JJ, Hupp JA, Hoffer EP. 1987.DXplain. An evolving diagnostic decision-support system.JAMA258:67–74DOI 10.1001/jama.1987.03400010071030.
Black AD, Car J, Pagliari C, Anandan C, Cresswell K, Bokun T, McKinstry B, Procter R, Majeed A, Sheikh A. 2011.The impact of eHealth on the quality and safety of health care: a systematic overview.PLoS Medicine8:e1000387
Bond WF, Schwartz LM, Weaver KR, Levick D, Giuliano M, Graber ML. 2012. Differ-ential diagnosis generators: an evaluation of currently available computer programs.
Journal of General Internal Medicine27:213–219DOI 10.1007/s11606-011-1804-8.
Choquet R, Landais P. 2014.The French national registry for rare diseases: an integrated model from care to epidemiology and research.Orphanet Journal of Rare Diseases
9(Suppl 1): Article O7 DOI 10.1186/1750-1172-9-S1-O7.
Daneshvari S, Youssof S, Kroth PJ. 2013.The NIH Office of Rare Diseases Research patient registry Standard: a report from the University of New Mexico’s Oculopha-ryngeal Muscular Dystrophy Patient Registry.AMIA Annual Symposium Proceedings
2013:269–277.
Dragusin R, Petcu P, Lioma C, Larsen B, Jørgensen HL, Cox IJ, Hansen LK, Ingwersen P, Winther O. 2013.FindZebra: a search engine for rare diseases.International Journal of Medical Informatics82:528–538DOI 10.1016/j.ijmedinf.2013.01.005.
Eadie LH, Taylor P, Gibson AP. 2012.Recommendations for research design and reporting in computer-assisted diagnosis to facilitate meta-analysis.Journal of Biomedical Informatics45:390–397DOI 10.1016/j.jbi.2011.07.009.
EURORDIS Consortium. 2016.About Rare Diseases | www.eurordis.org.Available at
http:// www.eurordis.org/ aboutrare-diseases.
Eysenbach G, Powell J, Kuss O, Sa E-R. 2002.Empirical studies assessing the quality of health information for consumers on the world wide web: a systematic review.JAMA
287:2691–2700.
Free C, Knight R, Robertson S, Whittaker R, Edwards P, Zhou W, Rodgers A, Cairns J, Kenward MG, Roberts I. 2011.Smoking cessation support delivered via mobile phone text messaging (txt2stop): a single-blind, randomised trial.Lancet378:49–55
DOI 10.1016/S0140-6736(11)60701-0.
Free C, Phillips G, Galli L, Watson L, Felix L, Edwards P, Patel V, Haines A. 2013a.The effectiveness of mobile-health technology-based health behaviour change or disease management interventions for health care consumers: a systematic review.PLoS Medicine10:e1001362DOI 10.1371/journal.pmed.1001362.
Free C, Phillips G, Watson L, Galli L, Felix L, Edwards P, Patel V, Haines A. 2013b.The effectiveness of mobile-health technologies to improve health care service delivery processes: a systematic review and meta-analysis.PLoS Medicine10:e1001363
DOI 10.1371/journal.pmed.1001363.
Genetic and Rare Diseases (GARD) Information Center. 2016.Office of Rare Diseases Research (ORDR-NCATS) | Supports Rare Disease Research and Information.
Available athttp:// rarediseases.info.nih.gov/.
Girdea M, Dumitriu S, Fiume M, Bowdin S, Boycott KM, Chénier S, Chitayat D, Faghfoury H, Meyn MS, Ray PN, So J, Stavropoulos DJ, Brudno M. 2013.
PhenoTips: patient phenotyping software for clinical and research use.Human Mutation34:1057–1065DOI 10.1002/humu.22347.
Howitt P, Darzi A, Yang G- Z, Ashrafian H, Atun R, Barlow J, Blakemore A, Bull AMJ, Car J, Conteh L, Cooke GS, Ford N, Gregson SAJ, Kerr K, King D, Kulendran M, Malkin RA, Majeed A, Matlin S, Merrifield R, Penfold HA, Reid SD, Smith PC, Stevens MM, Templeton MR, Vincent C, Wilson E. 2012.Technologies for global health.Lancet380:507–535DOI 10.1016/S0140-6736(12)61127-1.
Huckvale K, Car M, Morrison C, Car J. 2012.Apps for asthma self-management: a systematic assessment of content and tools.BMC Medicine10:144
DOI 10.1186/1741-7015-10-144.
Köhler S, Doelken SC, Mungall CJ, Bauer S, Firth HV, Bailleul-Forestier I, Black GCM, Brown DL, Brudno M, Campbell J, FitzPatrick DR, Eppig JT, Jackson AP, Freson K, Girdea M, Helbig I, Hurst JA, Jähn J, Jackson LG, Kelly AM, Ledbetter DH, Mansour S, Martin CL, Moss C, Mumford A, Ouwehand WH, Park S-M, Riggs ER, Scott RH, Sisodiya S, Van Vooren S, Wapner RJ, Wilkie AO, Wright CF, Vulto-van Silfhout AT, De Leeuw N, De Vries BB, Washingthon NL, Smith CL, Westerfield M, Schofield P, Ruef BJ, Gkoutos GV, Haendel M, Smedley D, Lewis SE, Robinson PN. 2014.The Human Phenotype Ontology project: linking molecular biology and disease through phenotype data.Nucleic Acids Research42(Database issue):D966–D974DOI 10.1093/nar/gkt1026.
Köhler S, Schulz MH, Krawitz P, Bauer S, Dölken S, Ott CE, Mundlos C, Horn D, Mundlos S, Robinson PN. 2009.Clinical diagnostics in human genetics with semantic similarity searches in ontologies.American Journal of Human Genetics
85:457–464DOI 10.1016/j.ajhg.2009.09.003.
Koutouzov S. 2010.The European research area network—E-Rare.Orphanet Journal of Rare Diseases5(Suppl 1): Article O15DOI 10.1186/1750-1172-5-S1-O15.
Lavandeira A. 2002.Orphan drugs: legal aspects, current situation.Haemophilia
8:194–198DOI 10.1046/j.1365-2516.2002.00643.x.
Lopes P, Oliveira JL. 2013.An innovative portal for rare genetic diseases research: the semantic Diseasecard.Journal of Biomedical Informatics46:1108–1115
DOI 10.1016/j.jbi.2013.08.006.
Lopman BA, Barnabas RV, Boerma JT, Chawira G, Gaitskell K, Harrop T, Mason P, Donnelly CA, Garnett GP, Nyamukapa C, Gregson S. 2006.Creating and validating an algorithm to measure AIDS mortality in the adult population using verbal
autopsy.PLoS Medicine3:e312DOI 10.1371/journal.pmed.0030312.
Maiella S, Rath A, Angin C, Mousson F, Kremp O. 2013.Orphanet and its consortium: where to find expert-validated information on rare diseases.Revue Neurologique (Paris)169(Suppl 1):S3–S8.
Mazzucato M, Houyez F, Facchin P. 2014.The importance of helplines in National Plans.Orphanet Journal of Rare Diseases9(Suppl 1): Article O12
DOI 10.1186/1750-1172-9-S1-O12.
McLean S, Sheikh A, Cresswell K, Nurmatov U, Mukherjee M, Hemmi A, Pagliari C. 2013.The impact of telehealthcare on the quality and safety of care: a systematic overview.PLoS ONE 8:e71238DOI 10.1371/journal.pone.0071238.
Morrison C, Jones M, Jones R, Vuylsteke A. 2013.‘You can’t just hit a button’: an ethno-graphic study of strategies to repurpose data from advanced clinical information systems for clinical process improvement.BMC Medicine11:103
DOI 10.1186/1741-7015-11-103.
ORPHANET. 2015.OrphaData.Available athttp:// www.orphadata.org/ cgi-bin/ inc/
product4.inc.php.
Polizzi A, Balsamo A, Bal MO, Taruscio D. 2014.Rare diseases research and practice.
Endocrine Development 27:234–256DOI 10.1159/000363670.
Porat S, De Rham M, Giamboni D, Van Mieghem T, Baud D. 2014.Phenotip—a web-based instrument to help diagnosing fetal syndromes antenatally.Orphanet Journal of Rare Diseases9: Article 204DOI 10.1186/s13023-014-0204-7.
Rath A, Olry A, Dhombres F, Brandt MM, Urbero B, Ayme S. 2012.Representation of rare diseases in health information systems: the Orphanet approach to serve a wide range of end users.Human Mutation33:803–808DOI 10.1002/humu.22078.
Schieppati A, Henter J-I, Daina E, Aperia A. 2008.Why rare diseases are an important medical and social issue.Lancet371:2039–2041
DOI 10.1016/S0140-6736(08)60872-7.
Sheikh A, Jha A, Cresswell K, Greaves F, Bates DW. 2014.Adoption of electronic health records in UK hospitals: lessons from the USA.Lancet 384:8–9
DOI 10.1016/S0140-6736(14)61099-0.
Soyer HP, Hofmann-Wellenhof R, Massone C, Gabler G, Dong H, Ozdemir F, Argen-ziano G. 2005.telederm.org: freely available online consultations in dermatology.
PLoS Medicine2:e87DOI 10.1371/journal.pmed.0020087.
Steele AW, Eisert S, Witter J, Lyons P, Jones MA, Gabow P, Ortiz E. 2005.The effect of automated alerts on provider ordering behavior in an outpatient setting.PLoS Medicine2:e255 DOI 10.1371/journal.pmed.0020255.
Töpel T, Scheible D, Trefz F, Hofestädt R. 2010.RAMEDIS: a comprehensive informa-tion system for variainforma-tions and corresponding phenotypes of rare metabolic diseases.
Human Mutation31:E1081–E1088DOI 10.1002/humu.21169.
Umscheid CA, Hanson CW. 2012.A follow-up report card on computer-assisted diagnosis—the grade: C+.Journal of General Internal Medicine27:142–144
DOI 10.1007/s11606-011-1944-x.
Wang S, Summers RM. 2012.Machine learning and radiology.Medical Image Analysis
16:933–951DOI 10.1016/j.media.2012.02.005.
Winther O, Svenstrup D, Henningsen PP, Kristiásson R, Jørgensen HL. 2014.
FindZebra—the search engine for difficult medical cases.Orphanet Journal of Rare Diseases9(Suppl 1): Article O5DOI 10.1186/1750-1172-9-S1-O5.