Submitted 18 June 2015
Accepted 21 August 2015
Published15 September 2015
Corresponding author C. Sofia Carvalho, [email protected]
Academic editor Antonio Palaz ´on-Bru
Additional Information and Declarations can be found on page 18
DOI10.7717/peerj.1236 Copyright
2015 Carvalho
Distributed under
Creative Commons CC-BY 4.0 OPEN ACCESS
Integrated probability of coronary heart
disease subject to the
−
308 tumor
necrosis factor-alpha SNP: a Bayesian
meta-analysis
C. Sofia Carvalho
Institute of Astrophysics and Space Sciences, University of Lisbon, Lisbon, Portugal
Research Center for Astronomy and Applied Mathematics, Academy of Athens, Athens, Greece
ABSTRACT
We present a meta-analysis of independent studies on the potential implication in the occurrence of coronary heart disease (CHD) of the single-nucleotide polymorphism (SNP) at the−308 position of the tumor necrosis factor alpha (TNF-alpha) gene. We use Bayesian analysis to integrate independent data sets and to infer statistically robust measurements of correlation. Bayesian hypothesis testing indicates that there is no preference for the hypothesis that the−308 TNF-alpha SNP is related to the occurrence of CHD, in the Caucasian or in the Asian population, over the null hypothesis. As a measure of correlation, we use the probability of occurrence of CHD conditional on the presence of the SNP, derived as the posterior probability of the Bayesian meta-analysis. The conditional probability indicates that CHD is not more likely to occur when the SNP is present, which suggests that the−308 TNF-alpha SNP is not implicated in the occurrence of CHD.
Subjects Bioinformatics, Cardiology, Statistics
Keywords Bayesian meta-analysis, Coronary heart disease,−308 TNF-alpha
INTRODUCTION
Coronary heart disease (CHD) is now widely accepted to consist of a chronic inflammatory disease (Hansson, 2005). CHD is a complex disease with multifold etiology, with both genetic and environmental factors contributing to its occurrence and development.
Among the genetic factors potentially implicated in the emergence of CHD, the tumor necrosis factor alpha (TNF-α) has attracted a great interest for its involvement in the inflammatory response of the immune system (Vassali, 1992). There is evidence that TNF-αis implicated in an increased susceptibility to the pathogenesis of a variety of diseases. In particular, high serum levels of TNF-αaffect endothelial cell hemostatic function and hence may modify the risk for developing CHD (Plutzky, 2001). There is also the suggestion that the TNF-αgene affects the modulation of lipid metabolism, obesity susceptibility and insulin resistance, thus being potentially implicated in the development of CHD (seeVourvouhaki & Dedoussis, 2008and references therein).
gene promoter. This SNP involves the substitution of guanine (G) for adenine (A) and the subsequent creation of two alleles (TNF1(A) and TNF2(G)) and three genotypes (GG, GA and AA) (Wilson et al., 1992). It has been hypothesised that the TNF-α SNP could change the susceptibility to CHD. However, the results on its association with CHD are contradictory, some implying different influence of the two alleles on the prevalence of CHD, others implying no association (seeZhang et al., 2011and references therein).
In order to infer the risk of CHD derived from potential risk factors, it is important to develop a formalism that infers correlations among different intervening factors and combines independent data sets for a consistent inference of the correlations. In
Vourvouhaki & Carvalho (2011)we introduced a formalism based on Bayesian inference to infer the correlation of the occurrence of CHD with two risk factors and tested a simplistic model for the signal pathway on the three-variable data set fromVendrell et al. (2003). In this manuscript, we extend the formalism to extract information from the combination of data from independent studies and to quantify the combined risk of occurrence of CHD
from the−308 TNF-αSNP.
The most exhaustive meta-analysis to date on this correlation is the frequentist analysis inZhang et al. (2011)covering Caucasian, Asian, Indian and African populations. This meta-analysis found a 1.5 fold increased risk of developing CHD when the SNP is present in the Caucasian population, but found no association in the other ethnicities. A more recent meta-analysis, covering the same data sets, found no association in the Caucasian or in the Asian population (Chu et al., 2013).
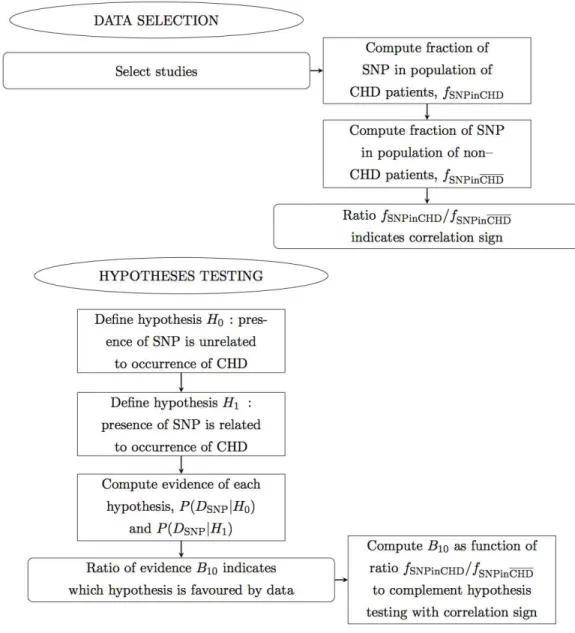
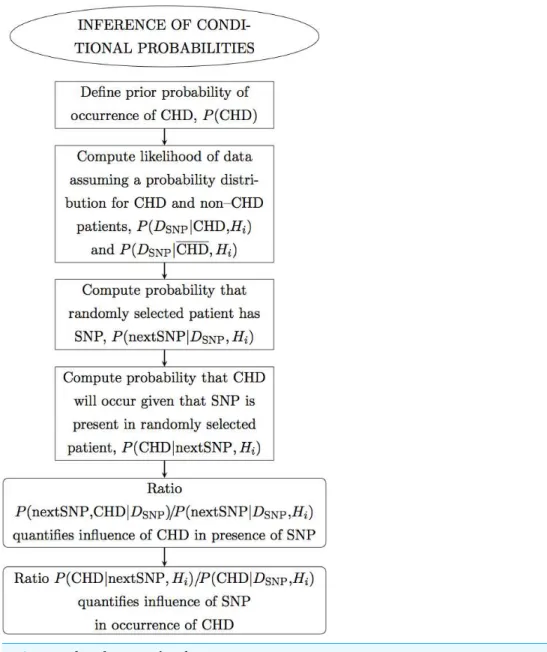
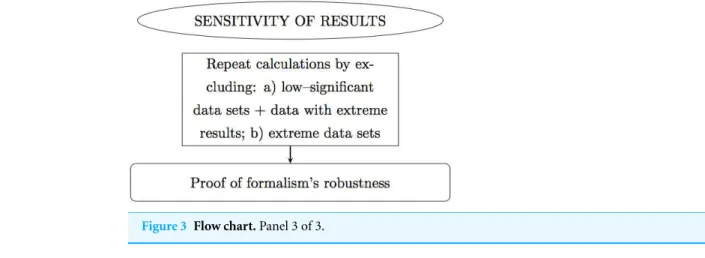
In this manuscript we propose a meta-analysis based on Bayesian analysis in an attempt to establish the potential implication of−308 TNF-αSNP in the occurrence of CHD. This manuscript is organized as follows. In ‘Methods’ we describe the method. In particular, in ‘Data selection’ we describe the data sets selected; in ‘Hypotheses testing’ we propose two hypotheses and test which best and most simply describes the data. In ‘Results’ we perform the Bayesian analysis of the selected data sets, combined by ethnicity and CHD phenotype, and present the results. In particular, in ‘Inference of conditional probabilities’ we infer the conditional probabilities for the occurrence of CHD given the presence of the SNP; in ‘Sensitivity of the results’ we test the sensitivity of this formalism to low-significance data sets, to data sets with extreme results and to extreme data sets. Finally in ‘Conclusions’ we draw the conclusions. Below there follows a flow chart describing summarily the reasoning of this meta-analysis (Figs. 1,2and3).
METHODS
Data selection
Figure 1 Flow chart.Panel 1 of 3. Ellipses indicate the main actions. Rectangles indicate detailed actions. Rectangles with rounded corners indicate the main results.
fifteen data sets from studies on Caucasians, where six studies are on the CHD phenotype coronary stenosis (CS) (Allen et al., 2001;Elahi et al., 2008;Georges et al., 2003;Sbarsi et al., 2007;Szalai et al., 2002;Vendrell et al., 2003) and nine studies are on the CHD phenotype myocardial infarction (MI) (Antonicelli et al., 2005;Bennet et al., 2006;Dedoussis et al., 2005;Herrmann et al., 1998;Koch et al., 2001;Padovani et al., 2000;Tobin et al., 2004;
Figure 2 Flow chart.Panel 2 of 3.
patients and one for not separating the CHD phenotypes); the study on Indians and the study on Africans (both for not separating the CHD phenotypes).
The data consist of frequencies of occurrence of the−308 TNF-αSNP in randomly
selected CHD patients and non-CHD patients, respectivelynSNP,CHDandnSNP,CHD. The
data are summarized inTable 1(columns 3–6). The errors indicated were computed from
Figure 3 Flow chart.Panel 3 of 3.
Table 1 Data sets and results of hypothesis testing.Column 1: Studies selected for the meta-analysis. The index (A) indicates that a possible association was measured in the original publication; the index (NA) indicates that no association was measured in the original publication. Column 2: The phenotype of the patients in the studies grouped by ethnicity. Columns 3–6: Genotypic frequencies of TNFα-308 in CHD patients and non-CHD (control) patients from twenty studies (indexedi) and for two CHD phenotypes (indexedj), namely coronary stenosis (CS) and myocardial infarction (MI). Columns 7–8: The Bayes factors for the hypotheses considered, for each data set(H1i,j/Hi0,j), and for the meta-data set of each CHD phenotype(Hj1/H0j).
Study Phenotype CHD patients Controls Bayes factor
(i) (j) GG GA/AA GG GA/AA (Hi1,j/H0i,j) (H1j/H0j)
Allen et al.(NA) 127 53 222 107 0.14±0.05
Elahi et al.(A) 59 38 41 54 3.54±1.12 0.049±0.014
Georges et al.(A) 613 236 222 92 0.08±0.03
Sbarsi et al.(A) 175 73 185 56 0.33±0.11 0.041±0.016
*
Szalai et al.(A) 229 89 181 87 0.19±0.07 0.048±0.019**
Vendrell et al.(A)
Cauc CS
231 110 159 48 1.33±0.46
Antonicelli et al.(A) 224 69 246 64 0.12±0.04
Bennet et al.(A) 799 368 1,037 460 0.05±0.02
Dedoussis et al.(A) 206 31 227 10 26.14±8.56
Herrmann et al.a(NA) 325 120 376 158 0.11±0.04 0.026±0.011
Herrmann et al.b(NA) 117 79 97 79 0.19±0.06 0.035±0.015*
Koch et al.(NA) 565 228 244 96 0.07±0.03
Padovani et al.(A) 120 28 114 34 0.17±0.06 0.030±0.012
**
Tobin et al.(A) 365 182 337 168 0.07±0.03
Tulyakova et al.(NA)
Cauc MI
242 64 177 69 0.60±0.21
Chen et al.(NA) 29 11 21 9 0.27±0.08
Hou et al.(NA) 268 32 802 103 0.05±0.02 0.151±0.057
Li et al.(NA) 66 8 138 20 0.12±0.04 0.114±0.043*
Li et al.(A) 234 52 142 34 0.10±0.03
Shun et al.(A)
Asian CS
54 19 118 20 1.10±0.34 0.103±0.037
**
Notes.
aFrench cohort.
bIrish cohort.
Data heterogeneity
In order to investigate the heterogeneity in the data sets, we compare the size of the effect (defined as a measure of the difference between CHD and non-CHD patients) in each study (Walker, Hernandez & Kattan, 2008). As a measure of the size of the effect, we use the fraction of SNP in the population of CHD patients and in the population
of non-CHD patients, respectivelyfSNPinCHD =nSNP,CHD/nCHD andfSNPinCHD =
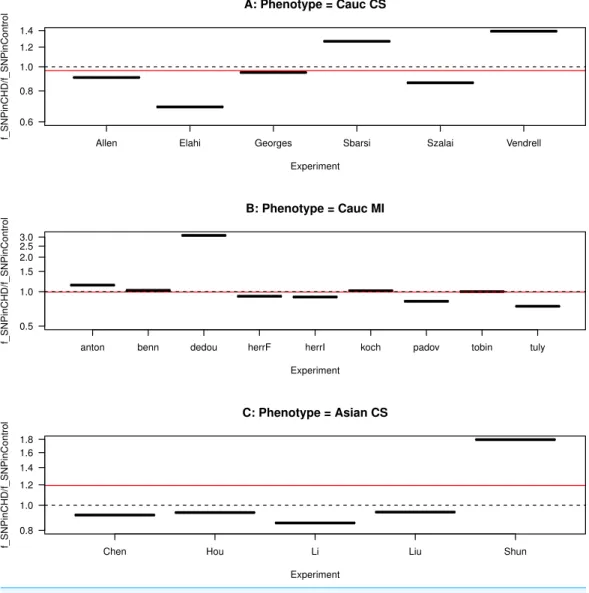
nSNP,CHD/nCHD, wherenCHD =nSNP,CHD+nSNP,CHDis the total number of CHD patients andnCHD=nSNP,CHD+nSNP,CHDis the total number of non-CHD patients. Moreover, the ratio of these two fractions gives an indication of the correlation sign. Hence, iffSNPinCHD/fSNPinCHD >1, the SNP is proportionally more frequent in CHD than in non-CHD patients, hence the study favours a positive correlation between the presence of the SNP and the occurrence of CHD; iffSNPinCHD/fSNPinCHD<1, the SNP is proportionally less frequent in CHD than in non-CHD patients, hence the study favours a negative correlation; iffSNPinCHD/fSNPinCHD=1, the SNP is equally frequent in CHD and in non-CHD patients, hence the study favours no correlation.
We plot this ratio of fractions for each study, grouped by ethnicity and CHD phenotype, inFig. 4. We also plot the ratio for the combined data sets included in each panel. We observe that the ratio of the data sets are asymmetrical distributed about the ratio equal to one, showing a predominance of ratios smaller than one. The ratio of the combined data sets included in each panel is slightly smaller than one for the Caucasian studies (for both CHD phenotypes) and larger than one for the Asian studies. This asymmetry indicates heterogeneity in the studies, as also observed in the meta-analysis ofZhang et al. (2011).
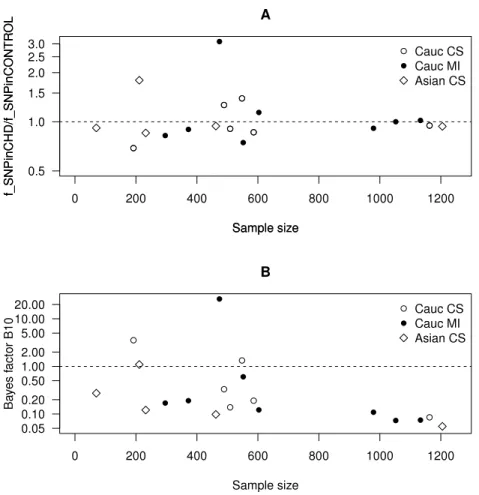
InFig. 5A, we plot this ratio of fractions as a function of the sample size. We observe that smaller data sets are distributed across a wide range of values of this ratio, whereas larger data sets are distributed more closely to one. This implies that smaller data sets favour either positive or negative correlation, whereas larger data sets favour no correlation.
Hypotheses testing
First we test the hypothesisH1that the presence of TNF-αSNP is related to the occurrence of CHD against the null hypothesisH0that the presence of the SNP is unrelated to the occurrence of CHD. By the Bayes theorem, the probability of a hypothesisHigiven the data DSNPis the posterior probability of the corresponding hypothesis
P(Hi|DSNP)=
P(DSNP|Hi)P(Hi)
P(DSNP) , (1)
whereP(DSNP|Hi)is the evidence,P(Hi)is the prior probability ofHi andP(DSNP)=
nP(DSNP|Hi)P(Hi).The subscript inDSNPreminds us that the random variable is the occurrence of the SNP. In order to infer which hypothesis is more likely in view of the data, we compare the evidence computed for the two hypotheses. The evidence is the integral of the likelihood over thej-dimensional parameter spacepi,jof the hypothesisHi
P(DSNP|Hi)=
Figure 4 Funnel plot for the ratio of SNP fractions.The ratio of the fraction of SNP in the population of CHD patients to the fraction of SNP in the population of non-CHD patients,fSNPinCHD/fSNPinCHD, for each study, grouped by ethnicity and CHD phenotype. (A) Caucasians with coronary stenosis; (B) Caucasians with myocardial infarction; (C) Asians with coronary stenosis. The solid horizontal line is the ratio of the combined data sets included in each panel. The dashed horizontal line marks the ratio equal to one.
Assuming equal prior probabilities for the two hypotheses, then fromEq. (1)it follows that
P(H1|DSNP)
P(H0|DSNP)=
P(DSNP|H1)
P(DSNP|H0). (3)
We compute the evidence of the two hypotheses, for each data set separately and for the combined data sets grouped by CHD phenotype. We follow the procedure detailed in
Figure 5 Scatter plots as a function of the sample size.(A) The ratio of the frequency of SNP in the CHD population to the frequency of SNP in the non-CHD population as a function of the sample size. (B) The Bayes factor for the two hypotheses discussed in the text as a function of the sample size.
The evidence ofH0,P(DSNP|H0), is computed assuming that the presence of the SNP is described by a binomial distribution with one parameter only, namely the probability
p0 that the SNP occurs in a given population. FornSNPoccurrences of the SNP and
nSNPnon-occurrences of the SNP in a sample of sizen=nSNP+nSNP, the likelihood P(DSNP|p0,H0)is given by
P(DSNP|p0,H0)=pnSNP
0 (1−p0)nSNP. (4)
Moreover, assuming a uniform prior distribution forp0,P(p0)=1, we find that
P(DSNP|H0)=
1
0
dp0P(DSNP|p0,H0)P(p0|H0)= nSNP!nSNP!
(nSNP+nSNP+1)!, (5)
wheren!stands for the factorial ofn.
occurs in the subset of non-CHD patients,
P(DSNP|H1)=
1
0
dp1,CHD 1
0
dp1,CHD
×P(DSNP|p1,CHD,p1,CHD,H1)P(p1,CHD,p1,CHD|H1). (6)
FornSNP,CHDoccurrences of the SNP andnSNP,CHDnon-occurrences of the SNP in a subset of CHD patientsnCHD=nSNP,CHD+nSNP,CHD, and also fornSNP,CHDoccurrences
of the SNP andnSNP,CHDnon-occurrences of the SNP in a subset of non-CHD patients
nCHD=nSNP,CHD+nSNP,CHD,the likelihoodP(DSNP|p1,CHD,p1,CHD,H1)is separable, i.e., it can be decomposed into the product of the likelihoodsP(DSNP|p1,CHD,H1)and P(DSNP|p1,CHD,H1), as follows
P(DSNP|p1,CHD,p1,CHD,H1)=p nSNP, CHD
1,CHD (1−p1,CHD) nSNP,CHD
×pnSNP,CHD
1,CHD (1−p1,CHD) nSNP,CHD
≡P(DSNP|p1,CHD,H1)P(DSNP|p1,CHD,H1). (7)
Assuming a uniform probability forp1,CHDandp1,CHD,P(p1,CHD,p1,CHD|H1)=1 and moreover that the priors onp1,CHDandp1,CHDare separable, the posterior distribution will also be separable and given by
P(DSNP|H1)=
1
0
dp1,CHDP(DSNP|p1,CHD,H1)P(p1,CHD|H1)
×
1
0
dp1,CHDP(DSNP|p1,CHD,H1)P(p1,CHD|H1)
=( nSNP,CHD!nSNP,CHD!
nSNP,CHD+nSNP,CHD+1)!
nSNP,CHD!nSNP,CHD!
(nSNP,CHD+nSNP,CHD+1)!. (8)
In order to compare the hypotheses, we take the ratio of the corresponding evidences, B10=P(H1|D)/P(H0|D), which we present inTable 1(columns 7–8). This quantity is known as the Bayes factor and gives empirical levels of significance for the strength of the evidence of the test hypothesis over that of the null hypothesis. It also encapsulates the Occam’s factor, which measures the adequacy of a hypothesis to the data over the parameter space of the hypothesis (MacKay, 2003). The levels of significance ascribed to the Bayes factor are calibrated by the Jeffrey’s scale (Kass & Raftery, 1995). According to this scale, a Bayes factor larger than one indicates thatH1is favoured overH0. Otherwise,H0 is favoured overH1. For the data sets taken separately, the results from this hypothesis test mostly agree with the corresponding results presented in the meta-analysis byChu et al.
(2013, see Fig. 1).
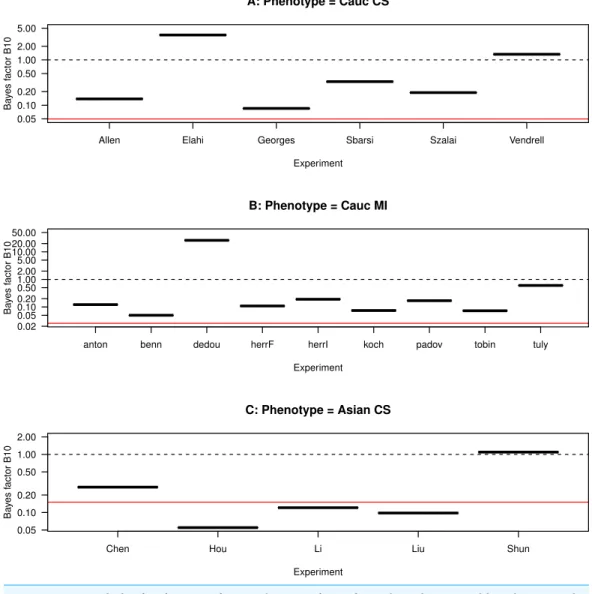
Figure 6 Funnel plot for the Bayes factor.The Bayes factor for each study, grouped by ethnicity and CHD phenotype. (A) Caucasians with coronary stenosis; (B) Caucasians with myocardial infarction; (C) Asians with coronary stenosis. The solid horizontal line marks the average Bayes factor of the data sets included in each panel. The dashed horizontal line marks the Bayes factor equal to one.
InFig. 5B, we plot the Bayes factor as a function of the sample size. We observe that smaller data sets are distributed across a wide range of values of the Bayes factor, whereas larger data sets are distributed across values smaller than one. This implies that smaller data sets favour eitherH0orH1, whereas larger data sets favourH0.
Correlation sign
ComparingFig. 6withFig. 4, we observe that, among the studies with Bayes factor larger than one,Elahi et al. (2008)has a ratiofSNPinCHD/fSNPinCHD<1, i.e., the SNP is proportionally less frequent in CHD than in non-CHD patients, which indicates a negative correlation between the presence SNP and the occurrence of CHD. Another example of comparatively large Bayes factor and low ratiofSNPinCHD/fSNPinCHDis the study of
Tulyakova et al. (2004). This indicates that the hypotheses as formulated do not distinguish the correlation sign.
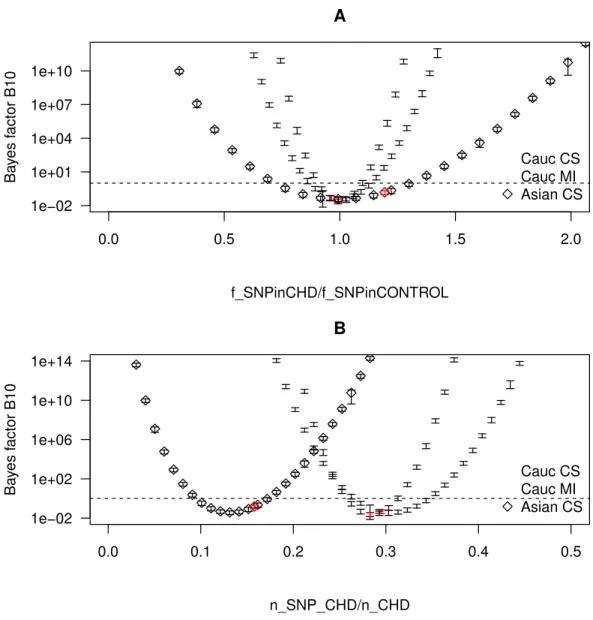
To further explore how the ratiofSNPinCHD/fSNPinCHDaffects the result of the hypothesis testing, we consider several realizations of CHD populations with the samenCHDbut with different fractions of SNP. More specifically for each combined data set, we varynSNP,CHD while varying simultaneouslynSNP,CHDso as to keepnCHDconstant. Throughout the different realizations, the size of the control population is kept equal to the size of the control population of the combined data sets grouped by ethnicity and CHD phenotype. For each realization, we compute bothfSNPinCHD(note thatfSNPinCHDis by construction kept fixed) andB10, and plot the results inFig. 7. The realizations with thefSNPinCHDof a real combined data set are marked as red points. InFig. 7A, we plotB10as a function of fSNPinCHD/fSNPinCHD, from which there result three parabolae centred at the same point. InFig. 7B, for a better visualization of the behaviour ofB10, we plotB10as a function of fSNPinCHD, from which there result three parabolae centred at different points. We observe thatB10follows a parabola, taking the minimum value whenfSNPinCHD/fSNPinCHD=1 and increasing in both directions with the increase of|fSNPinCHD/fSNPinCHD−1|, i.e., with the increase of the distance from 1. This confirms that the hypotheses as formulated do not distinguish between a positive correlation of the SNP with CHD (fSNPinCHD/fSNPinCHD>1) and a negative correlation (fSNPinCHD/fSNPinCHD<1). Hence, the value offSNPinCHD/fSNPinCHDcomplements the value ofB10in the characterization of the correlation.
RESULTS
Inference of conditional probabilities
Posterior probability for the occurrence of CHD
We proceed to compute the probability for the occurrence of CHD, i.e., given the data on the presence of the SNP, we determine the probability that a patient has CHD. This is defined as the posterior probability
P(CHD|DSNP,Hi)=
P(DSNP|(CHD,Hi)P(CHD) P(DSNP|Hi)
Figure 7 Bayes factor as a function of the frequency of SNP in the CHD populations.The Bayes factor for several realizations of CHD populations with the samenCHD but with different fractions of SNP, grouped by ethnicity and CHD phenotype. The realizations that correspond to a real combined data set are marked as red points. The dashed horizontal line marks the Bayes factor equal to one. (A) The Bayes factor as a function offSNPinCHD/fSNPinCHD. (B) The Bayes factor as a function offSNPinCHD.
The prior probabilityP(CHD)is based on the available information on the occurrence of CHD. This probability can be computed by combining all the risk factors per age interval per pathology. According to the European guidelines, less than 4 in 1,000 people have CS (Hamm et al., 2011), whereas about 1 in 1,000 people have MI (Steg et al., 2012). We then useP(CHD)=0.004 for CS andP(CHD)=0.001 for MI.
The evidenceP(DSNP|Hi)can be decomposed as
In the case ofH0,
P(DSNP|(CHD,H0)=
n nSNP
pnSNP
0 (1−p0)nSNP≡P(DSNP|H0)
P(DSNP|CHD,H0)=P(DSNP|H0), (11)
whereas in the case ofH1,
P(DSNP|(CHD,H1)=
nCHD nSNP,CHD
pn1,SNP,CHDCHD (1−p1,CHD)nSNP,CHD
P(DSNP|CHD,H1)=
nCHD nSNP,CHD
pnSNP,CHD
1,CHD (1−p1,CHD)nSNP,CHD. (12)
In the previous section, we computed the evidence by marginalizing the parameters of each hypothesis. Here, assuming a hypothesisHiand using the Bayes theorem, we compute the posterior probability of each parameterpi,jgiven the data
P(pi,j|DSNP)=
P(DSNP|pi,j)P(pi,j|Hi) P(DSNP|Hi)
, (13)
and find forpi,jthe value that maximizes the likelihoodP(DSNP|pi,j).In the case ofH0, we compute the posterior probability of the single parameterpi,j=p0, whereP(DSNP|p0)is given byEq. (4),P(DSNP|H0)is given byEq. (5)andP(p0|H0)is assumed uniform. Taking the derivative with respect top0and solving fordP(p0|DSNP)/dp0=0, we find for the
maximum-likelihood value ofp0the value
p0(maxL)=
nSNP
(nSNP+nSNP). (14)
Similarly in the case ofH1, we compute the posterior probability of each of the two parameterspi,j= {p1,CHD,p1,CHD}, whereP(DSNP|p1,CHD)andP(DSNP|p1,CHD)are given byEq. (6),P(DSNP|H1)is given byEq. (8)and bothP(p1,CHD|H1)andP(p1,CHD|H1) are assumed uniform, finding for the maximum-likelihood values ofp1,CHDandp1,CHD respectively
p1,CHD(maxL)=
nSNP,CHD
(nSNP,CHD+nSNP,CHD), (15)
p1,CHD(maxL)= nSNP,CHD
(nSNP,CHD+nSNP,CHD). (16)
Analogously we define the posterior probability
P(CHD|DSNP,Hi)=
P(DSNP|CHD,Hi)P(CHD) P(DSNP|Hi)
. (17)
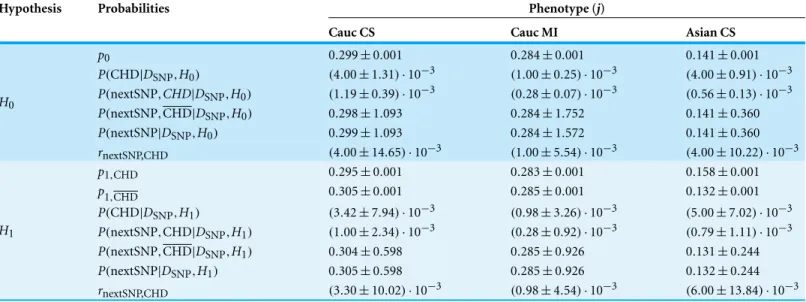
Table 2 Probabilities inferred from the combined data sets.To each hypothesis there correspond several rows consisting of (A) the parameters pi,jgiven by the maximum-likelihood values, in particular,p0 (hence one row) in the case ofH0,p1,CHD andp1,CHD (hence two rows) in the case ofH1;(B) the posterior probability for the occurrence of (CHD,P(CHD|DSNP,Hi)(hence one row for each hypothesis); (C) the predicted
probabilities for the presence of the SNP, namely P(nextSNP,CHD|DSNP,Hi),P(nextSNP,CHD|DSNP,Hi) andP(nextSNP|DSNP,Hi)(hence
three rows for each hypothesis); and (D) the probability ratio that measures the influence of CHD in the presence of the SNP,rnextSNP,CHD≡
P(nextSNP,CHD|DSNP,Hi)/P(nextSNP|DSNP,Hi), computed from the combined data of each phenotype (hence one row for each hypothesis).
Column 1: The hypotheses. Column 2: The inferred quantities, as described above. Columns 3–5: The values of the inferred quantities for the combined ethnicity and CHD phenotype.
Hypothesis Probabilities Phenotype (j)
Cauc CS Cauc MI Asian CS
p0 0.299±0.001 0.284±0.001 0.141±0.001
P(CHD|DSNP,H0) (4.00±1.31)·10−3 (1.00±0.25)·10−3 (4.00±0.91)·10−3
P(nextSNP,CHD|DSNP,H0) (1.19±0.39)·10−3 (0.28±0.07)·10−3 (0.56±0.13)·10−3
P(nextSNP,CHD|DSNP,H0) 0.298±1.093 0.284±1.752 0.141±0.360
P(nextSNP|DSNP,H0) 0.299±1.093 0.284±1.572 0.141±0.360
H0
rnextSNP,CHD (4.00±14.65)·10−3 (1.00±5.54)·10−3 (4.00±10.22)·10−3
p1,CHD 0.295±0.001 0.283±0.001 0.158±0.001
p1,CHD 0.305±0.001 0.285±0.001 0.132±0.001 P(CHD|DSNP,H1) (3.42±7.94)·10−3 (0.98±3.26)·10−3 (5.00±7.02)·10−3
P(nextSNP,CHD|DSNP,H1) (1.00±2.34)·10−3 (0.28±0.92)·10−3 (0.79±1.11)·10−3
P(nextSNP,CHD|DSNP,H1) 0.304±0.598 0.285±0.926 0.131±0.244
P(nextSNP|DSNP,H1) 0.305±0.598 0.285±0.926 0.132±0.244
H1
rnextSNP,CHD (3.30±10.02)·10−3 (0.98±4.54)·10−3 (6.00±13.84)·10−3
In the case ofH0, no information is added to the posterior probability, since byEq. (11) the posterior probabilities equal the prior. Conversely in the case ofH1, information is added to the posterior probability, since byEq. (12)there result posterior probabilities different from the prior albeit compatible with the prior.
Prediction of the presence of the SNP
We now proceed to compute the probability for the presence of the SNP, i.e., given the data, we determine the probability that a randomly selected patient (with or without CHD) has the SNP. This probability is defined as
P(nextSNP|DSNP,Hi)=P(nextSNP|DSNP,CHD)P(CHD|DSNP,Hi)
+P(nextSNP|DSNP,CHD)P(CHD|DSNP,Hi)
≡P(nextSNP,CHD|DSNP,Hi)+P(nextSNP,CHD|DSNP,Hi). (18)
In the case ofH0,
P(nextSNP|DSNP,CHD)=P(nextSNP|DSNP,CHD)=p0, (19)
whereas in the case ofH1,
P(nextSNP|DSNP,CHD)=p1,CHD,
Using the maximum-likelihood values ofpi,jand the posterior probabilityP(CHD|DSNP, Hi)computed above, we computeP(nextSNP|DSNP,Hi), which we present inTable 2.
For completion, using the Bayes theorem, we invertP(nextSNP|DSNP,CHD)to find the probability that CHD will occur given that the SNP is present in a randomly selected patient
P(CHD|nextSNP,Hi)=
P(nextSNP|DSNP,CHD)P(CHD|DSNP,Hi) P(nextSNP|DSNP,Hi)
. (21)
Similarly, invertingP(nextSNP|DSNP,CHD), we find the probability that CHD will not occur given that the SNP is present in a randomly selected patient,P(CHD|nextSNP,Hi),
which can be found simply by replacing CHD by CHD inEq. (21).
In order to quantify the influence of CHD in the presence of the SNP, we compute the ratio ofP(nextSNP,CHD|DSNP)toP(nextSNP|DSNP,Hi), which gives an estimate of how much the occurrence of CHD indicates the presence of the SNP. This is also the probability inEq. (21). In the case ofH0, this ratio equals the posterior probability of occurrence of CHD. Conversely in the case ofH1, this ratio is different from the posterior probability of occurrence of CHD albeit compatible with it. The occurrence of CHD indicates the presence of the SNP in of order 0.1% of patients (0.1–0.4% in the case ofH0, 0.1–0.6% in the case ofH1), which suggests that the occurrence of CHD is not a good marker for the presence of the SNP.
In order to quantify the influence of the SNP in the occurrence of (CHD, we compute the ratio ofP(CHD|nextSNP,Hi)toP(CHD|DSNP,Hi), which gives an estimate of how much the presence of the SNP indicates the occurrence of CHD. This is also the probability inEqs. (19)and(20). The presence of SNP indicates the occurrence of CHD in of order 0.1% of patients (0.141–0.299% in the case ofH0, 0.158–0.295% in the case ofH1), which suggests that the presence of the SNP is not a risk factor for the emergence of CHD.
Sensitivity of the results
To test the robustness of this meta-analysis, we conceive two tests of the sensitivity of the results, namely to low-significance data sets, to data sets with extreme results and to extreme data sets.
To test the sensitivity of the results to low-significance data sets, we exclude the data sets with comparatively small sample sizes for the same CHD phenotype, namely the study byElahi et al. (2008)and the study byChen et al. (2001), from the combination. We also exclude the studies with extreme results (i.e., the studies with the largest Bayes factor), namely the study inDedoussis et al. (2005). We recompute both the Bayes factors (Table 1) and the probabilities of CHD (Table 3). We observe that the Bayes factor in the
new combination changes by 18%,−38% and 24%, respectively for the CS Caucasian, the
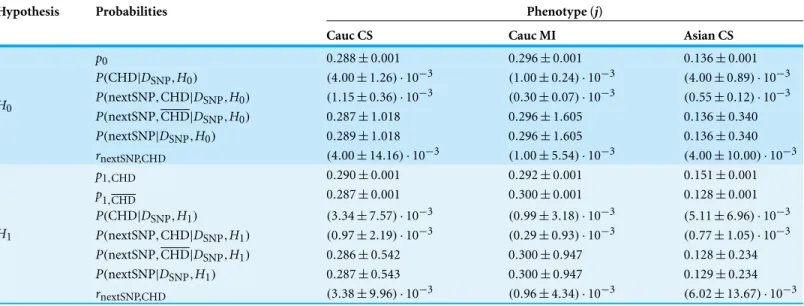
Table 3 Probabilities inferred from the combined data sets excluding the low-significance data sets and the data sets with extreme results. Ex-cluded:Elahi et al. (2008),Dedoussis et al. (2005)andChen et al. (2001). Similarly toTable 2, to each hypothesis there correspond several rows consisting of: (A) the parameters given by the maximum-likelihood values (one row in the case ofH0 and two rows in the case ofH1); (B) the posterior probability for the occurrence of CHD (one row for each hypothesis); (C) the predicted probabilities for the presence of the SNP (three rows for each hypothesis); and (D) the probability ratio that measures the influence of CHD in the presence of the SNP, computed from the combined data of each phenotype (one row for each hypothesis). Column 1: The hypotheses. Column 2: The inferred quantities, as described above. Columns 3–5: The values of the inferred quantities for the combined ethnicity and CHD phenotype.
Hypothesis Probabilities Phenotype (j)
Cauc CS Cauc MI Asian CS
p0 0.288±0.001 0.296±0.001 0.136±0.001
P(CHD|DSNP,H0) (4.00±1.26)·10−3 (1.00±0.24)·10−3 (4.00±0.89)·10−3
P(nextSNP,CHD|DSNP,H0) (1.15±0.36)·10−3 (0.30±0.07)·10−3 (0.55±0.12)·10−3
P(nextSNP,CHD|DSNP,H0) 0.287±1.018 0.296±1.605 0.136±0.340
P(nextSNP|DSNP,H0) 0.289±1.018 0.296±1.605 0.136±0.340
H0
rnextSNP,CHD (4.00±14.16)·10−3 (1.00±5.54)·10−3 (4.00±10.00)·10−3
p1,CHD 0.290±0.001 0.292±0.001 0.151±0.001
p1,CHD 0.287±0.001 0.300±0.001 0.128±0.001 P(CHD|DSNP,H1) (3.34±7.57)·10−3 (0.99±3.18)·10−3 (5.11±6.96)·10−3
P(nextSNP,CHD|DSNP,H1) (0.97±2.19)·10−3 (0.29±0.93)·10−3 (0.77±1.05)·10−3
P(nextSNP,CHD|DSNP,H1) 0.286±0.542 0.300±0.947 0.128±0.234
P(nextSNP|DSNP,H1) 0.287±0.543 0.300±0.947 0.129±0.234
H1
rnextSNP,CHD (3.38±9.96)·10−3 (0.96±4.34)·10−3 (6.02±13.67)·10−3
study byDedoussis et al. (2005)from the MI Caucasian population causes predominantly negative differences.
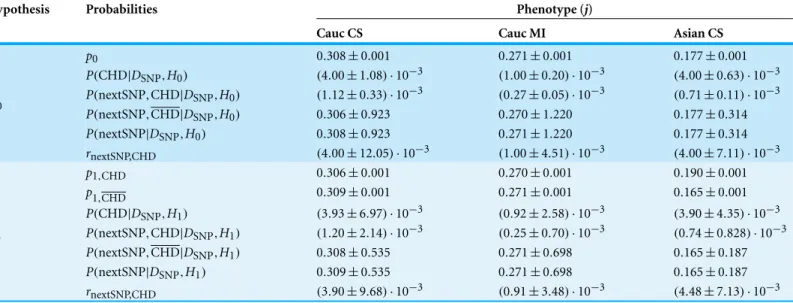
To test the sensitivity of the results to extreme data sets, we exclude the data sets with comparatively large samples sizes for the same CHD phenotype, namely the study by
Georges et al. (2003), the study byBennet et al. (2006)and the study byHou et al. (2009), from the combination. These are also the studies with the smallest Bayes factor for each CHD phenotype. We recompute both the Bayes factors (Table 1) and the probabilities of CHD (Table 4). We observe that the Bayes factor in the new combination changes by
3%,−19% and 32%, respectively for the CS Caucasian, the MI Caucasian and the CS
Asian population. The inferred parameters and probabilities vary by−20 to−1%, 5 to
11%, and−26 to 25%, respectively for the CS Caucasian, the MI Caucasian and the CS
Asian population. The largest difference is observed for the CS Asian population due to the exclusion of the study byHou et al. (2009). The exclusion of the study byGeorges et al. (2003)from the CS Caucasian population causes predominantly negative differences.
Table 4 Probabilities inferred from the combined data sets excluding the extreme data sets.Excluded:Georges et al. (2003),Bennet et al. (2006)
and Hou et al. (2009). Similarly toTable 2, to each hypothesis there correspond several rows consisting of: (A) the parameters given by the
maximum-likelihood values (one row in the case ofH0and two rows in the case ofH1); (B) the posterior probability for the occurrence of CHD (one row for each hypothesis); (C) the predicted probabilities for the presence of the SNP (three rows for each hypothesis); and (D) the probability ratio that measures the influence of CHD in the presence of the SNP, computed from the combined data of each phenotype (one row for each hypothesis). Column 1: The hypotheses. Column 2: The inferred quantities, as described above. Columns 3–5: The values of the inferred quantities for the combined ethnicity and CHD phenotype.
Hypothesis Probabilities Phenotype (j)
Cauc CS Cauc MI Asian CS
p0 0.308±0.001 0.271±0.001 0.177±0.001
P(CHD|DSNP,H0) (4.00±1.08)·10−3 (1.00±0.20)·10−3 (4.00±0.63)·10−3
P(nextSNP,CHD|DSNP,H0) (1.12±0.33)·10−3 (0.27±0.05)·10−3 (0.71±0.11)·10−3
P(nextSNP,CHD|DSNP,H0) 0.306±0.923 0.270±1.220 0.177±0.314
P(nextSNP|DSNP,H0) 0.308±0.923 0.271±1.220 0.177±0.314
H0
rnextSNP,CHD (4.00±12.05)·10−3 (1.00±4.51)·10−3 (4.00±7.11)·10−3
p1,CHD 0.306±0.001 0.270±0.001 0.190±0.001
p1,CHD 0.309±0.001 0.271±0.001 0.165±0.001 P(CHD|DSNP,H1) (3.93±6.97)·10−3 (0.92±2.58)·10−3 (3.90±4.35)·10−3
P(nextSNP,CHD|DSNP,H1) (1.20±2.14)·10−3 (0.25±0.70)·10−3 (0.74±0.828)·10−3
P(nextSNP,CHD|DSNP,H1) 0.308±0.535 0.271±0.698 0.165±0.187
P(nextSNP|DSNP,H1) 0.309±0.535 0.271±0.698 0.165±0.187
H1
rnextSNP,CHD (3.90±9.68)·10−3 (0.91±3.48)·10−3 (4.48±7.13)·10−3
CONCLUSIONS
In this manuscript we investigated the correlation between the occurrence of CHD with the presence of the−308 TNF-αSNP from fifteen independent data sets on Caucasians for two CHD phenotypes and from five independent data sets on Asian for one CHD phenotype. We showed how to combine independent data sets and to infer correlations using Bayesian analysis.
Hypothesis testing on the combined data sets indicated that there is no evidence for a correlation between the occurrence of CHD and the presence of the SNP, either on Caucasians or on Asians. This result agrees with previous meta-analyses (Zhang et al., 2011;
Chu et al., 2013). As a measure of an eventual correlation, we computed the conditional probability of CHD given the SNP, normalized to the probability that CHD occurs, finding that the presence of the SNP indicates the occurrence of CHD in of order 0.1% of patients, i.e., in of order 0.1% of the occurrence of CHD is concomitant with the presence of SNP. We also tested the sensitivity of the results by excluding selected data sets from the meta-analysis. We found changes of order 10%, leaving the results unchanged and thus establishing this formalism as significantly robust.
ACKNOWLEDGEMENT
The author thanks E Vourvouhaki and G Tsiliki for useful discussions.
ADDITIONAL INFORMATION AND DECLARATIONS
Funding
The author is funded by Fundacao para a Ciencia e a Tecnologia (FCT), Grant no. SFRH/BPD/65993/2009. The funders had no role in study design, data collection and analysis, decision to publish, or preparation of the manuscript.
Grant Disclosures
The following grant information was disclosed by the author:
Fundacao para a Ciencia e a Tecnologia (FCT): SFRH/BPD/65993/2009.
Competing Interests
The author declares there are no competing interests.
Author Contributions
• C. Sofia Carvalho analyzed the data, wrote the paper, prepared figures and/or tables, reviewed drafts of the paper.
REFERENCES
Allen RA, Lee EM, Roberts DH, Park BK, Pirmohamed M. 2001.Polymorphisms in the
TNF-alpha and TNF-receptor genes in patients with coronary artery disease.European Journal of Clinical Investigation31:843–851DOI 10.1046/j.1365-2362.2001.00907.x.
Antonicelli R, Olivieri F, Cavallone L, Spazzafumo L, Bonafe M, Marchegiani F, Cardelli M,
Galeazzi R, Giovagnetti S, Perna GP, Franceschi C. 2005.Tumor necrosis factor-alpha gene
−308G→A polymorphism is associated with ST-elevation myocardial infarction and with high plasma levels of biochemical ischemia markers.Coronary Artery Disease16:489–493 DOI 10.1097/00019501-200512000-00006.
Bennet AM, Van Maarle MC, Hallqvist J, Morgenstern R, Frostegard J, Wiman B, Prince JA,
De Faire U. 2006.Association of TNF-alpha serum levels and TNFA-alpha promoter
polymorphisms with risk of myocardial infarction. Atherosclerosis 187:408–414 DOI 10.1016/j.atherosclerosis.2005.09.022.
Chen ZQ, Zheng ZF, Ma JF, Qiu FY, Shi Sl, Chen H. 2001.Plasma levels at TNF-αbut not TNF-α
G-308A gene polymorphism, is associated with coronary heart disease.Chinese Journal of Geriatric Cardiovascular and Cerebrovascular Diseases6:156–158.
Chu H, Yang J, Mi S, Bhuyan SS, Li J, Zhong L, Liu S, Tao Z, Li J, Chen H. 2013.Tumor necrosis
factor-alpha G-308 A polymorphism and risk of coronary heart disease and myocardial infarction: a case-control study and meta-analysis.Journal of Cardiovascular Disease Research
3:84–90DOI 10.4103/0975-3583.95359.
Dedoussis GV, Panagiotakos DB, Vidra NV, Louizou E, Chrysohoou C, Germanos A,
Mantas Y, Tokmakidis S, Pitsavos C, Stefanadis C. 2005.Association between TNF-alpha
Greek subjects: the CARDIO2000-GENE Study.Genetics in Medicine7(6):411–416 DOI 10.1097/01.GIM.0000170993.75385.F4.
Elahi MM, Gilmour A, Matata BM, Mastana SS. 2008.A variant of position−308 of the Tumor
necrosis factor alpha gene promoter and the risk of coronary heart disease.Human Molecular Genetics17(1):14–18.
Georges JL, Rupprecht HJ, Blankenberg S, Poirier O, Bickel C, Hafner G, Nicaud V, Meyer J,
Cambien F, Tiret L. 2003.Impact of pathogen burden in patients with coronary artery disease
in relation to systemic inflammation and variation in genes encoding cytokines.American Journal of Cardiology92:515–521DOI 10.1016/S0002-9149(03)00717-3.
Hamm CW, Bassand J-P, Agewall S, Bax J, Boersma E, Bueno H, Caso P, Dudek D, Gielen S, Huber K, Ohman M, Petrie MC, Sonntag F, Uva MS, Storey RF, Wijns W, Zahger D, Bax JJ, Auricchio A, Baumgartner H, Ceconi C, Dean V, Deaton C, Fagard R, Funck-Brentano C, Hasdai D, Hoes A, Knuuti J, Kolh P, McDonagh T, Moulin C, Poldermans D, Popescu BA, Reiner Z, Sechtem U, Sirnes PA, Torbicki A, Vahanian A, Windecker S, Windecker S, Achenbach S, Badimon L, Bertrand M, Botker HE, Collet J-P, Crea F, Danchin N, Falk E, Goudevenos J, Gulba D, Hambrecht R, Herrmann J, Kastrati A, Kjeldsen K, Kristensen SD,
Lancellotti P, Mehilli J, Merkely B, Montalescot G, Neumann F-J, Neyses L, Perk J, RoffiM,
Romeo F, Ruda M, Swahn E, Valgimigli M, Vrints CJ, Widimsky P. 2011.ESC Guidelines
for the management of acute coronary syndromes in patients presenting without persistent ST-segment elevation.European Heart Journal32:2999–3054DOI 10.1093/eurheartj/ehr236.
Hansson GK. 2005.Inflammation, atherosclerosis and coronary heart disease.New England
Journal of Medicine352:1685–1695DOI 10.1056/NEJMra043430.
Herrmann SM, Ricard S, Nicaud V, Mallet C, Arveiler D, Evans A, Ruidavets JB, Luc G, Bara L,
Parra HJ, Poirier O, Cambien F. 1998.Polymorphims of the tumor necrosis factor-alpha
gene, coronary heart disease and obesity.European Journal of Clinical Investigation28:59–66 DOI 10.1046/j.1365-2362.1998.00244.x.
Hou L, Huang J, Lu X, Wang L, Fan Z, Gu D. 2009.Polymorphisms of tumor necrosis factor-α
gene and coronary hear disease in a Chinese Han population: interaction with cigarette smoking.Thrombosis Research123:822–826DOI 10.1016/j.thromres.2008.07.016.
Kass RE, Raftery AE. 1995. Bayes Factors. Journal of the American Statistical Association
90(430):773–795DOI 10.1080/01621459.1995.10476572.
Koch W, Kastrati A, B¨ottiger C, Mehili J, Von Beckerath N, Schomig A. 2001.Interleukin-10 and
tumor necrosis factor gene polymorphisms and risks of coronary artery disease and myocardial infarction.Arterosclerosis159:137–144DOI 10.1016/S0021-9150(01)00467-1.
Liu Y, Jin W, Lu L, Chen QJ, Shen WF. 2009. Association between single nucleotide
polymorphism in the promoter of tumor necrosis factor-αgene and coronary heart disease. Journal of Diagnostics Concepts & Practice5:506–509.
Li Y, Xu P, Chen H, Zhang PA, Huang CX. 2003.Association between tumor necrosis factor-α
G-308A gene polymorphism and coronary heart disease: a case-control study.Chinese Journal of Geriatrics9:568–569.
MacKay DJC. 2003.Information Theory, Inference, and Learning Algorithms. Cambridge:
Cambridge University Press.
Padovani JC, Pazin–Filho A, Simoes MV, Marin–Neto JA, Zago MA, Franco RF. 2000.Gene
polymorphisms in the TNF locus and the risk of myocardial infarction.Thrombosis Research
100:263–269DOI 10.1016/S0049-3848(00)00315-7.
Plutzky J. 2001.Inflammatory pathways in atherosclerosis and acute coronary syndromes.
Sbarsi I, Falcon C, Boiocchi C, Campo I, Zorzetto M, De Silvestri A, Cuccia M. 2007.
Inflammation and atherosclerosis: the role of TNF and TNH receptors polymorphisms in coronary artery disease.International Journal of Immunopathology and Pharmacology
20:145–154.
Sharifian H. 2010.Errors induced during PCR amplification. Master Thesis, ETH Zurich.Available
athttp://dx.doi.org/10.3929/ethz-a-006088024.
Shun SY, Zeng XQ, Qi AM, Fan WH, Zhang JC. 2009.Association of tumor necrosis factor-αgene
polymorphisms in the promoter region with chronic periodontitis and coronary heart disease. Journal of Clinical Stomatology5:279–282.
Steg G, James SK, Atar D, Badano LP, Lundqvist CB, Borger MA, Di Mario C, Dickstein K, Ducrocq G, Fernandez-Aviles F, Gershlick AH, Giannuzzi P, Halvorsen S, Huber K,
Juni P, Kastrati A, Knuuti J, Lenzen MJ, Mahaffey KW, Valgimigli M, van’t Hof A,
Widimsky P, Zahger D, Bax JJ, Baumgartner H, Ceconi C, Dean V, Deaton C, Fagard R, Funck-Brentano C, Hasdai D, Hoes A, Kirchhof P, Knuuti J, Kolh P, McDonagh T,
Moulin C, Popescu BA, Reiner ˇZ, Sechtem U, Sirnes PA, Tendera M, Torbicki A, Vahanian A,
Windecker S, Hasdai D, Astin F, ˚Astr¨om-Olsson K, Budaj A, Clemmensen P, Collet J-P,
Fox KA, Fuat A, Gustiene O, Hamm CW, Kala P, Lancellotti P, Maggioni AP, Merkely B,
Neumann F-J, Piepoli MF, Van de Werf F, Verheugt F, Wallentin L. 2012.ESC Guidelines
for the management of acute myocardial infarction in patients presenting with ST-segment elevation.European Heart Journal33(20):2569–2619DOI 10.1093/eurheartj/ehs215.
Szalai C, F¨ust G, Duba J, Kramer J, Romics L, Proh´aszka Z, Cs´asz´ar A. 2002.Association
of polymorphisms and allelic combinations in the tumour necrosis factor-alpha
complement MHC region with coronary artery disease.Journal of Medical Genetics39:46–51 DOI 10.1136/jmg.39.1.46.
Tobin MD, Braund PS, Burton PR, Thompson JR, Steeds R, Channer K, Cheng S,
Lindpaintner K, Samani NJ. 2004.ia multilocus case-control study.European Heart Journal
25:459–467DOI 10.1016/j.ehj.2003.11.014.
Tulyakova G, Nasibullin T, Salmanov A, Avzaletdinova, Khusnutdinova E, Zakirova A,
Mustafina O. 2004.Association of the−308 (G→A) polymorphism of tumor necrosis factor-α
with myocardial infarction and sudden cardiac death.Balkan Journal of Medical Genetics
8:31–35.
Vassali P. 1992.The pathophysiology of tumor necrosis factors.Annual Review of Immunology
10:411–452DOI 10.1146/annurev.iy.10.040192.002211.
Vendrell J, Fernandez-Real J-M, Gutierrez C, Zamora A, Simon I, Bardaji A, Ricart W,
Richart C. 2003.A polymorphism in the promoter of the tumor necrosis factor-αgene (−308)
is associated with coronary disease in type 2 diabetic patients.Atherosclerosis167:257–264 DOI 10.1016/S0021-9150(02)00429-X.
Vourvouhaki E, Carvalho CS. 2011.A Bayesian approach to the probability of coronary heart
disease subject to genetic risk factors.BioSystems105:181–189 arXiv:0907.2043 [g-bio.QM] DOI 10.1016/j.biosystems.2011.03.010.
Vourvouhaki E, Dedoussis GV. 2008. Cholesterol ester transfer protein: a
therapeu-tic target in atherosclerosis? Expert Opinion on Therapeutic Targets 12:937–948 DOI 10.1517/14728222.12.8.937.
Walker E, Hernandez AV, Kattan MW. 2008.Meta-analysis: its strengths and limitations.
Wilson AG, Di Giovine FS, Blakemore AI, DuffGW. 1992.Single base polymorphism in the humor tumour necrosis factor alpha (TNF alpha) gene detectable by NcoI restriction of PCR product.Human Molecular Genetics1:353–353DOI 10.1093/hmg/1.5.353.
Zhang HF, Xie SL, Wang JF, Chen YX, Wang Y, Huang TC. 2011.Tumor necrosis factor-alpha