Submitted24 July 2015
Accepted 27 August 2016
Published13 October 2016
Corresponding author
Leontine E. Becking, lisa.becking@wur.nl
Academic editor
Rita Castilho
Additional Information and Declarations can be found on page 14
DOI10.7717/peerj.2496
Copyright
2016 Becking et al.
Distributed under
Creative Commons CC-BY 4.0
OPEN ACCESS
Highly divergent mussel lineages in
isolated Indonesian marine lakes
Leontine E. Becking1,2,3, Christiaan A. de Leeuw2,4, Bram Knegt4, Diede L. Maas2,
Nicole J. de Voogd3, Abdunnur5, Iwan Suyatna5and Katja T.C.A. Peijnenburg3,4
1Department of Environmental Science, Policy, and Management, University of California, Berkeley, CA, USA 2Department of Marine Animal Ecology, Wageningen University & Research, Wageningen, The Netherlands 3Department of Marine Biodiversity, Naturalis Biodiversity Center, Leiden, The Netherlands
4Institute for Biodiversity and Ecosystem Dynamics, University of Amsterdam, Amsterdam, The Netherlands 5Faculty of Fisheries and Marine Sciences, Mulawarman University, Samarinda, East Kalimantan, Indonesia
ABSTRACT
Marine lakes, with populations in landlocked seawater and clearly delineated contours, have the potential to provide a unique model to study early stages of evolution in coastal marine taxa. Here we ask whether populations of the musselBrachidontesfrom marine lakes in Berau, East Kalimantan (Indonesia) are isolated from each other and from the coastal mangrove systems. We analyzed sequence data of one mitochondrial marker (Cytochrome Oxidase I (COI)), and two nuclear markers (18S and 28S). In addition, we examined shell shape using a geometric morphometric approach. The Indonesian populations ofBrachidontesspp. harbored four deeply diverged lineages (14–75% COI corrected net sequence divergence), two of which correspond to previously recorded lineages from marine lakes in Palau, 1,900 km away. These four lineages also showed significant differences in shell shape and constitute a species complex of at least four undescribed species. Each lake harbored a different lineage despite the fact that the lakes are separated from each other by only 2–6 km, while the two mangrove populations, at 20 km distance from each other, harbored the same lineage and shared haplotypes. Marine lakes thus represent isolated habitats. As each lake contained unique within lineage diversity (0.1–0.2%), we suggest that this may have resulted from in situ divergence due to isolation of founder populations after the formation of the lakes (6,000–12,000 years before present). Combined effects of stochastic processes, local adaptation and increased evolutionary rates could produce high levels of differentiation in small populations such as in marine lake environments. Such short-term isolation at small spatial scales may be an important contributing factor to the high marine biodiversity that is found in the Indo-Australian Archipelago.
SubjectsBiodiversity, Evolutionary Studies, Marine Biology
Keywords Phylogeography, East Kalimantan, Anchialine, Geometric morphometrics, Mytillidae, Speciation
INTRODUCTION
history of the area (Renema et al., 2008), its position downstream of the Pacific (Connolly, Bellwood & Hughes, 2003;Kool et al., 2011), the large area of shallow water habitat during the Pleistocene low sea level stands (Voris, 2000;Hoeksema, 2007), great habitat heterogene-ity (Hoeksema, 2007), and large reef area (Bellwood et al., 2005). Generally, the pattern that emerges from phylogeographic studies of marine benthic species in the IAA is that of popu-lation genetic structuring at small spatial scales (e.g.,Timm & Kochzius, 2008;Barber, Erd-mann & Palumbi, 2006;Carpenter et al., 2011;Ludt & Rocha, 2015). These results suggest that dispersal barriers over small spatial scales are important in the structuring of diversity that we see today. However, the nature of dispersal barriers (geographic, environmental, biological) for marine taxa has often remained elusive (e.g.,Peijnenburg & Goetze, 2013). Small peripatric populations such as those in marine lakes provide an opportunity to study marine taxa in isolated environments (Dawson & Hamner, 2005). Marine lakes are anchialine systems: small bodies of landlocked seawater isolated by varying degrees from the surrounding marine environment by means of subterranean channels or fissures in the surrounding rock (Holthuis, 1973;Hamner & Hamner, 1998). A large number (10s–100s) of marine lakes are located in the countries Indonesia and Palau (Dawson et al., 2009; Becking et al., 2011;Becking, De Leeuw & Vogler, 2014). The majority of marine lakes are shallower than 50 m. This means that during the Last Glacial Maximum, when sea levels were approximately 110–140 m lower than modern sea levels (Geyh, Kudrass & Streif, 1979; Voris, 2000), the lakes would have been dry or contained fresh water (Dawson, 2006). Based on the sea level rise, the presumed dates of filling of the lakes with seawater are estimated at 6,000–12,000 years before present (Dawson, 2006;Sathiamurthy & Voris, 2006).
diversification in the largest and least connected marine lake known in Indonesia (Kakaban lake in East Kalimantan). Here we expand on these results by studying the phylogeography of co-distributed and common marine lakes species, the mussels Brachidontes spp.
Species of the genus Brachidontes Swainson, 1840 (Mollusca; Bivalvia; Mytilidae) attach themselves to substrate in and below intertidal areas and can form large mytilid beds (Terranova et al., 2007).Brachidontes spp. are broadcast spawners with external fertilization and only disperse during their planktonic larval stage for a duration of up to four weeks (Reunov, Au & Wu, 1999;Monteiro-Ribas et al., 2006;Terranova et al., 2006). However, it is unknown whetherBrachidonteslarvae are able to survive in the subterranean channels connecting marine lakes to the surrounding sea. There is an undescribed species ofBrachidontesthat inhabits many marine lakes and, when present, is generally dominant in terms of space occupation and biomass in these lakes (Tomascik & Mah, 1994;Colin, 2009;Becking et al., 2011). In contrast, this species has not been reported in coastal habitats (non-marine lake) (Colin, 2009;Goto, Tamate & Hanzawa, 2011). A previous study of Brachidontesfrom marine lakes in Palau found two genetically distinct and morphologically differentiated lineages (A & B) that most likely represent different species (Goto, Tamate & Hanzawa, 2011). Moreover, the spatial genetic structure ofBrachidontesfrom Palau indicated that the majority of the marine lake populations were highly differentiated from each other, each containing private haplotypes (Goto, Tamate & Hanzawa, 2011). A key gap in our understanding of the evolutionary history ofBrachidontespopulations in marine lakes, is the missing sampling from locations in the adjacent sea (e.g., the mangroves) that presumably represent the ancestral populations of those in the lakes.
In order to study the phylogeography and population connectivity of Brachidontes spp. we collected sequence data of two nuclear markers, 18S ribosomal RNA (18S) and 28S ribosomal RNA(28S), and of Cytochrome Oxidase I mitochondrial marker (COI) of mussels from three marine lakes and two mangrove locations in Indonesia. In addition, we examined shell outline shape variation using a geometric morphometric approach to determine morphological differentiation. With these data we address the following questions: 1. Which genetic lineages ofBrachidontesspp. are present in East Kalimantan, Indonesia; 2. Are the marine lakes of East Kalimantan well connected to each other and to the adjacent sea; 3. Based on diversity levels and genetic signatures of mussels in each lake, do we find evidence of a recent population bottleneck followed by expansion?
MATERIAL AND METHODS
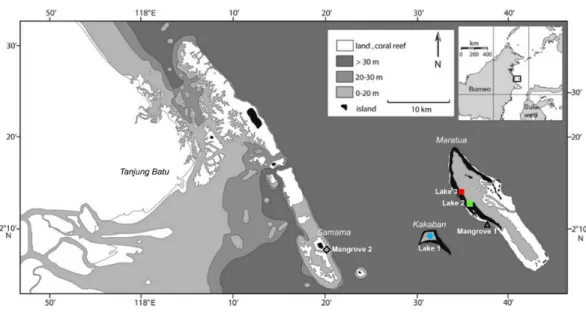
Sample collectionFigure 1 Sample localities of populations ofBrachidontesspp. in the Berau region, East Kalimantan province. Mussels were samples in three marine lakes (Lake 1, Kakaban Lake; Lake 2, Haji Buang lake; Lake 3, Tanah Bamban Lake) and two coastal mangroves (Mangrove 1, Maratua islands; Mangrove 2, Samama island).
previously not been found outside of lakes in the Indo-Pacific (Colin, 2009;Goto, Tamate & Hanzawa, 2011). After extensive searching along the coasts of the islands in Berau, we found small populations of mussels in two coastal mangrove systems with a mixture of mangroves speciesRhizophora mucronataandAvecinnia alba, here referred to as Mangrove 1 (Maratua island) and Mangrove 2 (Samama island) (Fig. 1andTable 1). The mussels from these two areas were burrowed in the sand. All specimens were conserved in 96% laboratory grade EtOH and stored at 4 ◦C. For a full description of the Berau marine lakes,
seeTomascik & Mah (1994)andBecking et al. (2011). The Berau marine lakes have a tidal regime, which is typically delayed (ranging from 20 min to 4 h) and dampened (ranging from 10–80%) compared to the adjacent sea (Becking et al., 2011). Based on the level of tidal dampening and delay, marine lakes can be ranked by their degree of connectivity to the surrounding sea (Hamner & Hamner, 1998), i.e., Lake 1 was the most isolated lake, followed by Lake 2 and Lake 3. Additional COI sequences ofBrachidontesspp. from Palau were obtained from GenBank (accession numbers:AB465561,AB465566,AB465569). Palau is located at approximately 1,900 km north-east from Berau, East Kalimantan. For a full description of the Palauan marine lakes, seeHamner & Hamner (1998)andColin (2009).
DNA extraction, gene amplification and sequencing
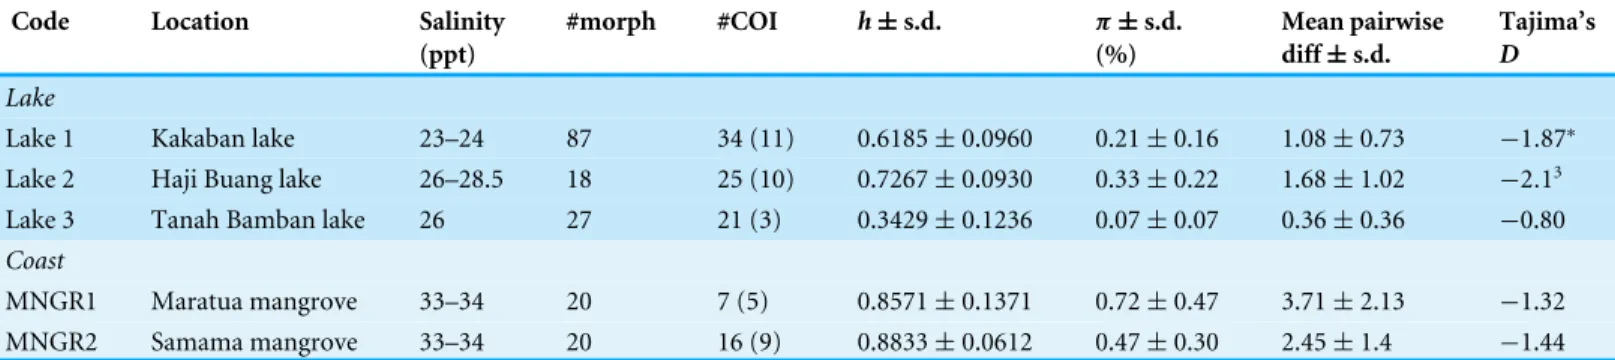
Table 1 Sample localities ofBrachidontesspp. from Berau, East Kalimantan, Indonesia.Per locality is provided: salinity (parts per thousand, ppt), number of individuals analyzed for morphometric analyses (# morph), number of individuals sequenced for Cytochrome Oxidase I (#COI, number of haplotypes in brackets), haplotype diversity (h), percentage nucleotide diversity per population (π), mean pairwise differences, all with± standard deviation (s.d.) obtained with 1,000 bootstrap replicates, and Tajima’s D (p<0.05 indicated by asterisk).
Code Location Salinity
(ppt)
#morph #COI h±s.d. π±s.d.
(%)
Mean pairwise diff±s.d.
Tajima’s D
Lake
Lake 1 Kakaban lake 23–24 87 34 (11) 0.6185±0.0960 0.21±0.16 1.08±0.73 −1.87∗ Lake 2 Haji Buang lake 26–28.5 18 25 (10) 0.7267±0.0930 0.33±0.22 1.68±1.02 −2.13 Lake 3 Tanah Bamban lake 26 27 21 (3) 0.3429±0.1236 0.07±0.07 0.36±0.36 −0.80
Coast
MNGR1 Maratua mangrove 33–34 20 7 (5) 0.8571±0.1371 0.72±0.47 3.71±2.13 −1.32 MNGR2 Samama mangrove 33–34 20 16 (9) 0.8833±0.0612 0.47±0.30 2.45±1.4 −1.44
ofGoto, Tamate & Hanzawa (2011)designed for the female type and the jgLCO/jgHCO primers from Geller et al. (2013)for marine invertebrates. Two individuals per lineage were amplified 28S and 18S, using the primers D23F/D6R (Park & Ò Foighil, 2000) and 22F/1789R (Medlin et al., 1988), respectively. These markers were used only on this subset of individuals to assess the phylogenetic context of the lineages within the Mytillidae and we did not expect to find intra-specific or intra-lineage variation with 28S and 18S (Medlin et al., 1988;Park & Ò Foighil, 2000). PCR reactions for all primer pairs were performed in 25 µL volumes containing 0.8µL 25 mM MgCl2, 3µL dNTP’s (1 mM each), 2.5µL 10×PCR Buffer (SpheroQ), 0.8µL BSA (10 mg/mL), 1µL of both primers (10µM), 0.2µL Taq polymerase (5 units/µL) and 1µL template DNA. The PCR program of the COI primers consisted of an initial denaturation step of 94 ◦C for 3 m followed by 35 PCR cycles of
94 ◦C for 45s, 49 ◦C for 30s and 72 ◦C for 120s, with a final extension step of 72 ◦C for 5
m. The PCR program of the 18S and 28S primers was identical to the previously described except for the annealing step at 47 ◦C for 35s. Quality of PCR products was assessed using
gel electrophoresis on 1% agarose gels. If PCR product quality was insufficient, a new PCR reaction was performed in a 25µL volume containing PCR Beads (Illustra, GE Healthcare) using 21.6µL ddH2O, 0.2µL of both primers (10µM) and 3µL template DNA, and an identical PCR cycling program. PCR products were purified and sequenced by Macrogen Inc. (Korea and The Netherlands).
Doubly uniparental inheritance (DUI)
Subsequently, the analyses in the present paper were done only on the female lineages, which is standard in phylogeographic studies of mussels (e.g.,Goto, Tamate & Hanzawa, 2011;Smietanka et al., 2014).
Genetic data analysis
The bivalve origin of the obtained sequences was verified through BLAST searches (http://blast.ncbi.nlm.nih.gov/Blast.cgi). From the blast results for the 28S and 18S sequences, the most similar sequences were selected and included in the subsequent phylogenetic analysis. Sequences were aligned and handled in CodonCode aligner v4.1.1 (CodonCode Corporation, USA) and DAMBE 5.2.15 (Xia & Xie, 2001;Xia, 2013). The best-fit DNA substitution model was selected by the Akaike Information Criterion deployed in jMODELTEST v. 2.1.6 (Darriba et al., 2012). These models (COI: Hasegawa-Kishino-Yano (Hasegawa, Kishino & Hasegawa-Kishino-Yano, 1985); 18S: Kimura 2-parameter (Kimura, 1980); 28S: Tamura-Nei (Tamura & Nei, 1993); all with a discrete gamma distribution) were used for subsequent maximum likelihood phylogeny inferences implemented in MEGA v6.06 (Tamura et al., 2011) using a heuristic search with 1,000 bootstrap replicates. The resulting phylogenetic trees were visualized in FigTree v1.4.0 (Rambaut, 2009). Separate maximum likelihood analyses were carried out for each marker. Net nucleotide distances between lineages were calculated in MEGA v6.06 using the models obtained with jMODELTEST. Net nucleotide divergence corrects for discrepancies between gene divergence and population divergence due to ancestral polymorphism in populations (Edwards & Beerli, 2000), since it subtracts the average within-group divergence from the observed between-group estimate. Estimates of genetic variation in samples pooled per location were obtained as haplotype diversitiesh (Nei, 1987), nucleotide diversitiesπ (Tajima, 1983;Nei, 1987), and mean
pairwise differences using Arlequin version v.3.5 (Excoffier & Lischer, 2010). In order to create a haplotype network, separate maximum likelihood tree analyses were carried out for each lineage (following the description above), and the resulting phylogenetic trees were used as input for Haploviewer (Salzburger, Ewing & Von Haeseler, 2011).
between expanded and stationary populations (Harpending et al., 1993). Expanding pop-ulations generate smooth and unimodal distributions, while more stationary poppop-ulations the mismatch distribution becomes more ragged and erratic. The value of the raggedness index will be low and non-significant in expanding populations, while it is usually high and significant in stationary populations (Harpending, 1994;Harpending et al., 1993).
Morphometric analysis
Brachidontes spp.mussels were photographed in a standardized orientation for geometric morphometric analyses. In total 172 digital images were stored as Nikon RAW format (.nef) and converted to 3,008×2,000 pixel JPEG images using Photoshop 5.0 (Adobe). JPEG images were sampled into TPS files using the programtpsUTIL (Rohlf, 2010a). Shell outlines were used to capture variation in shell shape of Brachidontesspp. We used a sliding semi-landmark analysis, in which semi-landmarks are allowed to slide along the outline of a shell in order to find the position that optimally matches the positions of corresponding semi-landmarks in a consensus specimen (Bookstein, 1997;Adams, Rohlf & Slice, 2004). Shell outlines were drawn as curves and digitized as 68 semi-landmarks at equal distance using tpsDig (Rohlf, 2010b), using the beak of the mussel (umbo, see Fig. S1) as a standardized starting point for drawing an outline. A ‘‘sliders file’’ indicating sliding semi-landmarks was made usingtpsUtil (Rohlf, 2010a). To standardize for size and orientation we usedtpsRelw(Rohlf, 2010c) with Generalized Procrustes Superimposition (Rohlf, 1999). Residuals from the superimposition were analysed with the thin-plate spline interpolating function, producing principal warps, followed by relative warp (RW) analysis. The programTpsRelwwas used to obtain centroid size (Bookstein, 1991) and RW scores for each individual. RW axes are analogous to the eigenvectors of principal component analysis, which combine the major patterns of shell shape variation in the data. Repeatability of RW axes was tested using regression analysis and a non-parametric analysis of similarity in PAST 2.11 (Hammer, Harper & Ryan, 2001) of RW scores extracted from 17 specimens ofBrachidontesspp., which were independently photographed. RW axes were considered repeatable when they showed a non-significant and close to zeroR-value in the analysis of similarity and a strong (r>0.7) and significant correlation. Only repeatable relative
warp axes were included in further analyses of shell shape variation. Correlations of RW scores with centroid size were tested, and if significantly correlated, we used residuals of the regression in analyses of shell shape. Significant differentiation between populations was tested using a non-parametric analysis of similarity (ANOSIM, 10,000 randomizations) (Clarke, 1993) based on Euclidian distance as implemented in PAST v2.11 (Hammer, Harper & Ryan, 2001).
RESULTS
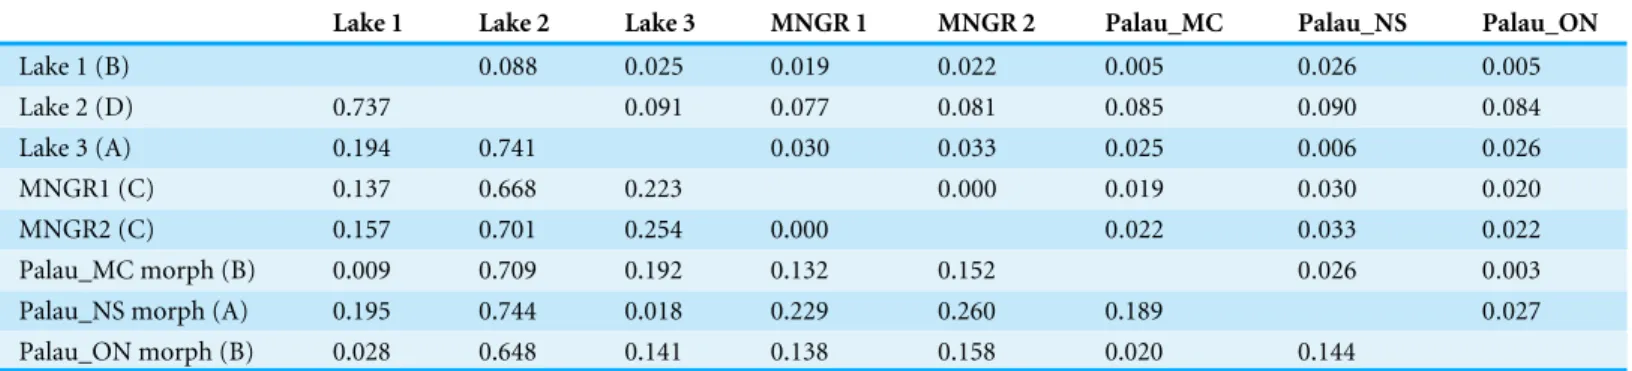
Genetic analysisTable 2 Net nucleotide divergence based on partial Cytochrome Oxidase I sequences ofBrachidontesspp. mussels from marine lakes and man-groves in Indonesia and Palau.Main lineages (A, B, C, D) provided in brackets. Standard deviations are shown above the diagonal. Three morpho-types from Palauan marine lakes were compared: MC- and ONmorphomorpho-types of lineage B, and NS-morphotype from lineage A (seeGotoh et al., 2011 for further details of morphotypes).
Lake 1 Lake 2 Lake 3 MNGR 1 MNGR 2 Palau_MC Palau_NS Palau_ON
Lake 1 (B) 0.088 0.025 0.019 0.022 0.005 0.026 0.005 Lake 2 (D) 0.737 0.091 0.077 0.081 0.085 0.090 0.084 Lake 3 (A) 0.194 0.741 0.030 0.033 0.025 0.006 0.026 MNGR1 (C) 0.137 0.668 0.223 0.000 0.019 0.030 0.020 MNGR2 (C) 0.157 0.701 0.254 0.000 0.022 0.033 0.022 Palau_MC morph (B) 0.009 0.709 0.192 0.132 0.152 0.026 0.003 Palau_NS morph (A) 0.195 0.744 0.018 0.229 0.260 0.189 0.027 Palau_ON morph (B) 0.028 0.648 0.141 0.138 0.158 0.020 0.144
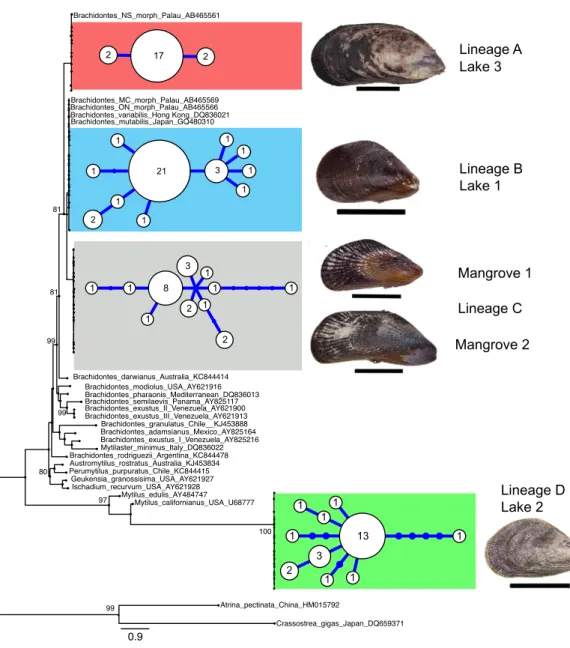
these lineages corresponded with locality (Fig. 2andTable 2). Two of these four divergent lineages correspond to ‘lineage A’ and ‘lineage B’ from the marine lakes in Palau (Goto, Tamate & Hanzawa, 2011) which naming we adopt (Fig. 2). In addition, two new lineages were detected, which we have named C & D. In the present study lineage A was present in Lake 3 (Tanah Bamban Lake), while lineage B was present in lake 1 (Kakaban Lake), lineage C was present in both mangrove localities (Samama and Maratua), and lineage D was present in lake 2 (Haji Buang Lake). A subset of individuals of Lineage A–D were sequenced for a 976 bp long fragment of 28S (aligned length, Genbank accession number KX346215–KX346217) and 18S (1,323 bp,KX346218andKX346219) (Figs. S2andS3) this resulted in identical sequences for Lineage A–C, which fall in the cladeBrachidontess.s. established byTrovant et al. (2015)and are most closely related toBrachidontesspp. from marine lakes in Palau. Though the lineages A & B occur in both Indonesia and Palau, not one haplotype was shared between the different marine lakes populations ofBrachidontes spp. from Indonesia and Palau. The mussels from Lake 3 are 1.8% diverged from Lineage A from Palau, and the mussels from Lake 1 are 0.9–2.8% diverged from Lineage B from Palau (Table 2). Lineage D was the most divergent from the other three lineages: 67–74% corrected divergence in COI (Table 2), 15% in 28S, and 5% with 18S. Blast results of COI, 28S, and 18S of Lineage D did not show high similarity (all less than 90%) with any species in the database. Each lake harbored only one lineage (Fig. 2), while no lineages were shared among lakes in East Kalimantan. In contrast, the two mangrove locations (Mangrove 1 & 2) shared the same lineage (C) and shared haplotypes. The nucleotide diversity, haplotype diversity and mean pairwise difference (Table 1) were lowest in the lakes (π: .1–0.2%;h: 0.3–0.7%;
pairwise difference: 0.4–1.7) and highest in the open populations of the mangroves (π:
0.5–75%;h: 0.9; pairwise difference: 2.5–3.7).
Demographic analysis
0.9 Mytilus_californianus_USA_U68777 Brachidontes_adamsianus_Mexico_AY825164 Perumytilus_purpuratus_Chile_KC844415 Brachidontes_exustus_III_Venezuela_AY621913 Brachidontes_mutabilis_Japan_GQ480310 Brachidontes_modiolus_USA_AY621916 Mytilus_edulis_AY484747 Brachidontes_rodriguezii_Argentina_KC844478 Brachidontes_NS_morph_Palau_AB465561 Mytilaster_minimus_Italy_DQ836022 Brachidontes_granulatus_Chile__KJ453888 Brachidontes_exustus_II_Venezuela_AY621900 Brachidontes_variabilis_Hong Kong_DQ836021 Brachidontes_pharaonis_Mediterranean_DQ836013 Atrina_pectinata_China_HM015792 Ischadium_recurvum_USA_AY621928 Brachidontes_ON_morph_Palau_AB465566 Brachidontes_exustus_I_Venezuela_AY825216 Geukensia_granossisima_USA_AY621927 Brachidontes_darwianus_Australia_KC844414 Brachidontes_semilaevis_Panama_AY825117 Austromytilus_rostratus_Australia_KJ453834 Brachidontes_MC_morph_Palau_AB465569 Crassostrea_gigas_Japan_DQ659371 1 1 1 1 1 8 2 1 1 2 3 2 17 2 1 1 1 1 3 1 2 1 1 1 21 1 1 2 3 1 1 1 1 1 13 Lake 3 Lineage A Lineage B Lake 1 Lineage C Mangrove 1 Lineage D Lake 2 Mangrove 2 99 97 99 81 81 80 99 100
0.0 0.1 0.2 0.3 0.4
0 1 2 3 4 5 6 7 8 9 10
Fr
e
que
nc
y
Pairwise differences
Lake 2 0.0 0.1 0.2 0.3 0.4 0.5
0 1 2 3 4 5 6 7 8 9 10
Fr
e
que
nc
y
Pairwise differences
Mangroves Observed Expected 0.0 0.1 0.2 0.3 0.4 0.5
0 1 2 3 4 5 6 7 8 9 10
Fr
e
que
nc
y
Pairwise differences
Lake 1 0.0 0.1 0.2 0.3 0.4 0.5 0.6 0.7
0 1 2 3 4 5 6 7 8 9 10
Fr
e
que
nc
y
Pairwise differences
Lake 3 SSD = 0.058
p = 0.028
rg = 0.222 p = 0.006
τ = 2.674
SSD = 0.002 p = 0.909
rg = 0.023 p = 0.974
τ = 0.734
SSD = 0.015 p = 0.422
rg = 0.080 p = 0.656
τ = 1.723
SSD = 0.004 p = 0.416
rg = 0.204 p = 0.389
τ = 0.436
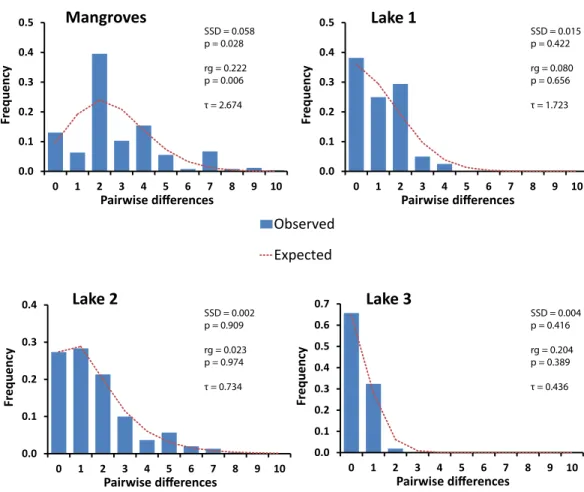
Figure 3 Mismatch distributions of pairwise Cytochrome Oxidase I sequence differences for popula-tions ofBrachidontesspp. in marine lakes and mangrove systems in Berau, Indonesia. Expected
dis-tributions under a model of constant population size and under a sudden population expansion model are indicated as computed in DnaSP (Rozas et al., 2003). Sum of squared deviations (SSD) between the observed data and the theoretical model of demographic expansion are shown on the right, as well as the raggedness index (rg), and tau (τ).
typical of populations that have undergone a recent bottleneck in population size (e.g., during colonization events) followed by rapid population expansion (Slatkin & Hudson, 1991;Rogers & Harpending, 1992).
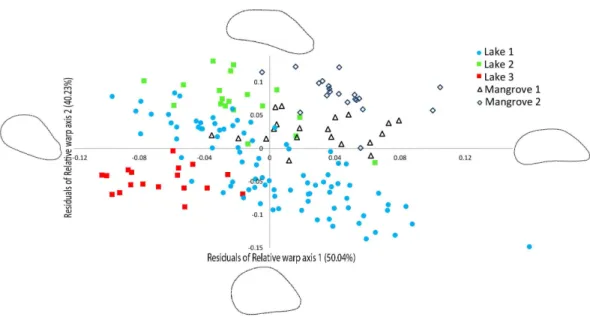
Figure 4 Geometric morphometric analysis ofBrachidontesspp. shell shape.Ordination of shell outline shape variation inBrachidontesspp. mussels from marine lakes and mangroves in Berau, Indonesia (sample locations are detailed inTable 1, shape and color of symbols correspond toFig. 1). Ordination of data in the plane identified by relative warp (RW) axis 1 and 2, together explain 90.27% of the variance. Corresponding thin-plate splines of the most positive and negative deformations along the axes are shown. Data for both axes are residuals of a regression of RW-scores against centroid size.
Excoffier, 1996;Peck & Congdon, 2004). Likewise, a unimodal mismatch distribution can also be the result of a selective sweep. Here we take a comparative approach utilizing the same markers in species with a very similar biology. Hence, we assume that differences in genetic signatures between samples are most likely due to differences in demographic histories, and not selection on the markers.
Morphometric analysis
The relative warp (RW) axes 1–2 were significantly repeatable, explaining 90.27% of the total observed variation in shell outline shape (Fig. 4). The residuals of the RW axes 1 and 2 were used to correct for the correlation with centroid size (RW1: R2=0.4095, p=0.0001, RW2:R2=0.0285,p=0.0296).Figure 4shows a scatter plot of the individuals
along the two first axes of variation in shell outline shape, indicating how 90.27% of total observed variation in shell outline is distributed along these axes. Variation in shell outline was found in the position of the umbo relative to the longitudinal axis of the shell (axis 1) and the shell length to width ratio (axis 2). Overall shell shape variation among populations was highly significant (One-Way Permanova, global F=21.68,p=0.0001)
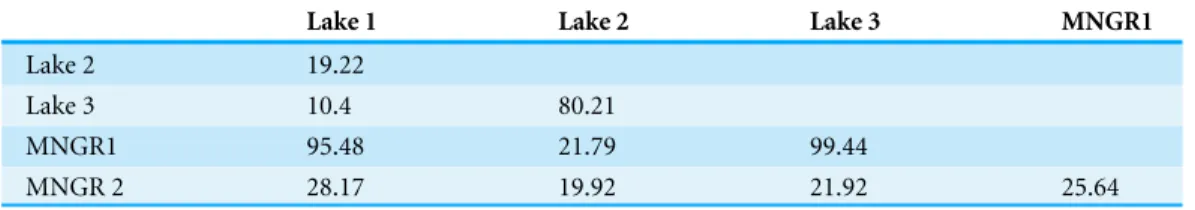
Table 3 Analysis of similarity of shell outline shape forBrachidontesspp. based on relative warp axes 1–2. R-values are shown, all populations are significantly different from each other (p<0.01 using se-quential Bonferroni correctedp-values).
Lake 1 Lake 2 Lake 3 MNGR1
Lake 2 19.22
Lake 3 10.4 80.21
MNGR1 95.48 21.79 99.44
MNGR 2 28.17 19.92 21.92 25.64
DISCUSSION
DivergentBrachidontes lineages in Indonesia and Palau
We detected four mitochondrial female-type lineages based on COI sequences in Brachi-dontesspp. mussels sampled in marine lakes and adjacent mangrove habitats in Indonesia, viz. lineage A, B, C and D (Fig. 2). Two major lineages (A and B) are closely related to the lin-eages A and B, respectively, reported byGoto, Tamate & Hanzawa (2011)forBrachidontes spp. from marine lakes in Palau. Considering the degree of genetic divergence between the four lineages (14–74%), and corresponding morphological differentiation, the lineages probably represent four distinct species. Furthermore, the genetic distances between lineages A–D are comparable to those reported between (cryptic) species of other mussels (Lee & Foighil, 2004;Lee & Foighil, 2005;Terranova et al., 2007;Cunha et al., 2011) Lineage A–C fall within the cladeBrachidontess.s. established byTrovant et al. (2015)and are closely related toBrachidontesspp. from marine lakes in Palau, as well asBrachidontes variabilis, andBrachidontes mutabilis(Fig. 2,Fig. S3). In contrast, Lineage D does not fit within the three proposed clades of Brachidontinae and probably represents a distinct genus.
The patterns of COI genetic differentiation of theBrachidontesspp. lineages were largely congruent with shell outline shape differentiation. There was, however, one exception: the two mangroves are genetically part of the same lineage and share haplotypes, yet morpho-metrically they differ significantly. Morphology can provide a proxy for underlying genetic variation, adaptive evolution, as well as phenotypic plasticity related to environmental regimes (e.g.,Luttikhuizen, Drent & Baker, 2003;Dawson & Hamner, 2005;Mariani, Peij-nenburg & Weetman, 2012;Burridge et al., 2015). It is likely that part of the morphometric variation in shell outline shapes ofBrachidontesspp. mussels are the result of highly distinct environmental conditions at each locality (Table 1). Worldwide 31 species ofBrachidontes have been described, but the phylogenetic positions of the different species within this genus remains unclear with several reports of the occurrence of cryptic species (Lee & Foighil, 2004;Lee & Foighil, 2005;Aguirre, Perez & Sirch, 2006). Further taxonomic review of these Indo-Pacific lineages is clearly needed.
Isolated populations in Indonesian marine lakes
km), yet do not share lineages, while the two mangrove locations 20 km apart do. The overall high level of variation is most pronounced in the mangroves, which is interpreted as evidence of a larger population, more stable demographic history and/or more connected systems than the lake systems.Dawson & Hamner (2005)found that the genetic distance between marine lake and lagoon populations of the jellyfishMastigias papua in Palau was highly correlated with the degree of physical isolation of the lake to the adjacent sea, and not the actual geographic proximity of populations to each other. Isolation of marine lake populations may be the result of strong physical isolating barriers as well as different selective environmental regimes in the lakes. The subterranean channels that connect each lake with the surrounding sea may provide a formidable dispersal barrier for propagules. Alternatively, a propagule may be able to enter but may not be able to survive due to the environmental regime within the lake or competition with resident founder lineages/species. The pattern that is almost consistently seen in a variety of taxa (jellyfish, fish, and bivalves) is that each lake harbors a single lineage per taxon (Dawson, 2005;Dawson & Hamner, 2005;Gotoh et al., 2009;Goto, Tamate & Hanzawa, 2011). An explanation for this pattern may be fierce inter-lineage competition, as would be expected for closely related species that occupy similar niches. This is further supported by the observation that lakes either contain mussels or oysters as the dominant bivalves, rarely both (Becking et al., 2011). It could be that priority effects (Alford & Wilbur, 1985;Wilbur & Alford, 1985) provide competitive advantage to whichever lineage colonizes a marine lake first The dominance of a lineage would be largely stochastic, likely dictated by the chance arrival of propagules (Gillespie & Baldwin, 2009): whichever mussel lineage arrives first is the one that fills that niche space. Paleoecological records (e.g., sediment cores with bivalve shells) could potentially verify which morphotypes have been dominant historically.
isolation in peripatric environments, such as islands or satellite lakes of ancient rift lakes in Africa (e.g.,Genner et al., 2007;Emerson & Gillespie, 2008;Chen & He, 2009;Rosindell & Phillimore, 2011). The role of marine lakes in supporting endemism in the IAA region may be through enhanced survival of endemics (relicts from earlier anchialine systems), with the possibility of local population divergence that may lead to speciation.
The islands of Samama, Kakaban, Maratua are part of the Berau Marine Protected Area that was formed in 2005 and Kakaban island with the large marine lake (Lake 1) is planned to be proposed for a UNESCO World Heritage Site (Gunawan & Visser, 2012;Vermaat, Estradivari & Becking, 2012). The implication of our results for marine conservation is that each lake is barely connected by effective dispersal and must be viewed as unique and isolated entities.
ACKNOWLEDGEMENTS
We would like to thank R Moolenbeek and F Wesselingh for identification of the samples and F Wesselingh for a brief description of morphological characters, Alice Burridge for suggestions about geometric morphometric analyses, and J. van Arkel for aiding the photography. The following people provided help with logistics for field- and/or labwork: RCO-LIPI, RISTEK, B Hoeksema, AS Sidik, Suharsono, Y Tuti, Bahruddin, S Menken, H Breeuwer, L Dong, B Voetdijk, P Kuperus, F Dekker, the staff of Nabucco Island Dive Resort, and of Derawan Dive Resort. R Castilho, E Gittenberger, W. Renema, and three anonymous provided valuable comments on the original manuscript.
ADDITIONAL INFORMATION AND DECLARATIONS
Funding
The Netherlands Organisation for Scientific Research provided funding to Leontine E. Becking through the grants ALW-Openprogramma #817.01.008, RUBICON #825.12.007, and VENI # 863.14.020, and to Katja T.C.A. Peijnenburg through the grant VENI # 863.08.024. Fieldwork in Indonesia was made possible through additional financial support of the Schure-Beijerinck-Popping Fund of the Royal Dutch Academy of Science (KNAW), the Treub-Maatschappij Fund, the Leiden University Fund (LUF)/Slingelands, Singapore Airlines, the AM Buitendijk Fund and the JJ ter Pelkwijk Fund (Naturalis Biodiversity Center). The funders had no role in study design, data collection and analysis, decision to publish, or preparation of the manuscript.
Grant Disclosures
The following grant information was disclosed by the authors:
Netherlands Organisation for Scientific Research: ALW-Openprogramma #817.01.008, RUBICON #825.12.007, VENI # 863.14.020, VENI #863.08.024.
Royal Dutch Academy of Science (KNAW). Treub-Maatschappij Fund.
Singapore Airlines. AM Buitendijk Fund.
JJ ter Pelkwijk Fund (Naturalis Biodiversity Center).
Competing Interests
Katja TCA Peijnenburg is an Academic Editor for PeerJ.
Author Contributions
• Leontine E. Becking conceived and designed the experiments, performed the experiments, analyzed the data, contributed reagents/materials/analysis tools, wrote the paper, prepared figures and/or tables, reviewed drafts of the paper.
• Christiaan A. de Leeuw and Diede L. Maas performed the experiments, analyzed the data, wrote the paper, prepared figures and/or tables, reviewed drafts of the paper. • Bram Knegt performed the experiments, analyzed the data, wrote the paper, reviewed
drafts of the paper.
• Nicole J. de Voogd contributed reagents/materials/analysis tools, wrote the paper, reviewed drafts of the paper.
• Abdunnur Abdunnur and Iwan Suyatna conceived and designed the experiments, contributed reagents/materials/analysis tools, wrote the paper, prepared figures and/or tables, reviewed drafts of the paper, permit application and material transfer.
• Katja T.C.A. Peijnenburg conceived and designed the experiments, analyzed the data, contributed reagents/materials/analysis tools, wrote the paper, reviewed drafts of the paper.
Field Study Permissions
The following information was supplied relating to field study approvals (i.e., approving body and any reference numbers):
The Indonesian Institute of Sciences (LIPI) and the Indonesian State Ministry of Research and Technology (RISTEK) provided research permits to LEB (permit numbers: 3246/FRP/SM/VII/2012, and 0094/FRP/SM/V/2009).
DNA Deposition
The following information was supplied regarding the deposition of DNA sequences: GenBank:KX688100,KX688101,KX346179–KX346219.
Supplemental Information
Supplemental information for this article can be found online athttp://dx.doi.org/10.7717/ peerj.2496#supplemental-information.
REFERENCES
Adams DC, Rohlf FJ, Slice DE. 2004.Geometric morphometrics: ten years of progress following the revolution.Italian Journal of Zoology71:5–16
Aguirre ML, Perez SI, Sirch YN. 2006.Morphological variability of Brachidontes Swainson (Bivalvia, Mytilidae) in the marine Quaternary of Argentina (SW Atlantic).Palaeogeography, Palaeoclimatology, Palaeoecology239:100–125 DOI 10.1016/j.palaeo.2006.01.019.
Alford RA, Wilbur HM. 1985.Priority effects in experimental pond communities: competition betweenBufoandRana.Ecology 66:1097–1105DOI 10.2307/1939161.
Aris-Brosou S, Excoffier L. 1996.The impact of population expansion and mutation rate heterogeneity on DNA sequence polymorphism.Molecular Biology and Evolution
13:494–504DOI 10.1093/oxfordjournals.molbev.a025610.
Azzini F, Calcinai B, Cerrano C, Bavestrello G, Pansini M. 2007. Sponges of the marine karst lakes and of the coast of the islands of Ha Long Bay (North Vietnam). In: Custodia MR, Lobo-Hajdu G, Hajdu E, Muricy G, eds.Porifera research: biodiversity, innovation and sustainability. Rio de Janeiro: Museu Nacional, Universidade Federal do Rio de Janeiro, 157–164.
Barber PH, Erdmann MV, Palumbi SR. 2006.Comparative phylogeography of three codistributed stomatopods: origins and timing of regional lineage diversification in the coral triangle.Evolution60:1825–1839DOI 10.1111/j.0014-3820.2006.tb00526.x.
Becking LE, Cleary DFR, De Voogd NJ. 2013.Sponge species composition, abundance, and cover in marine lakes and coastal mangroves in Berau, Indonesia.Marine Ecology Progress Series481:105–120DOI 10.3354/meps10155.
Becking LE, De Leeuw C, Vogler C. 2014.Newly discovered ‘‘jellyfish lakes’’ in Misool, Raja Ampat, Papua, Indonesia.Marine Biodiversity 45:597–598.
Becking LE, Erpenbeck D, Peijnenburg KTCA, De Voogd NJ. 2013.Phylogeography of the sponge Suberites diversicolor in Indonesia: insights into the evolution of marine lake populations.PLoS ONE8:e75996DOI 10.1371/journal.pone.0075996.
Becking LE, Renema W, Santodomingo NK, Hoeksema BW, Tuti Y, De Voogd NJ. 2011.Recently discovered landlocked basins in Indonesia reveal high habitat diversity in anchialine systems.Hydrobiologia677:89–105
DOI 10.1007/s10750-011-0742-0.
Bellwood DR, Hughes TP, Connolly SR, Tanner JK. 2005.Environmental and geometric constraints on Indo-Pacific coral reef biodiversity.Ecology Letters8:643–651
DOI 10.1111/j.1461-0248.2005.00763.x.
Bellwood DR, Meyer CP. 2009.Endemism and evolution in the coral triangle: a call for clarity.Journal of Biogeography36:2010–2012
DOI 10.1111/j.1365-2699.2009.02167.x.
Bookstein FL. 1991.Morphometric tools for landmark data: geometry and biology. Cambridge: Cambridge University Press, 1–443.
Bookstein FL. 1997.Landmark methods for forms without landmarks: morphometrics of group differences in outline shape.Medical Image Analysis1:225–243
DOI 10.1016/S1361-8415(97)85012-8.
Briggs JC. 2000.Centrifugal speciation and centres of origin.Journal of Biogeography
Burridge AK, Goetze E, Raes N, Huisman J, Peijnenburg KT. 2015.Global biogeography and evolution of Cuvierina pteropods.BMC Evolutionary Biology15:39
DOI 10.1186/s12862-015-0310-8.
Carpenter KE, Barber PH, Crandall ED, Carmen M, Ablan-Lagman A, Ambariyanto, Mahardika GN, Manjaji-Matsumoto MB, Juinio-Menez MA, Santos MD, Starger CJ, Toha AH. 2011.Comparative phylogeography of the coral triangle and implica-tions for marine management.Journal of Marine Biology2011:1–14
DOI 10.1155/2011/396982.
Chen X-Y, He F. 2009.Speciation and endemism under the model of island biogeogra-phy.Ecology90:39–45DOI 10.1890/08-1520.1.
Clarke KR. 1993.Non-parametric multivariate analyses of changes in community struc-ture.Australian Journal of Ecology18:117–143
DOI 10.1111/j.1442-9993.1993.tb00438.x.
Colin PL. 2009.Marine environments of Palau. San Diego: Indo-Pacific Press.
Connolly SR, Bellwood DR, Hughes TP. 2003.Indo-Pacific biodiversity of coral reefs: deviations from a mid-domain model.Ecology84:2178–2190DOI 10.1890/02-0254.
Cunha RL, Lopes EP, Reis DM, Castilho R. 2011.Genetic structure of Brachidontes puniceus populations in Cape Verde archipelago shows signature of expan-sion during the last glacial maximum.Journal of Molluscan Studies77:175–181 DOI 10.1093/mollus/eyr001.
Darriba D, Taboada GL, Doallo R, Posada D. 2012.jModelTest 2: more models, new heuristics and parallel computing.Nature Methods9:772–772
DOI 10.1038/nmeth.2109.
Dawson MN. 2005.Five new subspecies ofMastigias(Scyphozoa: Rhizostomeae: Mastigiidae) from marine lakes, Palau, Micronesia.Journal of Marine Biological Association UK 85:679–694DOI 10.1017/S0025315405011604.
Dawson MN. 2006.Island evolution in marine lakes.JMBA Global Marine Environment
3:26–29.
Dawson MN, Hamner WM. 2005.Rapid evolutionary radiation of marine zooplankton in peripheral environments.Proceedings of the National Academy of Sciences of the United States of America102:9235–9240DOI 10.1073/pnas.0503635102.
Dawson MN, Martin LE, Bel LJ, Patris S. 2009. Marine lakes. In: Gillespie R, Clague DA, eds.Encyclopedia of Islands. Berkeley: University of California Press, 603–607.
Edwards SV, Beerli P. 2000.Perspective: gene divergence, population divergence, and the variance in coalescence time in phylogeographic studies.Evolution54:1839–1854.
Emerson BC, Gillespie RG. 2008.Phylogenetic analysis of community assembly and structure over space and time.Trends in Ecology and Evolution23:619–630 DOI 10.1016/j.tree.2008.07.005.
Geller J, Meyer C, Parker M, Hawk H. 2013.Redesign of PCR primers for mito-chondrial cytochrome c oxidase subunit I for marine invertebrates and ap-plication in all-taxa biotic surveys.Molecular Ecology Resources13:851–861 DOI 10.1111/1755-0998.12138.
Genner MJ, Nichols P, Carvalho GR, Robinson RL, Shaw PW, Smith A, Turner GF. 2007.Evolution of a cichlid fish in a Lake Malawi satellite lake.Proceedings of the Royal Society of London B274:2249–2257DOI 10.1098/rspb.2007.0619.
Geyh MA, Kudrass HR, Streif H. 1979.Sea level changes during the late Pleistocene and Holocene in the strait of Malacca.Nature278:441–443DOI 10.1038/278441a0.
Gillespie RG, Baldwin BG. 2009. Island biogeography of remote archipelagoe; interplay between ecological and evolutionary processes. In: Losos JB, Ricklefs RE, eds.The theory of island biogeography revisited. Princeton University Press, 358–388.
Goto TV, Tamate HB, Hanzawa N. 2011.Phylogenetic characterization of three morphs of mussels (Bivalvia, Mytilidae) inhabiting isolated marine environments in Palau Islands.Zoological Science28:568–579DOI 10.2108/zsj.28.568.
Gotoh RO, Chiba SN, Goto TV, Tamate HB, Hanzawa N. 2011.Population genetic structure of the striped silverside,Atherinomorus endrachtensis(Atherinidae, Atheriniformes, Teleostei), inhabiting marine lakes and adjacent lagoons in Palau: marine lakes are ‘‘Islands’’ for marine species.Genes and Genetic Systems86:325–337 DOI 10.1266/ggs.86.325.
Gotoh RO, Sekimoto H, Chiba SN, Hanzawa N. 2009.Peripatric differentiation among adjacent marine lake and lagoon populations of a coastal fish,Sphaeramia orbicularis (Apogonidae, Perciformes, Teleostei).Genes and Genetic Systems84:287–295
DOI 10.1266/ggs.84.287.
Gunawan B, Visser L. 2012.Permeable boundaries: outsiders and access to fishing grounds in the Berau marine protected area.Anthropological Forum22:187–207.
Hammer Ø, Harper DAT, Ryan PD. 2001.PAST: Palaeontological statistics software package for education and data analysis.Palaeontologia Electronica4:1–9.
Hamner W, Hamner P. 1998.Stratified Marine Lakes of Palau (Western Caroline Islands).Physical Geography19:175–220.
Harpending HC. 1994.Signature of ancient population growth in a low-resolution mitochondrial DNA mismatch distribution.Human Biology 66:591–600.
Harpending HC, Sherry ST, Rogers AR, Stoneking M. 1993.The genetic structure of ancient human populations.Current Anthropology34:483–496DOI 10.1086/204195.
Hasegawa M, Kishino H, Yano TA. 1985.Dating of the human-ape splitting by a molecular clock of mitochondrial DNA.Journal of Molecular Evolution22:160–174 DOI 10.1007/BF02101694.
Ho SYW, Lanfear R, Bromham L, Phillips MJ, Soubrier J, Rodrigo AG, Cooper A. 2011.
Time-dependent rates of molecular evolution.Molecular Ecology20:3087–3101 DOI 10.1111/j.1365-294X.2011.05178.x.
Hoeksema BW, Tuti Y, Becking LE. 2014.Mixed medusivory by the sea anemone Entacmaea medusivora(Anthozoa: Actiniaria) in Kakaban Lake, Indonesia.Marine Biodiversity45:141–142DOI 10.1007/s12526-014-0233-4.
Holland PWH. 1993. Cloning genes using pcr. In: Stern CD, Holland PWH, eds. Developmental biology: a practical approach. Oxford: Oxford University Press.
Holthuis L. 1973.Caridean Shrimps Found in Land-locked Saltwater Pools at Four Indo-West Pacific Localities (Sinai Peninsula, Funafuti Atoll, Maui and Hawaii Islands), with the description of one new genus and four new species.Zoologische Verhandelingen128:3–48.
Kenchington E, Macdonald B, Cao LQ, Tsagkarakis D, Zouros E. 2002.Genetics of mother-dependent sex ratio in blue mussels (Mytilusspp.) and implications for doubly uniparental inheritance of mitochondrial DNA.Genetics161:1579–1588.
Kimura M. 1980.A simple method for estimating evolutionary rates of base substitutions through comparative studies of nucleotide sequences.Journal of Molecular Evolution
16:111–120DOI 10.1007/BF01731581.
Kool JT, Paris CB, Barber PH, Cowen RK. 2011.Connectivity and the development of population genetic structure in Indo-West Pacific coral reef communities.Global Ecology and Biogeography20:695–706DOI 10.1111/j.1466-8238.2010.00637.x.
Lee T, Foighil DÓ. 2004.Hidden Floridian biodiversity: mitochondrial and nuclear gene trees reveal four cryptic species within the scorched mussel, Brachidontes exustus, species complex.Molecular Ecology13:3527–3542
DOI 10.1111/j.1365-294X.2004.02337.x.
Lee T, Foighil DOÓ. 2005.Placing the Floridian marine genetic disjunction into a regional evolutionary context using the scorched mussel, Brachidontes exustus, species complex.Evolution59:2139–2158DOI 10.1111/j.0014-3820.2005.tb00924.x.
Ludt WB, Rocha LA. 2015.Shifting seas: the impacts of Pleistocene sea-level fluctua-tions on the evolution of tropical marine taxa.Journal of Biogeography42:25–38 DOI 10.1111/jbi.12416.
Luttikhuizen PC, Drent J, Baker AJ. 2003.Disjunct distribution of highly diverged mitochondrial lineage clade and population subdivision in a marine bivalve with pelagic larval dispersal.Molecular Ecology 12:2215–2229
DOI 10.1046/j.1365-294X.2003.01872.x.
Mariani S, Peijnenburg KTCA, Weetman D. 2012.Independence of neutral and
adaptive divergence in a low dispersal marine mollusc.Marine Ecology Progress Series
446:173–187DOI 10.3354/meps09507.
Medlin L, Elwood HJ, Stickel S, Sogin ML. 1988.The characterization of enzymat-ically amplified eukaryotic 16S-like rRNA-coding regions.Gene71:491–499 DOI 10.1016/0378-1119(88)90066-2.
Monteiro-Ribas W, Rocha-Miranda F, Romano RC, Quintanilha J. 2006.Larval devel-opment of Brachidontes solisianus (Bivalvia, Mytilidae), with notes on differences between its hinge system and that of the mollusk Perna perna.Brazilian Journal of Biology66:109–116DOI 10.1590/S1519-69842006000100014.
Park J-K, Ò Foighil D. 2000.Sphaeriid and corbiculid clams represent separate het-erodont bivalve radiations into freshwater environments.Molecular Phylogenetics and Evolution14:75–88DOI 10.1006/mpev.1999.0691.
Peck DR, Congdon BC. 2004.Reconciling historical processes and population structure in the sooty ternSterna fuscata.Journal of Avian Biology35:327–335 DOI 10.1111/j.0908-8857.2004.03303.x.
Peijnenburg KTCA, Goetze E. 2013.High evolutionary potential of marine zooplankton. Ecology and Evolution3:2765–2783DOI 10.1002/ece3.644.
Rambaut A. 2009.FigTree, a graphical viewer of phylogenetic trees. Edinburgh: Institute of Evolutionary Biology, University of Edinburgh.Available athttp:// tree.bio.ed.ac.uk/ software/ figtree/ (accessed on June 2015).
Renema W, Bellwood DR, Braga JC, Bromfield K, Hall R, Johnson KG, Lunt P, Meyer CP, McMonagle LB, Morley RJ, O’Dea A, Todd JA, Wesselingh FP, Wilson MEJ, Pandolfi JM. 2008.Hopping hotspots: global shifts in marine biodiversity.Science
321:654–657DOI 10.1126/science.1155674.
Reunov AA, Au DWT, Wu RSS. 1999.Spermatogenesis of the green-lipped musselPerna viridiswith dual patterns of acrosome and tail development in spermatids.Helgoland Marine Research53:62–69DOI 10.1007/PL00012139.
Roberts CM, McClean CJ, Veron JEN, Hawkins JP, Allen GR, McAllister DE, Mit-termeier CG, Schueler FW, Spalding M, Wells F, Vynne C, Werner TB. 2002.
Marine biodiversity hotspots and conservation priorities for tropical reefs.Science
295:1280–1284DOI 10.1126/science.1067728.
Rogers AR, Harpending H. 1992.Population growth makes waves in the distribution of pairwise genetic differences.Molecular Biology and Evolution9:552–569.
Rohlf FJ. 1999.Shape statistics: procrustes superimpositions and tangent spaces.Journal of Classification16:197–223 DOI 10.1007/s003579900054.
Rohlf FJ. 2010a.Tpsutil, file utility program. Version 1.46. Stony Brook: Department of Ecology and Evolution, State University of New York at Stony Brook.
Rohlf FJ. 2010b.Tpsdig, digitize landmarks and outlines. Version 2.12. Stony Brook: Department of Ecology and Evolution, State University of New York at Stony Brook.
Rohlf FJ. 2010c.Tpsrelw, relative warps analysis. Version 1.41. Stony Brook: Department of Ecology and Evolution, State University of New York at Stony Brook.
Rosindell J, Phillimore AB. 2011.A unified model of island biogeography sheds light on the zone of radiation.Ecology Letters14:552–560
DOI 10.1111/j.1461-0248.2011.01617.x.
Rozas J, Sánchez-Delbarrio JC, Messeguer X, Rozas R. 2003.DnaSP, DNA polymor-phism analyses by the coalescent and other methods.Bioinformatics19:2496–2497 DOI 10.1093/bioinformatics/btg359.
Saavedra C, Reyero MI, Zouros E. 1997.Male-dependent doubly uniparental inheritance of mitochondrial DNA and female-dependent sex-ratio in the musselMytilus
Salzburger W, Ewing GB, Von Haeseler A. 2011.The performance of phylogenetic algorithms in estimating haplotype genealogies with migration.Molecular Ecology
20:1952–1963DOI 10.1111/j.1365-294X.2011.05066.x.
Sathiamurthy E, Voris HK. 2006.Maps of Holocene sea level transgression and submerged lakes on the Sunda shelf.The Natural History Journal of Chulalongkorn University Supplement 2:1–44.
Slatkin M, Hudson RR. 1991.Pairwise comparisons of mitochondrial DNA sequences in stable and exponentially growing populations.Genetics129:555–562.
Smietanka B, Burzyñski A, Hummel H, Wenne R. 2014.Glacial history of the European marine mussels Mytilus, inferred from distribution of mitochondrial DNA lineages. Heredity113:250–258 DOI 10.1038/hdy.2014.23.
Tajima F. 1983.Evolutionary relationship of DNA sequences in finite populations. Genetics105:437–460.
Tajima F. 1989a.Statistical method for testing the neutral mutation hypothesis by DNA polymorphism.Genetics123:585–595.
Tajima F. 1989b.DNA polymorphism in a subdivided population: the expected number of 638 segregating sites in the two-subpopulation model.Genetics123:229–240.
Tamura K, Nei M. 1993.Estimation of the number of nucleotide substitutions in the control region of mitochondrial DNA in humans and chimpanzees.Molecular Biology and Evolution10:512–526.
Tamura K, Peterson D, Peterson N, Stecher G, Nei M, Kumar S. 2011.MEGA5: molecular evolutionary genetics analysis using maximum likelihood, evolutionary distance, and maximum parsimony methods.Molecular Biology and Evolution
28:2731–2739DOI 10.1093/molbev/msr121.
Terranova MS, Lo Brutto S, Arculeo M, Mitton JB. 2006.Population structure of Brachidontes pharaonis(P. Fisher, 1870) (Bivalvia, Mytilidae) in the Mediterranean Sea, and evolution of a novel mtDNA polymorphism.Marine Biology 150:89–101 DOI 10.1007/s00227-006-0330-4.
Terranova MS, Lo Brutto S, Arculeo M, Mitton JB. 2007.A mitochondrial phylo-geography of Brachidontes variabilis (Bivalvia: Mytilidae) reveals three cryptic species.Journal of Zoological Systematics and Evolutionary Research45:289–298 DOI 10.1111/j.1439-0469.2007.00421.x.
Timm J, Kochzius M. 2008.Geological history and oceanography of the Indo-Malay Archipelago shape the genetic population structure in the false clown anemonefish (Amphiprion ocellaris).Molecular Ecology 17:3999–4014
DOI 10.1111/j.1365-294X.2008.03881.x.
Tomascik T, Mah AJ. 1994.The ecology of ‘Halimedalagoon’’: an anchialine lagoon of a raised atoll, Kakaban island, East Kalimantan, Indonesia.Tropical Biodiversity
2:385–399.
footprints of Quaternary glaciations.Molecular Phylogenetics and Evolution82:60–74 DOI 10.1016/j.ympev.2014.10.002.
Vermaat JE, Estradivari E, Becking LE. 2012.Present and future environmental impacts on the coastal zone of Berau (East Kalimantan, Indonesia), a deductive scenario anal-ysis.Regional Environmental Change12:437–444DOI 10.1007/s10113-011-0257-2.
Voris HK. 2000.Maps of Pleistocene sea levels in Southeast Asia: shorelines, river systems and time durations.Journal of Biogeography27:1153–1167 DOI 10.1046/j.1365-2699.2000.00489.x.
Wilbur HM, Alford RA. 1985.Priority effects in experimental pond communities: responses of Hyla to Bufo and Rana.Ecology 66:1106–1114DOI 10.2307/1939162.
Xia X. 2013.DAMBE5: a comprehensive software package for data analysis in molec-ular biology and evolution.Molecular Biology and Evolution30:1720–1728 DOI 10.1093/molbev/mst064.
Xia X, Xie Z. 2001.DAMBE: software package for data analysis in molecular biology and evolution.Journal of Heredity92:371–373 DOI 10.1093/jhered/92.4.371.