Just good enough data: Figuring
data citizenships through air
pollution sensing and data stories
Jennifer Gabrys
1, Helen Pritchard
1and Benjamin Barratt
2Abstract
Citizen sensing, or the use of low-cost and accessible digital technologies to monitor environments, has contributed to new types of environmental data and data practices. Through a discussion of participatory research into air pollution sensing with residents of northeastern Pennsylvania concerned about the effects of hydraulic fracturing, we examine how new technologies for generating environmental data also give rise to new problems for analysing and making sense of citizen-gathered data. After first outlining the citizen data practices we collaboratively developed with residents for monitoring air quality, we then describe the data stories that we created along with citizens as a method and technique for composing data. We further mobilise the concept of ‘just good enough data’ to discuss the ways in which citizen data gives rise to alternative ways of creating, valuing and interpreting datasets. We specifically consider howenvironmental data raises different concerns and possibilities in relation to Big Data, which can be distinct from security or social media studies. We then suggest ways in which citizen datasets could generate different practices and interpretive insights that go beyond the usual uses of environmental data for regulation, compliance and modelling to generate expanded data citizenships.
Keywords
Citizen sensing, citizen data, environmental data, data practices, data stories, data citizenships
From Fitbit to the Air Quality Egg, there are an increasing number of devices and practices now avail-able for generating data. Whether monitoring a pulse or capturing the daily patterns of air pollution, users are able to measure, track and analyse environments and health. Yet despite the proliferation of these tech-nologies, the practices and objectives for collecting data are diverse and are oriented toward different monitor-ing objectives. In this paper, we consider how the rise of citizen sensing, or the use of low-cost and accessible digital technologies to monitor environments, has con-tributed to new types of environmental data and data practices. Through a discussion of participatory research into air pollution sensing with residents of northeastern Pennsylvania concerned about the effects of hydraulic fracturing, we examine how new technol-ogies for generating environmental data give rise to new problems for analysing and making sense of citizen data.
We use the term ‘citizen data’ here to refer to data that citizens generate and gather typically outside the domain of scientific research, using a broad range of monitoring technologies and techniques. We also employ ‘citizen data’ to refer to the challenging claims that citizens can make with data, which is a key distinc-tion when addressing types of citizen science that are not only referring to amateur accounts, but which are deliberately invoking the political possibilities of this data (cf. Irwin, 1995). In the course of collecting data, multiple questions inevitably emerge about the validity
1Department of Sociology Goldsmiths, University of London, London, UK
2Environmental Research Group, King’s College London, London, UK
Corresponding author:
Jennifer Gabrys, Citizen Sense, Department of Sociology Goldsmiths, University of London New Cross, London SE14 6NW, UK.
Email: [email protected]
Big Data & Society July–December 2016: 1–14
!The Author(s) 2016 DOI: 10.1177/2053951716679677 bds.sagepub.com
of citizen data. Regulators, scientists and polluters for different reasons at times attempt to discredit citizen data, due to concerns about the monitoring instruments used, the data protocols followed, and the supposed introduction of ‘bias’ that is seen to skew monitoring results (cf. Nature, 2015). However, questions about validity do not pertain to citizen data alone, since numerous datasets could be dismissed for similar rea-sons (cf. Wallis et al., 2007). At the same time, citizen data is now contributing to the multiple data streams that can give rise to Big Data and its emerging analytic techniques.
We mobilise the term ‘just good enough data’ to discuss the ways in which citizen data gives rise to alter-native ways of creating, valuing and interpreting data-sets (Gabrys and Pritchard, 2015). Just good enough data refers to the ways in which data generated through low-tech and low-cost instruments, as well as data that might be observational or experiential (including ‘eyes on the ground’ data), can be mobilised to create differ-ent accounts and differdiffer-ent forms of evidence for enga-ging with environmental problems. Citizen data might fall outside of the usual practices of legitimation and validation that characterise scientific data (which also has its own processes for determining if data is good enough). However, it could be just good enough to ini-tiate conversations with environmental regulators, to make claims about polluting processes, or to argue for more resources to be invested in regulatory-stan-dard monitoring infrastructure. Such just good enough citizen data could also contribute to different data practices and data stories to generate more open and democratic engagements with environmental data and environmental problems (cf. Corburn, 2005; Gabrys, 2016a). It is these practices that we see as con-stitutive of data citizenships, not as a designation of membership (such as to a nation state), but rather as data-related engagements that activate political subjects and collectives in relation to environmental problems (cf. Gabrys, 2016b). Rather than attempt to establish a definition of citizenship, we instead look at how par-ticular modes of democratic engagement with environ-mental problems are facilitated, organised and expressed through the generation and analysis of envir-onmental sensor data. This is a way to tune into the political subjects and relations that emerge through processes of monitoring environments, and to consider how democratic data practices are created and articulated.
By operationalizing the concept of just good enough data through citizen data practices in northeastern Pennsylvania, we then ask: What different practices and capacities emerge through citizen-generated data that create different ways for making accounts of envir-onmental problems and generating evidence? How do
understandings of and approaches to Big Data trans-form in relation toenvironmental citizen data, particu-larly when one of the primary concerns about Big Data within social media and security studies is that it exploits dataaboutusers? And how could citizen data-sets generate interpretive insights that tell different data stories that go beyond the usual uses of environmental data for regulation, compliance and modelling to gen-erate expanded data citizenships?
We take up these questions in relation to the citizen data that developed through a seven-month citizen monitoring study on air pollution. We look more clo-sely at the citizen data and data practices along with the modes of data interpretation that developed. In order to make sense of the citizen-gathered data, we worked with residents undertaking monitoring, as well as devel-oped a collaboration with an atmospheric scientist co-authoring this paper who contributed to the analysis of the citizen-gathered air pollution data. As part of this collaboration and in order to generate and develop interpretive methods for working with citizen data, we further developed ‘Airsift’, a data analysis toolkit that uses and adapts ‘openair’ open-source software for interpreting and visualising air quality data (Carslaw, 2014; Carslaw and Ropkins, 2012). Together with par-ticipants, we then created data stories to establish a method and technique for composing the multiple modes of citizen data.
We consider how the data stories, which include data visualisations and analysis produced from our ‘Airsift’ data toolkit, provide different ways of parsing and operationalizing citizen data. We also discuss processes for drawing out patterns about possible air pollution sources from the citizen data. We approach these pat-terns as storying processes that contribute to collective modes of making sense of and developing responses to environmental data, and for inventing alternative ways of generating, valuing and interpreting datasets. These data stories drew on multiple forms of data and were written through the input of multiple actors and enti-ties, including researchers and residents, policymakers and regulators, as well as sensors and algorithms. As a method and technique, the data stories seek to situate environmental sensor data in its lived material condi-tions. The data stories present a way to account more fully for the stories we already tell with data, across the range citizen or scientist engagements, while also enga-ging with storying as an inventive practice.
From democratization of sensing
to democratization of data
low-cost and low-tech devices. We use the term ‘citizen sensing’ here as a way to distinguish these monitoring practices in relation to a long-standing set of citizen science practices. In its original use, citizen sensing referred to volunteered geographic information (Goodchild, 2007). However, it has now come to describe the wider set of participatory, DIY and digital sensing practices that are proliferating through newer sensor technologies. While there are clear similarities across citizen science and citizen sensing in the ways in which citizens monitor environments, the rise of new sensor technologies has generated new technical capabilities and practices, including the generation of new types and quantities of environmental data. It is these technical practices that we focus on as forms of citizen sensing.
Indeed, the increasing number of low-cost digital sensors are said to be revolutionising air quality science (US Environmental Protection Agency (US EPA), 2013, 2015; cf. Snyder et al., 2013). Technologists and environmental regulators suggest that environmental sensors can augment more official readings and/or pro-vide environmental data where there is an absence of monitoring networks and infrastructure. For instance, in one of its reports on the topic of ‘next generation monitoring’, the US EPA specifically attends to the ways in which ‘more, but less precise, air quality meas-urements can supplement the measurement data from established monitoring stations’ (2013: 1). The increas-ing amount of environmental data is often described as providing more ‘indicative’ measurements about events such as air pollution. Indicative monitoring typically demonstrates patterns and changes in data, rather than absolute numerical values in relation to regulatory standards. Indicative monitoring can take place not only through low-cost sensors, but also through organ-isms such as lichens, as long as the patterns generated through these various indicators can be understood in relation to an index and set of monitoring protocols. With low-cost sensors, indicative monitoring can be undertaken and more data generated over a wider spa-tial area. While such an approach can lead to an increase in the quantity of environmental data – even contributing to Big Data practices and its problematics – this is not necessarily to the same level of numerical precision or accuracy as data produced for regulatory compliance. Nevertheless, the indicative qualities of citizen data do express patterns about whether air pol-lution is occurring at certain times of day, in shared or distinct locations, and in relation to emissions sources, for instance.
While some agencies such as the EPA outline the possible benefits of citizen monitoring, such a shift toward acknowledging the contributions that citizen data could make would also require a transformation
in monitoring networks and practices to be able to accommodate citizen data. Moreover, in order to effect such changes, an attention to data and data ana-lysis becomes key. In their drive to facilitate new tech-niques for citizens to address environmental problems, many citizen sensing projects focus on sensor devices, primarily in the form of hardware and platform devel-opment (for example, see Air Quality Egg and Smart Citizen). At the same time, within citizen sensing pro-jects there can be a comparative lack of attention given to the question of how to work with the citizen data captured through and alongside these technologies (although see Aoki et al., 2009; Elwood, 2008; Safecast; Taylor et al., 2014). As users of the Air Quality Egg, Smart Citizen kit, or any number of other devices monitor and map their environments, it is not always clear how they are meant to interpret, analyse and mobilise their data. The ‘citizen’ engaged with monitoring is notionally meant to be a political subject able to attend to and act on environmental problems not only from the position of a non-expert, but also from the position of a more enabled global user. While data gathered through citizen sensing prac-tices is meant to translate into new forms of political action, the specific ways in which citizens could activate new stores of environmental data often remains ambiguous. Such a situation raises questions about the extent to which citizen data can readily effect pol-itical change, and about what new forms of data citi-zenship could emerge through these attempts to account for and address environmental problems.
Within the so-called democratization of environmen-tal monitoring technologies and practices, a key ques-tion then emerges as to how the democratizaques-tion of environmental data could also develop. The democra-tization of data practices could generate alternative approaches to data content and analysis. At the same time, these altered data practices could generate differ-ent modes of evidence for making claims and effecting political change by corroborating and combining data with a range of data types, including observations and experience. As the US EPA (2013) suggests, ‘types of data’ and ‘types of uses’ are interlinked (cf. Gabrys and Pritchard, 2015). In other words, there is a co-constitu-tive dynamic that develops across the range of ways in which data are parsed, processed and put to use (Gabrys, 2016b: 157–181). The entanglements of data, data practices and forms of use are informative for how citizens could generate and operationalize environmen-tal data in a more expansive set of registers, and in such a way that speaks to their lived experiences.
an unmonitored area, or shared pollution events across a community, there are a range of environmental events that do not typically register in an air pollution dataset used for regulatory compliance. Citizen data and data practices concretize along with the events about which citizens are attempting to make sense. As Ruppert et al. suggest in their discussion of the ‘social lives of data’, a focus on the ‘specific socio-technical practices through which data is generated’ (2015: 1), whether that data is Big Data or otherwise, can further indicate the values and decisions involved in making data. Paying atten-tion to the co-constitutive dynamics of data could also be a way to begin to value citizen data and data prac-tices that are overlooked or disregarded, and to note the contexts in which data citizenships take shape, often through practices of contestation.
While citizen sensor data is one of many data streams contributing to stores of Big Data for environ-mental monitoring, this data can often be relatively patchy or even quite diverse, whether because the form and formatting of data, or because of the incon-sistency of monitoring. Big Data in this sense is not an all-encompassing quantification. Although the research we undertook was in one way situated in relation to the generation of new types and quantities of citizen data, we also encountered the initial problem of a perceived absence of data. In this region of rural northeastern Pennsylvania, there is a relative lack of air quality monitoring infrastructure, since most regulatory-focused air quality monitoring is undertaken where there are higher population densities and is concen-trated in urban areas. At the same time, fracking as an industry is exempt from many federal-level environ-mental regulations for protecting air and water quality (the so-called ‘Halliburton Loophole’), and so respon-sibility falls on states to monitor and industry to self-report air emissions. Furthermore, relatively little is known about the ongoing impacts and effects of frack-ing on air quality in this region, since the nearest air quality monitor measuring criteria air pollutants was located 55 miles away in the small city of Scranton. While there is an increasing attention to Big Data as it is being generated and circulated, typically within social media and security spaces, here are environments where there is a scarcity of data, and that scarcity has political effects.
Some writers suggest that with the availability of expanding quantities and different types of data such as citizen sensor data, the credibility of data as well as the perceived validity of science can deteriorate (cf. Lagoze, 2014: 4–5). Yet rather than argue for new types of standards and metrics to reinforce the validity and credibility of data, Michael and Lupton (2016) pro-pose that we adopt a ‘manifesto for the public under-standing of Big Data (PUBD)’. This would be a project
of attending to the ways in which multiple data streams can contribute to new knowledge projects, while creating ‘new ways of thinking about data and data practices’ (2016: 110). In this way, we suggest that citi-zen-gathered data can be analysed along with other datasets to generate new observations and understand-ings of air pollution and other environmental events, especially where that data is lacking. By making, rather than merely accessing data, citizens generate distinct relations to types and uses of data (cf. Vis, 2013), which can in turn be expressive of new data citizen-ships. We further suggest that qualities of ‘bigness’ can shift in relation to citizen data practices, where Big Data on one level might describe an unwieldiness of data – a characteristic at times attributed to Big Data (cf. Kitchin and McArdle, 2016) – that might create new practices in the process of attempting to under-stand environmental problems.
If we consider how Big Data emerges not as an abso-lute designation but instead through particular data practices (cf. Ruppert et al., 2015), the citizen data gathered in this research became ‘big’ in part because there was an absence of data about environmental pol-lution in this region, and in part because citizen-based capacities and infrastructure for managing, analysing and communicating the data were not established. Here was more data than had previously been gener-ated about this topic. Although our datasets in the end measured in the gigabytes rather than the tera- or peta-bytes, size by this measure of Big Data was not the defining characteristic. Instead, this dataset provided a new indication of what might be in the air, since indi-vidual reports of health effects did not count as suffi-cient or conclusive evidence of problems with pollution or exposure.
The data gathered was also a comparatively more extensive dataset than previous monitoring projects might have produced: it was not a one-page report on air or water quality sent from a laboratory, or a scien-tific paper generated by a university researchers who had asked residents to gather samples and then later produced results. Instead, this was data in its unwieldy form as it was being generated. Yet its unwieldiness was not due to the formal characteristics of volume, velocity or even variety (Laney, 2001), but rather had more to do with the citizen-based aspects of this research, where established infrastructures for data analytics or eviden-tial verification were not in place. The unwieldiness of data can then emerge in relation to the resources – and distribution of those resources – for making sense of and mobilising data.
monitoring, in part because of a (momentary) lapse in the ability to make sense of data, and in part because the capacities for analysing data might not exist in more citizen-led initiatives. Indeed, there were multiple other qualities that citizens undertaking air quality monitor-ing in Pennsylvania sought for their data, which could be just as thoroughly examined, including: hardness, veracity, effectiveness and irrefutability. Rather than append a new descriptor to data, however (cf. Uprichard, 2013), we instead investigate the emergence of citizen data and data practices that, whether because the amount of data proves to be unwieldy or because the modes of collection transform along with the for-mation of evidence, demand alternate and even invent-ive strategies for making sense of that data. It is through these processes of making and making sense of citizen data that new data citizenships could also emerge, both as attempts to establish infrastructures in common for documenting environmental problems, and for forming evidence in pursuit of environmental justice.
From data practices to data stories
Turning now to discuss the citizen-gathered air quality data and data stories in more detail, we work through the ways in which we found types of data and data practices to be co-constitutive. We also demonstrate how citizen data required multiple different encounters and ways of making sense of collective datasets and observations as they were emerging and had already been documented. Indeed, we initially came to work with this community because residents were already engaged in environmental and air quality monitoring, whether through self-initiated projects, environmental justice campaigns or sample collection for university-based scientists. The first part of our research focused on learning more about these existing monitoring tech-niques and the data gathered. However, our research primarily engaged with practice-based and participa-tory methods for identifying environmental problems to monitor, and developing techniques through the use of sensors to document and evidence claims about those problems. We describe these practice-based and participatory methods in relation to the monitoring process, data practices and data stories, as our focus here is also specifically on the issues that arose in rela-tion to citizen data.
Developing a data stories method
Stories, as Bell (2015: 19) suggests in her discussion of Big Data, are a way of generating and accounting for responsibilities that might emerge in relation to data. In this sense, we understand data stories as we develop
them here to be more than a visual or even narrative technique, as they articulate forms of relevance and responsibility that might be activated through data. In composing these stories, we also draw on Haraway (1997) who suggests that stories are not only integral to the politics of composing technoscience, but are also a technique for making worlds. In other words, ‘to ‘‘figure’’ means to count or calculate and also to be in a story, to have a role’ (Haraway, 1997: 11). Figurations, from this perspective, include language and mathematics, the verbal and the visual: they cross the boundaries of the qualitative and the quantitative, which in themselves are figurations of data. They
also ‘can be condensed maps of contestable
worlds’ (Haraway, 1997), and thereby capture and express the different worlds that are at stake in these figurations.
In composing these data stories, we developed a dis-tributed ‘authoring’ process, where citizen data and observations, text and images, assemble along with visualizations and analyses, generated through digital sensors and computational algorithms, human senses and more-than-human detection techniques, which were also worked and reworked by researchers and resi-dents, designers and programmers. Drawing on Haraway, we develop these data stories as modes of ‘interpretive practice’ that ‘map universes of know-ledge, practice and power’ (Haraway, 1997).
over the course of the research. However, the forms of data that assembled into data stories did not in all cases exist as standardised units of measure, but also included experiences, observations and accounts that we collectively gathered as part of the composing pro-cess for developing data stories.
Once we had distributed the monitoring kit to resi-dents and as the citizen monitoring unfolded over the space of several months, an increasing sense of urgency emerged not just to undertake air quality monitoring but also to analyse the data. Residents lived with the day-to-day visceral experience and abject response to a number of industry activities underway, from the ‘stink’ of infrastructure to the constant truck traffic and the din of compressor stations. They were concerned about their health, and about the impact of this industry on the community. The citizen data collection then became one way to look for patterns that might corroborate or explain what was happening on the ground.
Given the disjuncture between the expertise needed to analyse the data and the researchers’ and residents’ skills in undertaking data analysis, we developed this collaboration across disciplines and including atmos-pheric science in order to analyse the particulate data that residents were collecting. In the process of estab-lishing techniques for making sense of the citizen-gath-ered data, we generated five data stories in five different townships that we developed as a method for making sense of the data (Figures 1 to 5). We used townships as the location identifier for the stories so as to blur the exact monitoring locations while still maintaining a clear relation to infrastructure and sites of possible pollutants.
The data included in the data stories was complex and multi-faceted, coming from a variety of sources and practices. Using our ‘Airsift’ data analysis toolkit, we generated visualizations that indicated time of day when pollution might be occurring, as well as location, emission source, and relationship to temperature, humidity and wind speed and direction. We worked with residents to gather observations and to compare ‘data’ to ‘data’, or in other words, to assess how numer-ical data aligned (or not) with experience on the ground, for instance, of industry operations or experi-ences of emissions. We also identified points where what would ordinarily be overlooked as not data-worthy or as incalculable could be included in the inter-pretive practices of the data stories. Data stories can present a way to encounter the points where data becomes seemingly intractable. It is at these points where new data practices and data stories could also emerge.
Using the data stories as a method and technique, we then developed these as forms of evidence that could be ‘just good enough’ to suggest that more attention should be given to ensuring air quality is protected in relation to fracking activities. In the three sections that follow, we discuss the five data stories in more detail, including the types of data and data practices engaged with, as well as the ways in which citizen data expanded understandings of and approaches to the problem of air pollution through developing new forms of evidence. We discuss the process of forming these stories, and include some of the content that contributed to these figurations. The full stories are available through the figures, which link to our data stories website.
Figure 2. Data Story 2: Brooklyn Township citizen air quality monitoring, Citizen Sense. datastories.citizensense.net.
Figure 3. Data Story 3: Brooklyn Township citizen air quality monitoring, Citizen Sense. datastories.citizensense.net.
Data stories: Forming evidence through citizen
data
Paul lives in Dimock Township (Figure 3), an area well known for its cases of contamination (and disputes over that contamination) of groundwater (Osborn et al., 2011). His home has become increasingly enclosed by fracking infrastructure, so that he is now living within what he calls a ‘death triangle’, where three compressor stations surround his home. The sound and smells from the stations are felt most acutely at night, where noise that Paul likens to the sound of an airport permeates the walls of his house. No matter which way the wind blows, Paul receives emissions from this nearby infra-structure – and compressor stations have been described by some residents as similar to refineries in the intensity of their operation. Using a handheld deci-bel monitor Paul had previously attempted to monitor the noise of the nearby compressor stations, highlight-ing moments when the noise was higher than the per-mitted 55 decibels. However, the township government rejected his data, claiming that he had not taken into account the noise of local bullfrogs, which made the data inadmissible. As just one example, regulators rou-tinely dismissed the many attempts by citizens to docu-ment environdocu-mental problems by collecting data and presenting it as evidence.
Paul’s experience points to the ways in which noise, smell, air pollution and negative health effects become part of a changing environment in which he is living and attempting to adapt, while also hoping to develop modes of accountability and redress. Yet how does one
begin to account for these events? If environmental monitoring is one way to track and document possible air pollution episodes, how should this data be gath-ered, and what form does it need to take in order to be presented as ‘evidence’ of the effects and impacts of fracking? In this respect, just as many questions could be raised about how these forms of data and evidence focus attention in particular ways, while potentially also occluding other types of experience. In undertak-ing this citizen sensundertak-ing research and workundertak-ing with
citi-zen-gathered data in order to document and
demonstrate the effects of fracking on bodies, commu-nities and environments, we were on the one hand working with attempts to generate forms of evidence that might have some traction as air pollution data. On the other hand, we were addressing the potential limitations of ‘official’ modes of evidence that often ignore or overlook observations and experiences of health effects and changing landscapes (cf. Ottinger and Zurer, 2011).
With these challenges in mind, we then began to work through citizen-gathered data by looking at emission sources. As part of the process of gathering observations and building up patterns of evidence, along with resi-dents we put together an extensive inventory of possible particulate emission sources, from pollen events, road traffic and lawn mowing in the Dimock Township site, to the details of when compressor station engines might have been in full operation (including the typical emis-sions output of the Caterpillar engines in the facilities) at the Liberty (Figure 5) Township site, to the spudding of new well pads at several other sites.
We also attended to the timing of pollution events, as we established patterns in what could be causing higher readings in the data at different times of day, where for instance, spikes in the morning and evening could be due to traffic, but patterns at other times could be related to events such as industry processes. We then compared emissions inventories and temporal patterns with the particulate data as visualized through our ‘Airsift’ data toolkit, analysing spikes and peak events in the datasets, homing in to understand the temporal and spatial distribution of the pollution events, and attempting to piece together the likely causes of local pollution events.
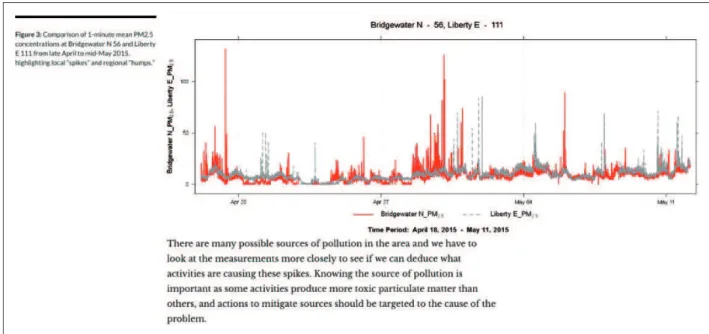
Through this process of contextualising the measure-ment data in relation to observations and events, cer-tain patterns settled into forms of evidence through the use of multiple data types, which further indicated links between pollution events and industry sources. We found at the Bridgewater site (Figure 1) that a nearby compressor station was likely causing significant pollu-tion events, even though there was also a fracking site directly across the road less than 500 feet from the monitoring site. We found that given the density of infrastructure in the Dimock area, there was an array of pollution signals that were not always easy to attri-bute to particular sources. However, the three compres-sor stations surrounding the Dimock site were each contributing to air pollution at the monitoring location depending upon the prevailing wind direction. And we found at the Liberty site there were elevated particulate levels that exceeded the residents’ expectations since they lived in a relatively remote and wooded location and did not typically feel affected by air pollution. These elevated levels were also not easy to attribute to a source, but were most likely related to a nearby compressor station and well pad, as these were the only possible emission sources nearby.
The datasets from which these forms of evidence were drawn together were more or less continuous, depending upon the length of time and duration of monitoring that residents undertook. Yet these at-time partial datasets were still ‘just good enough’ to bring together multiple streams of data to make a case for pollution events. Even with these preliminary forms of evidence, more work was still required to establish patterns in the data so that stories could be generated, and so that citizens’ concerns could be fig-ured into a collective account.
Data stories: Finding patterns, attributing sources
Although the citizen data did not assemble into a com-plete or continuous dataset, by working across different types of data that could be compared and cross refer-enced, we could begin to detect patterns and tell stories
about the data. While our ‘Airsift’ toolkit processed the citizen-gathered data to produce charts and plots of pollution patterns, we also began to cross-reference the visualizations and to piece together evidential stor-ies that could describe whether and when pollution events might be occurring.
This process required establishing the regional base-line, or average pollution level, that might be expected as part of the background or regional pollution for this area. Based on the overall community datasets, we established that the regional particulate baseline was around 15mg m3. We were then able to establish
pat-terns where particulate levels exceeded this baseline in order to detect possible pollution events attributable to local sources. We also identified patterns where pollu-tion levels exceeded the World Health Organisapollu-tion (WHO) guideline of 25mg m3for 24-hour daily mean
concentration of PM2.5in order to note where pollution levels might be of particular concern (WHO, 2006; cf. US EPA, n.d.).1
Using line graphs to home in on these patterns that occurred above the regional baseline and WHO guide-lines, we could cross-reference pollution events using wind speed and wind direction data in order to estab-lish the likely source of pollution. Although we looked into the possibility of using weather data from official monitoring stations, the historical data resolution that was available was not detailed enough. Weather Underground data (which is also a source of primarily citizen-generated weather data) provided a way to access higher resolution weather data, and to link with the other datasets that had been collected. Using weather data from Weather Underground, we then looked at how pollution events could be read in relation to wind speed to understand the dispersion of pollu-tants as travelling from regional or local sources (depending upon the strength of the wind speed), and through looking at wind direction to establish a pollu-tion signal from a direcpollu-tion and likely source based on the citizen inventory of emission sources. In establish-ing these patterns, we repeatedly worked with and across a range of data types, including the citizen-gen-erated air quality data, Weather Underground data, and eyes-on-the-ground contextual data in the form of observations and experiences of industry sites and activity.
predictive modelling enables an understanding of emis-sions as they circulate. In this practice, data based on prediction fills the gaps and uncertainties in the col-lected data, thereby giving more value to the ‘just good enough data’.
These polar plots enabled us to study more closely the extent to which clear pollution signals emerged from the data. Differing from the visual sifting and searching for pollution events discussed above, the polar plot script integrates two of the mathematical features of Big Data: statistical analysis and smoothing. Bivariate polar plots model the way that two variables change together. Using the ‘Airsift’ data analysis tool-kit, we demonstrated how the polar plot models the variation of particulates together with the variation of wind direction and speed. The resulting graphical plot visualizes the partially predicted distribution of sur-rounding sources of particulates. The polar plot is used for graphical interpretation – a sort of just good enough data technique – rather than quantifiable meas-urement. These sorts of ‘overfitting’ functions often lead to a mistrust of Big Data, especially as used in security studies and social media (cf. Aradau and Blanke, 2015). However, environmental data in many ways can benefit from the predictive techniques of Big Data, where spatial and temporal patterns can be gen-erated from just good enough data and to enhance understandings from that data, for instance, by attri-buting pollution events to sources.
By running polar plots for a number of sites, pre-dictive modelling could be overlaid with the citizen-gen-erated data. We could then use the spatially dense data together with observational data from residents to study the patterns plotted using the polar plot function. These comparisons of data also allowed us to identify disjunctures in data, which were often quite nuanced and entangled with the capacities of sensors. In some cases, particularly with the Bridgewater, Brooklyn (Figure 2) and Dimock Township sites, observations about industry sites suspected of contributing air pol-lution emissions were supported by the data. At other times, there was a disjuncture with observations. The Mehoopany (Figure 4) Township site had numerous fracking-related activities underway at the time of monitoring, and a sense that pollution must be present, but no clear pattern was found in the citizen-generated data to establish whether there were notable pollution events or if they could be attributed to any particular source. In the case of the Liberty Township site, par-ticipants felt that they did not have a particular prob-lem with air quality because of their remote location, and yet their monitoring data indicated otherwise, with frequent elevated levels of particulates as well as a signal produced through the polar plots and wind rose plots that suggested nearby fracking infrastructure
could be a likely source. This led the participants at the Liberty Township site to investigate further possible sources. Interestingly, it was through the process of mapping the details of all possible emission sources, such as types of fracking infrastructure, quarries, dust tracks and roads, that one of the participants at this site described feeling more like a citizen scientist than when using digital monitoring devices. This citizen-based contribution stemmed from a sense that he could bring his situated analysis and understanding to the data visualized by the polar plots in a way that general-ised science would not. The different ways in which observational data and a range of other citizen-gath-ered data then concretize to form patterns are not always straightforward or predictable, and can provide different ways of generating stories from the data.
Data stories: Activating data as relevant
Working through these just good enough forms of data, we found that it was possible to establish patterns of evidence from which claims could be made about local sources of air pollution. The citizen-gathered data is unique in that it not only provides air quality data in a region where there is relative absence of monitoring, but also because it is spatially dense and occurs over a longer monitoring period than most episodic ‘expert’ monitoring. This allowed neighbouring data to be com-pared, and sensor data could be corroborated and aug-mented with observations. Rather than seeking to match the regulatory practices of monitoring in order to arrive at precise measurements of air pollutant levels, the citizen-gathered data indicated whether pollution events might be occurring and how they might be iden-tified. These different forms of citizen data and data practices are intertwined and co-constitutive, but they also point to the ways in which data might be further activated to arrive at points of relevance and action-ability through the data stories that capture multiple experiences of pollution.
monitoring instruments and citizen-gathered data were questioned by regulators, and a clear power dynamic emerged around who might be authorized to undertake environmental monitoring, at the same time one of the regulators undertook follow-up monitoring in the area on the basis of this teleconference and the preliminary citizen data findings (Gabrys and Pritchard, 2015; Pritchard and Gabrys, 2016). This agency, the Agency for Toxic Substances and Disease Registry (ATSDR), produced a report (2016) documenting monitoring undertaken near the Brooklyn location. Similar to the citizen monitoring findings, their report documented elevated levels of particulates, which were partially attributable to fracking infrastructure in the area.
Citizen monitoring prompted the ATSDR follow-up study, and the ATSDR results were published at the same time as the citizen monitoring data and data stor-ies. Following on from these events, the Pennsylvania Department of Environmental Protection (PA DEP) (2016) also announced that it was undertaking an ‘unprecedented expansion’ of its particulate monitoring network, and investing nearly 1.6 million USD in moni-toring infrastructure and maintenance. While the PA DEP noted in its press release that it had listened to the concerns of citizens of Pennsylvania, it also sug-gested elsewhere that the timing of these events was ‘coincidental’ (as cited in Hurdle, 2016). Yet the con-cerns of citizens were expressed largely in the form of citizen data and evidence that was both individually communicated to the PA DEP (Colaneri, 2014), and collectively sent to this agency in April 2016. The citi-zen monitoring efforts contributed to a number of responses by regulatory bodies that included increasing investment in air quality infrastructure. The then Secretary John Quigley noted that the investment reflected an interest in obtaining data where there was a relative absence of such data (PA DEP, 2016). In this context, citizens should arguably receive greater recog-nition for the ways in which they have developed their own data practices and data stories that not only pro-vide unique insights across different forms of data, but also draw attention to the limitations of ‘official’ regu-latory practices and the possible contributions to be made by citizen data and data practices.
While residents were not following a regulatory pro-cess for undertaking environmental monitoring, they argued that their data was still relevant as it provided often clear and consistent patterns indicating that pollu-tion events were occurring. As they further argued, their data was unique in the perspectives it offered and the ways in which it matched up different forms of data that might not ordinarily be cross-referenced. This dif-ferent approach to environmental data and evidence then activated different types of data relations. It effect-ively was involved in co-constituting new practices and
environments in and through which the citizen-gathered data could begin to have relevance. Rather than repli-cating regulatory processes, citizen environmental data was transforming the types of data gathered, the modes of comparing and synthesizing data, and the practices for creating stories and relevance from datasets – as ‘more than empirical’ records (Gabrys, 2016c; cf. Bell, 2015). In other words, the data stories were developing new interpretive practices that could operationalize data so as to take account of lived experiences, yet through distinctly non-linear and entangled engagements (cf. Garnett, 2016). The data stories are not necessarily a way of revealing results. Instead, as a process of ‘figuring’ data stories generate other worlds and world-ing processes from citizen data, in which citizens’ experi-ences matter.
Conclusion: Just good enough data and
creative data citizenships
Citizen sensing practices are inventive and diverse, mobilising many different devices, protocols and infra-structures. Although much environmental monitoring takes place in organised structures and projects, our research has shown that ‘informal’ sensing practices are an important aspect of sensing and data infrastruc-tures (Gabrys and Pritchard, forthcoming). A crucial part of these practices is the generation of new and alternative types of data and data stories that emerge along with citizen monitoring practices. This citizen-gathered data is often ‘just good enough’ to establish patterns of evidence that can mobilise community responses in terms of communicating with regulators, requesting follow-up monitoring, making the case for improved regulation and industry accountability, and keeping track of exposures both on an individual and collective level.
Despite the fact that many experts refer to regula-tory standards as the primary if not only way in which to undertake monitoring, we suggest that if citizens were to proceed with the use of technologies and proto-cols that simply follow regulators’ practices they could shut down the very possibilities that citizen monitoring might have the potential to open up. By merely follow-ing regulatory practices, numerous citizens would be excluded from undertaking monitoring, or from enga-ging with data practices and generating forms of evi-dence that resonate with their experiences.
are the expression of democratic engagement with environmental problems. It is these engagements, more-over, that bring ‘serious citizen agency’ to areas that are often lacking in these contributions (Haraway, 1997: 95). Such an approach might further help to ‘reshape data cultures to enable community participation’ (Ottinger, 2016; Mah, 2016). These are strategies for reworking and refiguring who or what is authorised to generate environmental data and make their stories count, particularly when there is a rise of citizen-based monitoring on the gas fields (cf. Steinzor, 2016).
These data practices and stories then also suggest new ways in which ‘data might actually come to matter and make a difference’ through expanded data stories (Taylor, 2016: 189). Although indicative meas-urements do not compare with regulatory standards for precision and accuracy of data, they do suggest ways of working across measurement and experience, and of accounting for the lived conditions of environmental pollution. While the data stories we have discussed here suggest one method and technique for working through citizen data, we would hope there are multiple ways in which citizen sensing and citizen data might be approached that could expand the space for what counts as actionable data (cf. Schrock, 2016), while opening up new types of data practices toward invent-ive data citizenships.
Citizen-generated data and data analysis can offer alternative ways of thinking about the often-monolithic discourses around environmental data and Big Data to develop an understanding of the concrete ways in which data practices unfold in relation to environmental problems. They potentially help to generate a set of techniques for engaging with and querying evidence and evidence making; while providing an opening into what Gray et al. (2016) refer to as a challenge to the usual ways of collecting and interpreting data. Such challenges could be staged by looking at data gaps, data biases and the data status quo. In turn, by attempting to do data differently, collective environ-mental problems could be more creatively and expan-sively addressed and mitigated. This is the other aspect of ‘just’ good enough data – that citizen data could provide ways of realising environmental and social justice.
Acknowledgements
The research leading to these results has received funding from Thanks are due to participating residents in Pennsylvania, including Frank Finan, Rebecca Roter, Meryl Solar, Vera Scroggins, Chuck and Janis Winschuh, Paul Karpich, Barbara Clifford, John Hotvedt, Barbara Scott, Audrey Gozdiskowski, and Alex Lotorto, along with ano-nymous participants, as well as previous Citizen Sense researchers, including Nerea Calvillo, Tom Keene, and Nick
Shapiro, and consultants including Kelly Finan (illustration), Lau Thiam Kok (data architecture), and Raphael Faeh (web design). Thanks are also due to the Create Lab at Carnegie Mellon University for loaning Speck devices for use in this study.
Declaration of conflicting interests
The author(s) declared no potential conflicts of interest with respect to the research, authorship, and/or publication of this article.
Funding
The author(s) disclosed receipt of the following financial sup-port for the research, authorship, and/or publication of this article: the European Research Council under the European Union’s Seventh Framework Programme (FP/2007-2013)/ ERC Grant Agreement n. 313347, ‘‘Citizen Sensing and Environmental Practice: Assessing Participatory Engagements with Environments through Sensor Technologies.’’ Support for Benjamin Barratt was obtained from the National Institute for Health Research (NIHR) Biomedical Research Centre based at Guy’s and St Thomas’ NHS Foundation Trust and King’s College London. The views expressed are those of the authors (s) and not necessarily those of the NHS, the NIHR or the Department of Health.
Note
1. The US EPA National Ambient Air Quality Standards for PM2.5 are higher than the WHO standards, with PM2.5
standards for the 24-hour daily mean concentration set at 35mg/m3. See https://www.epa.gov/criteria-air-pollu-tants/naaqs-table (accessed 8 May 2016).
References
Agency for Toxic Substances and Disease Registry (ATSDR) (2016) Health Consultation: Brooklyn Township PM2.5. Brooklyn Township, Susquehanna County, Pennsylvania (22 April).
Air Quality Egg. Available at: http://airqualityegg.com (accessed 15 August 2016).
Aoki PM, Honicky RJ, Mainwaring A, et al. (2009) A vehicle for research: Using street sweepers to explore the land-scape of environmental community action. In: CHI ’09: Proceedings of the SIGCHI conference on human factors in computing systems, ACM, New York, pp. 375–384. Aradau C and Blanke T (2015) The (Big) Data-security
assemblage: Knowledge and critique.Big Data & Society 2(2): 1–12.
Bell G (2015) The secret life of big data. In: Boellstorff T and Maurer B (eds) Data, Now Bigger and Better! Chicago: Prickly Paradigm Press.
Carslaw DC and Ropkins K (2012) Openair – an R package for air quality data analysis. Environmental Modelling & Software27–28: 52–61.
Colaneri K (2014) Gas drilling draws citizen scientists to the field. State Impact: Pennsylvania (NPR). Available at: http://stateimpact.npr.org/pennsylvania/2014/12/19/gas-drilling-draws-citizen-scientists-to-the-field (accessed 15 August 2016).
Corburn J (2005)Street Science: Community Knowledge and Environmental Health Justice. Cambridge, MA: MIT Press.
Elwood SA (2008) Volunteered geographic information: Future research directions motivated by critical, participa-tory, and feminist GIS.GeoJournal72: 173–183.
Gabrys J (2016a) Citizen sensing: Recasting digital ontologies through proliferating practices. Theorizing the Contemporary. Cultural Anthropology. Available at: http://culanth.org/fieldsights/823-citizen-sensing-recast-ing-digital-ontologies-through-proliferating-practices (accessed 13 October 2016).
Gabrys J (2016b) Program Earth: Environmental Sensing Technology and the Making of a Computational Planet. Minneapolis: University of Minnesota Press.
Gabrys J (2016c) Re-thingifying the internet of things. In: Starosielski N and Walker J (eds)Sustainable Media: Critical Approaches to Media and Environment. New York, NY: Routledge, pp. 180–195.
Gabrys J and Pritchard H (2015) Next-Generation environ-mental sensing: Moving beyond regulatory benchmarks for citizen-gathered data. In:Proceedings of the workshop ‘Environmental Infrastructures and Platforms 2015’(eds AJ Berre, S Schade and J Piera), co-located with the European Citizen Science Association General Assembly 2015 (ECSA GA’2015) Barcelona, Spain. pp. 57–65. Available at: http://ecsa.citizen-science.net/sites/default/ files/envip-2015-draft-binder.pdf (last accessed 13 October 2016).
Gabrys J and Pritchard H (forthcoming) Sensing practices. In: Braidotti R and Hlavajova M (eds) Posthuman Glossary. London: Bloomsbury Press.
Garnett E (2016) Developing a feeling for error: Practices of monitoring and modelling air pollution data.Big Data & Society3(2): 1–12.
Goodchild MF (2007) Citizens as sensors: The world of vol-unteered geography.GeoJournal69: 211–221.
Gray J, La¨mmerhirt D and Bounegru L (2016) Changing what counts: How can citizen-generated and civil society data be used as an advocacy tool to change official data collection? Open Knowledge Foundation. Available at: http://civicus.org/thedatashift/wp-content/uploads/2016/ 03/changing-what-counts-2.pdf (accessed 15 August 2016). Haraway D (1997) Modest_Witness@Second_Millennium. FemaleManß_Meets_Onco-MouseTM. New York, NY: Routledge.
Hurdle J (2016) PA expands particulate monitoring as federal study finds high level in one location. State Impact: Pennsylvania (NPR). Available at: https://stateimpact. npr.org/pennsylvania/2016/05/05/pa-expands-particulate- monitoring-as-federal-study-finds-high-level-in-one-loca-tion (accessed 15 August 2016).
Irwin A (1995)Citizen Science: A Study of People, Expertise and Sustainable Development. London: Routledge.
Kitchin R and McArdle G (2016) What makes Big Data, Big Data? Exploring the ontological characteristics of 26 data-sets.Big Data & Society3(1): 1–10.
Lagoze C (2014) Big Data, data integrity, and the fracturing of the control zone.Big Data & Society1(2): 1–11. Laney D (2001) 3D data management: Controlling data
volume, velocity and variety. In:Meta Group. Available at: https://blogs.gartner.com/doug-laney/files/2012/01/ ad949-3D-Data-Management-Controlling-Data-Volume-Velocity-and-Variety.pdf (accessed 15 August 2016). Mah A (2016) Environmental justice in the age of big data:
challenging toxic blind spots of voice, speed, and expertise. Environmental Sociology 1–11. DOI: 10.1080/ 23251042.2016.1220849.
Michael M and Lupton D (2016) Toward a manifesto for the ‘public understanding of big data’.Public Understanding of Science25(1): 104–116.
Nature Editorial (2015) Rise of the citizen scientist.Nature 524(265). Available at: http://www.nature.com/news/rise-of-the-citizen-scientist-1.18192 (accessed 15 August 2016). Osborn SG, Vengosh A, Warner NR, et al. (2011) Methane contamination of drinking water accompanying gas-well drilling and hydraulic fracturing. Proceedings of the National Academy of Sciences (PNAS) 108(2): 8172–8176.
Ottinger G (2016) A missing link in making meaning from air monitoring?Backchannels(4S online). Available at: http:// www.4sonline.org/blog/post/a_missing_link_in_making_ meaning_from_air_monitoring (accessed 15 August 2016). Ottinger G and Zurer R (2011) New voices, new approaches: Drowning in data.Issues in Science and Technology27(3). Available at: http://issues.org/27-3/ottinger (accessed 15 August 2016).
Pennsylvania Department of Environmental Protection (PA DEP) (2016) DEP expands particulate matter air monitor-ing network (press release). Available at: http://www. media.pa.gov/Pages/DEP_details.aspx?newsid¼629
(accessed 15 August 2016).
Pritchard H and Gabrys J (2016) From citizen sensing to collective monitoring: Working through the perceptive and affective problematics of environmental pollution. GeoHumanities.
Ruppert E, Harvey P, Lury C, et al. (2015) Socialising Big Data: From concept to practice.CRESC Working Paper Series 138. Available at: http://www.cresc.ac.uk/mediali-brary/workingpapers/wp138.pdf (accessed 15 August 2016).
Safecast. Available at: http://blog.safecast.org (accessed 15 August 2016).
Schrock AR (2016) Civic hacking as data activism and advo-cacy: A history from publicity to open government data. New Media & Society 201618(4): 581–599.
Smart Citizen. Available at: https://smartcitizen.me (accessed 15 August 2016).
Snyder EG, Watkins TH, Solomon PA, et al. (2013) The changing paradigm of air pollution monitoring. Environmental Science and Technology47: 1136911377.
earthworksaction.org/files/publications/Air_Monitoring_ White_Paper_March_2016_(1).pdf (accessed 15 August 2016).
Taylor AS, Lindley S, Regan T, et al. (2014) Data and life on the street.Big Data & Society1(2): 1–7.
Taylor A (2016) Data, (bio)sensing, and (other-)worldly stor-ies from the cycle routes of London. In: Nafus D (ed.) Quantified: Biosensing Technologies in Everyday Life. Cambridge: MIT Press, pp. 189–209.
Uprichard E (2013) Big data, little questions? Discover Society. Available at: http://www.discoversoci-ety.org/focus-big-data-little-questions (accessed 15 August 2016).
US Environmental Protection Agency (US EPA) (2015) Citizen science and crowdsourcing: Creative approaches to environmental protection (draft report). Available at: http://www.epa.gov/sites/production/files/2015-09/docu ments/nacept_background_material_2.pdf (accessed 15 August 2016).
US Environmental Protection Agency (US EPA) (2013) Draft roadmap for next generation air monitoring. Available at:
http://www.eunetair.it/cost/newsroom/03-US-EPA_Roadmap_NGAM-March2013.pdf (accessed 15 August 2016).
US Environmental Protection Agency (US EPA) (n.d.) Criteria air pollutants. Available at: https://www.epa. gov/criteria-air-pollutants (accessed 15 August 2016). Vis F (2013) A critical reflection on Big Data:
Considering APIs, researchers and tools as data makers. First Monday18(10). Available at: http://firstmonday.org/ ojs/index.php/fm/article/view/4878/3755 (accessed 15 August 2016).
Wallis JC, Borgman CL, Mayernik MS, et al. (2007) Know thy sensor: Trust, data quality, and data integrity in sci-entific digital libraries. In: Kova´cs L, Fuhr N and Meghini C (eds) Research and Advanced Technology for Digital Libraries 4675. Berlin, Heidelberg: Springer, pp. 380–391.
World Health Organisation (2006) WHO Air Quality Guidelines for Particulate Matter, Ozone, Nitrogen dioxide and Sulfur dioxide: Global Update 2005. Geneva: World Health OrganisationAvailable at: http://apps.who.int/iris/ bitstream/10665/69477/1/WHO_SDE_PHE_OEH_06.02_ eng.pdf (accessed 15 August 2016).