1 INTRODUCTION
The final report of the committee D214 of the ERRI/RP9 (1999) points out the importance of the field measurements since they provide information for calibration and validation of the Fi-nite Element Models of the railway bridges and the techniques used to predict their dynamic re-sponse. The investigation developed by the authors in this domain, namely the evaluation of the dynamic response of several viaducts due to the passage of real traffic, intends to be a contribu-tion for this issue (Rebelo et al, 2005 and Rigueiro et al, 2006).
In the context of the studies for increasing the allowed traffic speed in existing railway lines, in Austria, several small to medium span bridges were investigated in accordance to the EN1991-2 (2003) and EN1990 – prAnnexA2 (2002). The structures showed a critical behavior regarding the traffic safety, namely excessive vertical accelerations at the resonance speeds be-tween the 200 km h/ and the 240 km h/ . According to this, a better estimation of the natural frequencies and viscous damping were need and an experimental validation was conducted.
Based on the results obtained from the field measurements it was possible to calibrate FE models for the bridges. The development of these models was a complicated task since in this kind of structures it is difficult to predict the influence on the dynamic behavior of several pa-rameters related to the type of bearing supports, to the superstructure defined by the ballast track and to the methodologies used for load modeling.
This paper summarizes the results obtained using calibrated FE models of three different bridges. For each structure vertical response accelerations were computed and compared with the available measured response.
The methodologies used to compute the response acceleration of the bridges are the moving load model on the track/bridge system and the interaction of the vehicle/track/bridge system, when possible. The ADINA software was used and the Wilson θ method for time integration was applied.
Experimental study of single span railway bridges
C. Rigueiro
Department of Civil Engineering, Polytechnic Institute of Castelo Branco, Castelo Branco, Portugal
C. Rebelo & L. Simões da Silva
Department of Civil Engineering, University of Coimbra, Coimbra, Portugal
ABSTRACT: The main purpose of this paper is to present some results concerning the investi-gation that has been done by the authors regarding the dynamic response of small to medium span railway bridges using response acceleration data colleted during the measurements carried out on single span bridges on the railway track Linz-Wels, in Austria. Using output-only meth-ods in this experimental program, it was possible to have an estimation of the eigenfrequencies, mode shapes and the corresponding viscous damping. Due to the fact that the bridges were of the same type some generalizations concerning their structural behavior was possible and finite element models were calibrated in order to compute responses for real traffic. The numerical model of the bridges takes into account the track and the real boundary conditions of the decks. The measured and the computed acceleration responses of the track/bridge system are com-pared using two methods: the moving forces method and the interaction vehicle/track/bridge method.
2 DYNAMIC MODELS OF THE RAILWAY BALLASTED TRACK 2.1 General
The railway ballasted track model is made of several elements which represent the rails, the sleepers, the connections between rails and sleepers, and the ballast. Each one has its proper functions and contributes to the behavior of the ballast track when subject to the passage of the trains. The rails are the key component in the track structure, since they transfer the wheel loads and distribute them over the sleepers and supports, guide the wheels in the lateral direction, provide a smooth running surface and distribute acceleration and braking forces over the sup-ports. In Europe the typical rail used in the high speed lines is the flat-bottom rail, UIC60. The connections between the rail and the sleeper provides the transfer of the rail forces (vertical and horizontal) to the sleepers, damps the vibrations and impacts caused by the moving traffic and retains the track gauge and rail inclination within certain tolerances. The sleepers are elements positioned just below the rails usually made of timber or concrete. They provide support for the rail, sustain rail forces and transfer them as uniformly as possible to the ballast. They preserve track gauge and rail inclination and provide adequate electrical insulation between both rails. The sleepers must be resistant against mechanical and weathering influences over a long period.
Finally, the ballast bed consists of a layer of a coarse-sized, non cohesive, granular material. Traditionally angular, crushed, hard stones and rocks have been considered good ballast materi-als. The interlocking of ballast grains and their confined condition inside the ballast bed permit the load distribution and the damping. They also provide the lateral and longitudinal support of the track, as well as the draining. The thickness of the ballast bed should allow the sub grade to be loaded as uniformly as possible. The usual depth for the ballast is about 0.3 meters measured from the underside of the sleeper.
In the early studies, the models of the ballasted track were developed in order to investigate the deflections of the track due to the passage of the train. Later, the train/track interaction problem, where the contact force wheel/rail and the irregularities of the track are also investi-gated. A review of these studies is presented in Knothe (1993), Fryba (1999) and Popp (1999).
A large variety of ballasted track models has been investigated, from simple 2D model to more complex 3D models, both have vertical springs and dampers connected in parallel to simulate the characteristics of stiffness and damping of the several elements that constitute the ballast track. The rails are modelled as an infinite Bernoulli-Euler or Timoshenko beam, in the 3D models both rails are taken into account and bending and shear deformation of the sleepers are included. Some of these models consider the mass of the ballast as a point mass located be-low each sleeper, shear springs and dampers may interconnect these masses Zhai (2003). The values for the mechanical properties of the track components, such as mass, inertia and elastic-ity, are mentioned as an essential input for dynamic track behaviour and, of course, for the study of the interaction between train and track.
Since this investigation focus on the comparison of the numerical results with the dynamic response obtained from field measurements regarding the influence of the ballast track on the vertical vibrations of the railway viaducts, 2D and 3D tracks models were used, although for one of the viaducts the torsion effects can be neglected.
2.2 Models and parameters
Three dynamic models of railway track are presented here, they have been used to simulate the behaviour of European rail track when submitted to high speed train and in studies similar to this. The models of ballasted tracks are presented in Figures 1 to 3 and the parameters for each Model are in Table 1. It can be said that they result from the analysis of the behaviour of the vehicle/track system, Man (2004) or the vehicle/track/bridge, ERRI/RP9 (1999) and Yang (2004).
In this investigation the dynamic track models are considered in the finite element models of the bridges and acted by concentrate moving forces or simplified vehicle models representing the passage of real trains. The parameters considered for the elements remain constant along the track, despite some deviations due to construction and maintenance works.
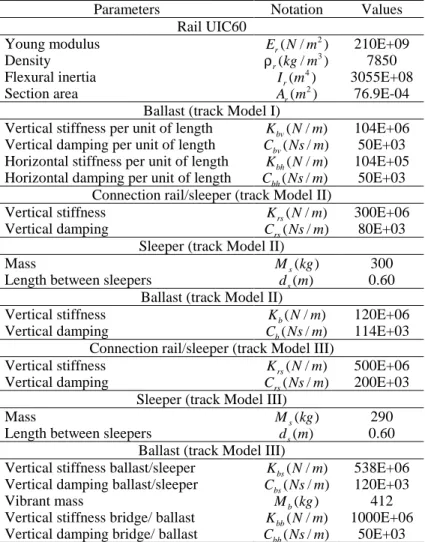
Table 1. Properties of the ballast track Model I, II and III, Yang (2004), Man (2004) and ERRI/RP9 (1999).
Parameters Notation Values
Rail UIC60 Young modulus ( / 2) r E N m 210E+09 Density ρ ( / 3) r kg m 7850 Flexural inertia ( 4) r I m 3055E+08 Section area ( 2) r A m 76.9E-04
Ballast (track Model I)
Vertical stiffness per unit of length Kbv(N m / ) 104E+06 Vertical damping per unit of length Cbv(Ns m / ) 50E+03 Horizontal stiffness per unit of length Kbh(N m / ) 104E+05 Horizontal damping per unit of length Cbh(Ns m / ) 50E+03
Connection rail/sleeper (track Model II)
Vertical stiffness Krs(N m / ) 300E+06
Vertical damping Crs(Ns m / ) 80E+03
Sleeper (track Model II)
Mass M kg s( ) 300
Length between sleepers d m s( ) 0.60
Ballast (track Model II)
Vertical stiffness K N m b( / ) 120E+06
Vertical damping C Ns m b( / ) 114E+03
Connection rail/sleeper (track Model III)
Vertical stiffness Krs(N m / ) 500E+06
Vertical damping Crs(Ns m / ) 200E+03
Sleeper (track Model III)
Mass M kg s( ) 290
Length between sleepers d m s( ) 0.60
Ballast (track Model III)
Vertical stiffness ballast/sleeper Kbs(N m / ) 538E+06 Vertical damping ballast/sleeper Cbs(Ns m / ) 120E+03
Vibrant mass M kg b( ) 412
Vertical stiffness bridge/ ballast Kbb(N m / ) 1000E+06 Vertical damping bridge/ ballast Cbb(Ns m / ) 50E+03
The Figure 1 represents the ballast track Model I, the rails are considered as infinite long beams with in plane and out of plane flexural stiffness as well as axial stiffness, the linear springs and dampers on the vertical and longitudinal directions represent the ballast. This is the simplest model of dynamic track model presented in the bibliographic review.
Figure 1. Ballast track Model I, Yang (2004).
The ballast track Model II considered the sleeper as a suspended mass and the connections between rail and sleeper as linear springs and viscous dampers acting in parallel. Their elastic and damping properties are mainly determined by the properties of the material and the manu-facturing processes. The length between the sleepers is also defined (see Figure 2).
In ballast track Model III the mass of the ballast is included as point mass instead of distrib-uted mass, and springs and dampers are used to simulate the connections between bridge/ballast and ballast/sleeper. The values of the mechanical properties for this Model III are included in Table 1.
Figure 3. Ballast track Model III, ERRI/RP9 (1999).
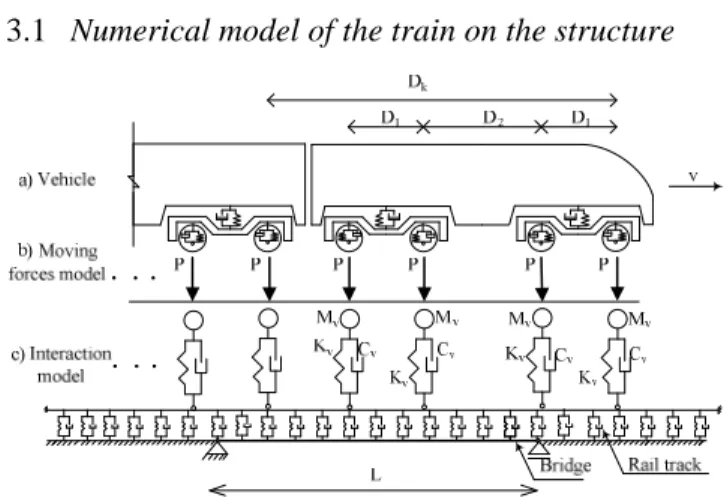
3 CONSIDERATIONS ABOUT THE DYNAMIC ANALYSIS 3.1 Numerical model of the train on the structure
Figure 4. Simulation of the train on the structure. a) Conventional train. b) Moving forces model. c) Inter-action model.
Three bridges are investigated here and for each of them different models are considered for the structure and the loading. Since the significant natural mode shapes do not include torsional deformations the bridge 1 and 8 are considered as 2D-model of the structure and the vehicles model are considered as a 2D-model too. For bridge 12, having a skew deck, important contri-bution of torsional deformations to the significant modes can’t be neglected, a 3D-model ture and a 2D-model for the loads were considered. The simulation of the trains on the struc-tures is presented in Figure 4.
The trains considered correspond to a conventional train (see Figure 4-a). Each bogie has two axles represented by two forces in the moving loads model (Figure 4-b). For the interaction model a simplified vehicle model is considered with 1-DOF, sprung mass M connected to the v bridge deck by a linear spring and damper system (Figure 4-c). The stiffness and damping of this system, denoted by K and v C , respectively, correspond to the primary suspension of the v train vehicle. The lumped mass M corresponds to a quarter of the mass of the car body and v one half of the bogie mass. The characteristic length of the carriage is denoted byD . It is con-k sidered that the train crosses the bridge at a constant speed.
3.2 Solution of the equilibrium equations
The software ADINA is used to compute the dynamic response, which can be obtained by di-rect time integration of the dynamic equilibrium differential equations system using the New-mark method or the Wilson-θ method (Bathe (1996). For these algorithms the time step may be
selected independently of any numeric stability considerations as they are unconditionally sta-ble.
According to EN1990 – prAnnex A2 (2002) to compute the maximum acceleration of the deck, the frequency band to be considered in the dynamic analysis should range from zero up to a maximum of 30 Hz or 1.5 times the frequency of the first mode shape of the structural ele-ment being considered, including at least the first three mode shapes. For that reason, in railway dynamic problems, in addition to being unconditionally stable, only low mode response is of in-terest. Therefore, it is desirable that the integration scheme possesses the capability of numeri-cal dissipation to damp out the spurious participation of the higher modes. The Newmark method as this capability of dissipation, for a fixed time step ∆t, if γ >1 2 and
(
)
20.25 1/ 2
β ≥ γ + . However this option has the disadvantage of affecting the contribution of the lowest modes as well (Hughes, 2000).
On contrary the Wilson-θ method, with θ =1.4, is highly dissipative at the highest modes, unconditionally stable and accurate when ∆t T/ ≤0.01, where T is the lowest vibration period n to take into account in the structural response analysis.
Considering these conclusions the dynamic response of the bridge was computed with the Wilson-θ method.
Concerning the damping, the Rayleigh matrix was used, that is, C= α ⋅M + β⋅K, with con-stants α and β compatible with the measurements at the first and third eigenfrequencies of each bridge.
4 NUMERICAL MODEL OF THE RAILWAY BRIDGES
4.1 General descriptions
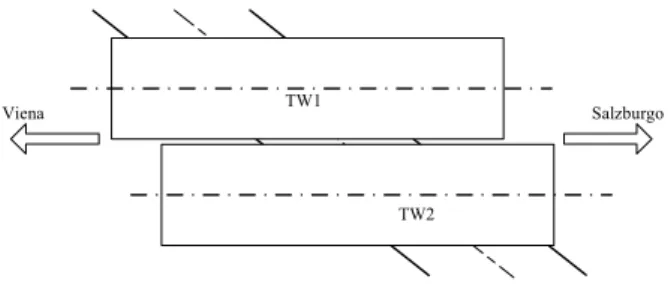
The bridges were built in 1970’s, with spans varying from 11.44 m to 23.50 m have the com-mon characteristic of being composed of single-span simple supported twins slabs, laying side by side, one for each track (see Figure 5). The geometric characteristics are summarized in Table 2 and in Figure 6. The Figure 6 represents the structural layout of these prestressed con-crete decks corresponds to one-span simply supported slab with slightly variable depth.
Viena TW1 Salzburgo
TW2
Figure 5. Plan view of the twin slabs.
The ballast depth has an average of 0.60 m depending on the slab thickness and is located all over the width of the twin slabs. The supports conditions are simple supported, with bearing supports, two at each extremity of the deck, are made of steel pots filled with rubber material and can be considered free to rotate. There is no continuity of the slab over the supports to the abutments, except the one materialized by the ballast track. It must be emphasize the fact that the bridge 1 and 8, the line of supports is not collinear when considering both decks, as it can be seen in Figure 5, and the bridge 12 is skew relatively to the axis of the bridge.
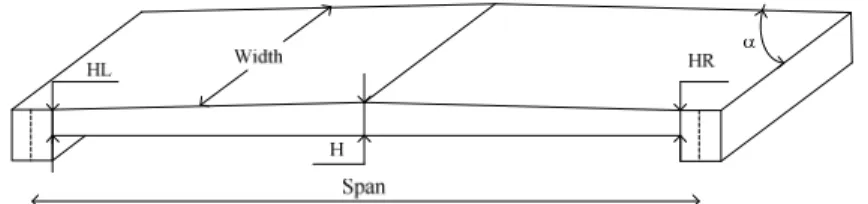
Figure 6. Structural layout of generic single span bridges. Table 2. Geometrical characteristics of the slab-type bridges.
Bridge Span (m) Width (m) HL (m) H (m) HR (m) α (º)
1 23.50 5.14 0.92 1.14 0.91 90
8 21.00 4.23 1.05 1.15 1.05 90
12 11.44 4.54 0.70 0.90 0.70 63.9
4.2 Numerical model
A Finite Element Model was developed with the purpose of comparing the computed dynamic characteristics, modes, frequencies and damping, with those obtained from measurements. Al-though the structural layout used for these bridges design corresponds to a simply supported bridges, the measurements showed that the bridges behaves as a simply supported slab with some flexural stiffness at the supports. Therefore, the numerical model includes a spring of stiffness Krail over the supports at the level of the rails (see Figure 7) simulating the continuity of the rail track, and a spring of stiffness K at the level of the bearing supports, simulating the s slip resistance.
Figure 7. Model of the bridges supports.
Since, in this model, only the rail axial stiffness can be estimated from the rail characteris-tics, and no information can be obtained for the slip resistance of the supports, this stiffness K s was considered equal to Krail, which can be estimated by
4 = r r rail s E A K d (1)
where E , r A and r d correspond, respectively, to the Youngs modulus, section area and s length between sleepers, with values given in Table 1. Using these values,
670 /
= =
s rail
K K MN m.
The concrete properties used in the analysis are the specific weight, γc=25 kN / m2 and the Youngs modulus Ec =54.6 GPa . For the ballast, the specific weight γc=20 kN / m2 was con-sidered.
5 DYNAMIC RESPONSE DUE TO THE TRAIN PASSAGE
In this section we are going to analyze the vibration of the bridges due to the passage of real traffic considering the dynamic track models and compare it with the response obtained from the measurements. For the bridge 1 a locomotive type 1116 and an ICE train with seven vehi-cles were considered, for the bridge 8 a locomotive 1047 and finally for the bridge 12 a
locomo-tive 1116. As we said before, the speed of all this vehicles was considered constant and was measured independently with a speedometer when they passed on the bridges.
5.1 Bridge 1
The values of the first four natural frequencies of the finite element model of the bridge, 1
F =4.40 Hz, F2=13.70 Hz, F3 =16.00 Hz and F4 =28.75 Hz, are in good agreement with those from free vibration measurements, immediately after the train leaves the bridge, Rebelo (2005).
However, if larger amplitudes are considered, as it happens when the bridge is loaded during train passages, the agreement is poorer due to the non-linear behavior of the support flexural stiffness included in the model. Moreover, if the mass of the vehicles on the bridge is also taken into account, the first frequency will further decrease1.
In order to adjust the model parameters to the measured response during forced vibrations, and taking into account the conclusions above, a lower modulus of elasticity was considered,
c
E =40 GPa, corresponding to the first natural frequency of the bridge of approximately 4.0 Hz .
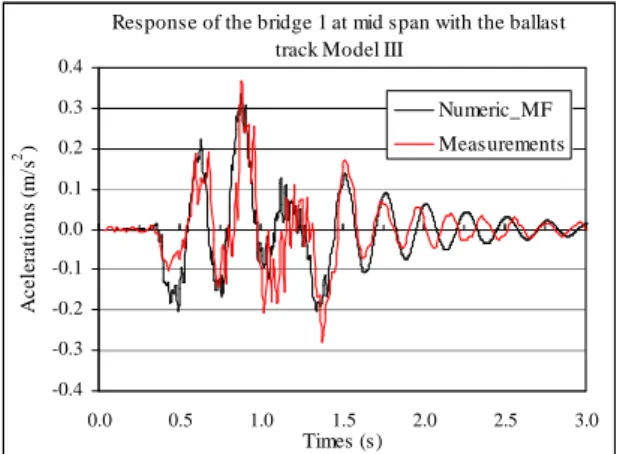
The locomotive data according the Figure 4-a) is D1=3.0 m , D2=6.9 m and the force corre-sponding to each axle is F1=210.925 kN . The speed of the locomotive was 130 km h/ . The Figure 8 compares the computed and measured accelerations of the bridge 1 during the passage of the locomotive 1116, the dynamic ballast track Model III with the moving load model were considered.
Response of the bridge 1 at mid span with the ballast track Model III
-0.4 -0.3 -0.2 -0.1 0.0 0.1 0.2 0.3 0.4 0.0 0.5 1.0 1.5 2.0 2.5 3.0 Times (s) A c e le ra ti o n s (m /s 2 ) Numeric_MF Measurements
Figure 8. Comparison between numeric and measurement acceleration response of the bridge 1 during the passage of the locomotive 1116.
Analyzing the evolution of the time histories, it is obvious that, during the passage of the lo-comotive, the numeric response fit the measurements quite well, but, after that, for free vibra-tions only the amplitudes are similar. This is due to the increasing flexural stiffness at the sup-ports for lower vibrations amplitudes.
Indeed, in the calculations the first natural frequency of the structure 4.0 Hz is considered to remain constant for the entire duration of the response. The measurements, however, revealed that for the initial time, up to about 1.4 s , when the locomotive is on the bridge, the first fre-quency match quite well the 4.0 Hz but, after the passage of the vehicle, an increase on the value of the frequency is observed, confirming that there is some influence of the vehicle mass and also that the stiffness increases for lower amplitudes of vibration. During the free vibra-tions the measured first frequency of the bridge increases to the above referred value of 4.4 Hz .
Concerning the damping, the 5% obtained from the measurements is used and corresponds to the amplitude variation that can be observed in the free vibration part of the time history.
1
When the mass of the locomotive type 1116 is included as a uniformly distributed structural mass, the decrease of the eigenfrequency is about 7%.
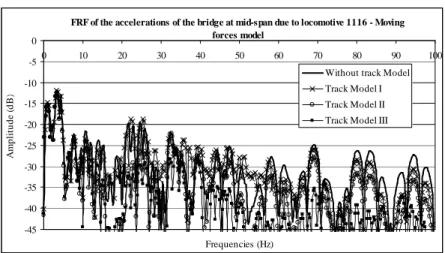
Since the results calculated for this bridge considering the others track models are very simi-lar only the comparison between the measured and the computed acceleration at the mid-span of the bridge 1 with the track Model III is represented in Figure 8. But in the frequency domain representation (Figure 9) it can be seen that each track model influence differently the accelera-tion response of the bridge. The three track models have the same contribuaccelera-tion in the frequency range from 0Hz to 20Hz and all the different track models dumps efficiently the higher fre-quencies. For the frequencies above of 20Hz it can be seen that the track Model I and track Model II have the same behaviour. The track Model III is the most efficient on efficient in fil-tering the higher frequencies.
Unlike the case of the ICE analyzed here after, the values of the stiffness and damping of the primary suspension of the locomotive are not known. Therefore no comparison between the numerical results, using interaction, and the measurements is presented.
FRF of the accelerations of the bridge at mid-span due to locomotive 1116 - Moving forces model -45 -40 -35 -30 -25 -20 -15 -10 -5 0 0 10 20 30 40 50 60 70 80 90 100 Frequencies (Hz) A m p li tu d e ( d B )
Without track Model Track Model I Track Model II Track Model III
Figure 9. Frequency domain representation of the response acceleration of the bridge 1 at the mid-span due to the passage of a locomotive 1116 with and without the track models.
The available measurements include the acceleration response to the passage of the ICE train with seven vehicles, at a speed of 140.00 km h . The data for this train, according to Figure 4-/ a), is D1=2.50 m , D2=15.80 m and Dk=26.40 m . Concerning the forces applied through the axles, the power car is characterized by F=204.05 kN and the intermediates carriages by
=127.53 kN
F .
The Figure 10 compares the measured and the computed accelerations at the mid-span of the bridge using the track Model II and the moving load model, since the results in time domain ob-tained with the other two track models are quite similar only that comparison is presented. As we can se the time histories from the numeric analysis fit quite well those from the measure-ments and the conclusions taken before for the passage of the locomotive 1116, are applicable here. The calculated amplitude variation in the free vibration part of the time history confirm that the value of 5% adopted for the first mode fit quite write.
Response of the bridge 1 at mid-span with the ballast track Model II -0.6 -0.5 -0.4 -0.3 -0.2 -0.1 0.0 0.1 0.2 0.3 0.4 0.5 0.6 0.0 1.0 2.0 3.0 4.0 5.0 6.0 7.0 Time (s) A cc e le ra ti o n s (m /s 2 ) Numeric_M F M easurements
Figure 10. Comparison between numeric and measurement acceleration response of the bridge 1 during the passage of the ICE549 train at the speed of 140km/h.
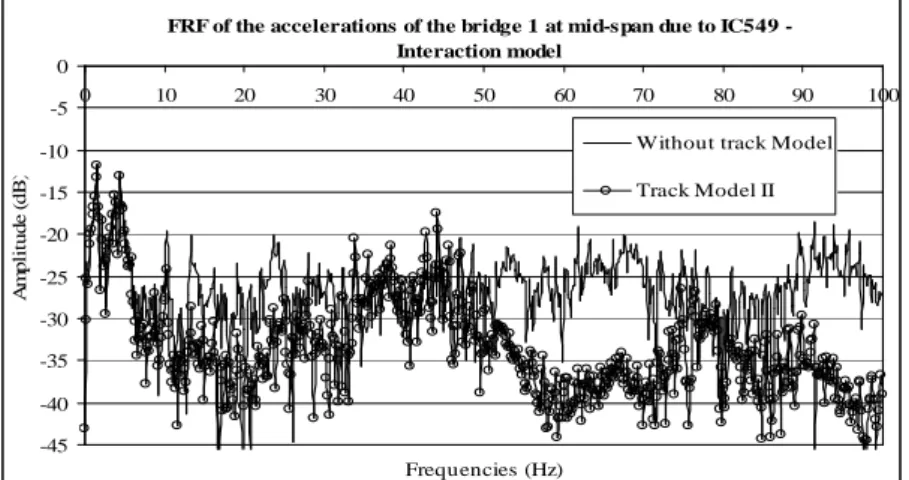
If the comparison is made in the frequency domain, it is concluded once again that all the three ballast track models have identical contributions in the range between 0 Hz and 20 Hz and reveal identical numerical dissipation of the higher frequencies. This behavior is amplified when the interaction between vehicle and bridge is applied and the participation of higher modes is introduced in the calculations. This becomes obvious in Figure 11 where the responses in the frequency domain without and with the track Model II are compared, since the results obtained with the other two track models are quite similar only that comparison is pre-sented.
FRF of the accelerations of the bridge 1 at mid-span due to IC549 - Interaction model -45 -40 -35 -30 -25 -20 -15 -10 -5 0 0 10 20 30 40 50 60 70 80 90 100 Frequencies (Hz) A m p li tu d e ( d B )
Without track Model Track Model II
Figure 11. Comparison in the frequency domain of the response of the bridge 1 when subject to the pas-sage of the ICE549 train at the speed of 140km/h without and with the track Model II and the interaction model.
5.2 Bridge 8
Once again an finite element model was developed attend to the stiffness of the bridges sup-ports, Figure 7. The values of the first three vertical natural frequencies of the 2D model of the bridge 8, F1=5.44 Hz , F2=17.74 Hz , F3=37.16 Hz , are in good agreement with those from free vibration measurements, immediately after the trains leaves the structure, Rebelo (2005).
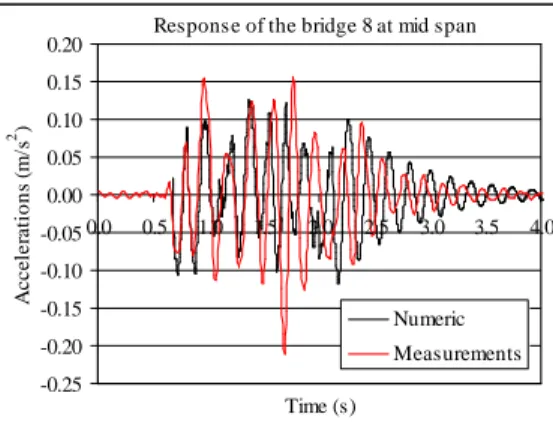
In this section we are going to analyze the vibration of the bridge 8, when a locomotive 1047 is passing. In this case only the moving loads model is used. The interaction load model could not be set up because the values for the vehicle parameters were not available. As the ballast track models have quite the same behaviour in the frequency domain, is only applied on the bal-last track Model III.
The locomotive data for the moving loads model, according to Figure 4-a), are D1=3.00 m ,
2=6.90
D m and the force corresponding to each axle is F=215.00 kN . The speed of the loco-motive is 85 k /m h .
Response of the bridge 8 at mid span
-0.25 -0.20 -0.15 -0.10 -0.05 0.00 0.05 0.10 0.15 0.20 0.0 0.5 1.0 1.5 2.0 2.5 3.0 3.5 4.0 Time (s) A c c e le ra ti o n s (m /s 2 ) Numeric Measurements
Figure 12. Comparison between numeric and measurement acceleration response of the bridge 8 during the passage of the locomotive 1047 considering the moving load model.
Analyzing the evolution of the time histories, it can be seen that for the first 1.2 s the nu-meric response fit the measurements quite well. Beyond that time all the axles of the locomo-tive are over the bridge and the first frequency of the viaduct decreases to 4.90 Hz . After the locomotive leaves the viaduct, 2.2 s , the frequency increases again and the amplitudes of the decay signal are similar.
This behavior confirms that there is a significant influence of the vehicle mass and of the non-linear increase of the stiffness for lower amplitudes of vibration. During the free vibrations the measured first frequency of the bridge increases to the above referred value 5.44 Hz .
Concerning the damping, the value obtained from the measurements, 5%, is used and corre-sponds to the amplitude variation that can be observed in the free vibration part of the time his-tory.
5.3 Bridge 12
The measurements confirmed an interaction between both twin slabs, revealing coupled modes with very close frequencies. They showed a duplication of the frequency peaks corresponding to symmetrical and non-symmetrical shapes with reference to the contact plan between the plates. Furthermore, the torsion of the decks is present in all mode shapes, Rebelo (2005).
The coupling effect allowed the quantification of the ballast shear stiffness, since the separa-tion between twin peaks only depends on that stiffness. The shear stiffness of the ballast
=35 MPa b
G , was obtained from the successive comparison of the measured pairs of natural frequencies with those computed in the finite element model when the stiffness of the connec-tion between both deck was varied. The Finite Element model developed for this viaduct is composed by the twin decks connected by vertical springs with G stiffness and by the sup-b ports showed in Figure 7. The values of the first four pairs of natural frequencies are given in Table 3. They are in good agreement with those obtained from the measurements.
Table 3. Eigen frequencies and mode types of the finite element model of bridge 12.
Mode Frequency (Hz) Mode Type 1st-2nd 13.03-15.94 Bending predominant 3rt-4th 26.39-34.30 Torsion predominant 5th-6th 44.20-44.92 Bending + torsion 7th-8th 57.46-60.20 Bending + torsion
In this section we are going to analyze the vibration of the viaduct 12, when a locomotive 1116 is passing, the interaction model could not be set up because the values of the vehicles
pa-rameters were not available, so only moving loads is applied. As the ballast track models have quite the same behaviour in the frequency domain, in this viaduct only is applied on the ballast track Model III.
The speed of the locomotive 1116 is 150 km h . It must be highlighted that the locomotive / passes over one of the twin decks and the measurements are performed on the other deck.
Response of the bridge 12 at mid span
-0.4 -0.3 -0.2 -0.1 0.0 0.1 0.2 0.3 0.4 0.0 0.3 0.5 0.8 1.0 1.3 1.5 1.8 2.0 Time (s) A c c e le ra ti o n s (m /s 2 ) Numeric M easurements
Figure 13. Comparison between numeric and measurement acceleration response of the bridge 12 during the passage of the locomotive 1116 on the other twin deck.
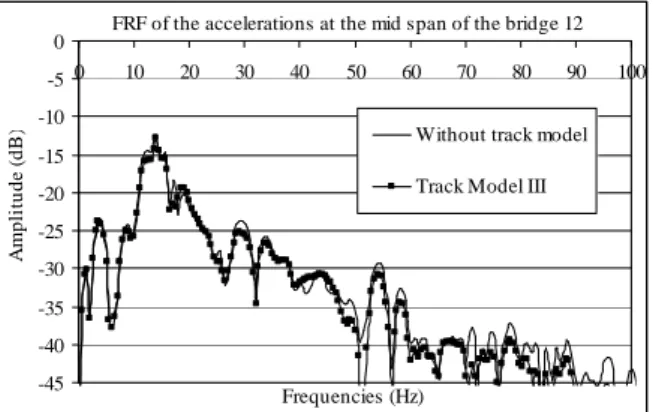
Analyzing the evolution of the time histories, it can be concluded that, during the passage of the locomotive, the numeric response obtained fits the measurement data quite well. Although some influence of the vehicle mass and of the non-linear effects on the supports can be ob-served, it is not that much obvious as it was in the other two viaducts. Comparing the response of the viaduct in the frequency domain, it can be seen that the track Model III act has a filter on the higher frequencies.
FRF of the accelerations at the mid span of the bridge 12
-45 -40 -35 -30 -25 -20 -15 -10 -5 0 0 10 20 30 40 50 60 70 80 90 100 Frequencies (Hz) A m p li tu d e ( d B
) Without track model
Track Model III
Figure 14. Comparison in the frequency domain of the response of the bridge 12 when subject to the pas-sage of a locomotive 1116 on the other twin deck considering moving load.
6 CONCLUSIONS
The main purpose of this paper is to present some results concerning the investigation on dy-namic response of small to medium span railway bridges using response accelerations data col-leted during an experimental program. A calibration of a structural element finite was done to confirm the parameters that influence the dynamic behavior of this kind of bridges, like for ex-ample: the non structural environment, the superstructure defined by the ballast track and the methodology applied for the load modeling.
The calibration performed using the response measurements on three bridges confirmed that the non linear effects at the supports and the variations of the mass during the passage of trains were responsible for the variation of the first natural frequency of these bridges. When the
bridges are loaded during the train passage the first frequency decreases about 7%. When the very low amplitudes of vibration of unloaded structures are used for the modal identification, instead of the higher amplitudes during the train passage, the first natural frequency increases about 20% to 30%, respectively for the bridge 8 and bridge 1.
The numerical responses of the bridges considering the system track/bridge or vehi-cle/track/bridge shows that the track models do not influence the acceleration response in the time domain. However in the frequency domain they show that the different dynamic track models acts as a filter in the high frequencies components. The analysis in the frequency do-main also permits to conclude that the use of the Wilson θ method in railway problems shows to be suitable in numerical dissipation of the spurious participation of the higher modes.
7 REFERENCES
− Bathe K.J. (1996): Finite element procedures, Prentice-Hall.
− Bathe K.J. (2007): Conserving energy and momentum in nonlinear dynamics:A simple im-plicit time integration scheme, Computers & Structures 85 437-445.
− EN1991-2 (2003): Actions on structures – Part 2: General actions – Traffic loads on Bridges. European Committee for Standardization, CEN.
− EN1990 – prAnnex A2 (2002): Basis of structural design – Annex A2 – Application for bridges (Normative). European Committee for Standardization, CEN.
− ERRI D214/RP9 (1999): Rail bridges for speeds>200km/h - Final Report, European Rail Research Institute, ERRI.
− Fryba L. (1999): Vibration of solids and strctures under moving load, (3rd edition), Thomas Telford, London.
− Hughes J.R.T. (2000): The finite element method, Linear static and dynamic finite element analysis, Dover publications, Inc. Mineola, New York.
− Knothe K., Grassie S.L., (1993): “Modelling of railway track and vehicle/track interaction at high frequencies”, Vehicle System Dynamic, 22 pp. 209-262
− Man A. (2004): A survey of dynamic railway properties and their quality, PhD Thesis, TU Delft, DUP – Science, Delft.
− Popp K., et al. (1999): “Vehicle track dynamics in the mid-frequency range, Vehicle System Dynamic, 31 pp. 423-464.
− Rebelo C., Pircher M., S. da Silva L. (2005): Vibrations measurements on existing single span concrete viaducts in Austria, EURODYN 2005, Paris, pp. 1637-1642.
− Rigueiro C., Rebelo C., S. da Silva L. (2006): Vibration of the railway track-viaduct system under moving vehicles taking to account the interaction effect, ISMA2006, pp. 1233-1248, Leuven.
− Yang Y. B., Yau J.D., Wu Y.S., (2004): Bridge interaction dynamics with applications to high-speed railway, World Scientific.
− Zhai M., Wang Y., Lin H. (2003): “Modelling and experiment of railway ballast vibration”, journal of Sound and Vibration, 270 pp. 673-683.