Submitted25 November 2015 Accepted 18 May 2016 Published15 June 2016
Corresponding author Nurul-Syakima Ab Mutalib, [email protected]
Academic editor Min Zhao
Additional Information and Declarations can be found on page 16
DOI10.7717/peerj.2119
Copyright 2016 Ab Mutalib et al.
Distributed under
Creative Commons CC-BY 4.0
OPEN ACCESS
Integrated microRNA, gene expression
and transcription factors signature in
papillary thyroid cancer with lymph node
metastasis
Nurul-Syakima Ab Mutalib1,*, Sri Noraima Othman1,*, Azliana Mohamad
Yusof1, Shahrun Niza Abdullah Suhaimi2, Rohaizak Muhammad2and
Rahman Jamal1
1UKM Medical Molecular Biology Institute, Universiti Kebangsaan Malaysia, Cheras, Kuala Lumpur, Malaysia 2Department of Surgery, Faculty of Medicine, Universiti Kebangsaan Malaysia, Cheras, Kuala Lumpur,
Malaysia
*These authors contributed equally to this work.
ABSTRACT
Background. Papillary thyroid carcinoma (PTC) is the commonest thyroid malignancy originating from the follicle cells in the thyroid. Despite a good overall prognosis, certain high-risk cases as in those with lymph node metastasis (LNM) have progressive disease and poorer prognosis. MicroRNAs are a class of non-protein-coding, 19–24 nucleotides single-stranded RNAs which regulate gene expression and these molecules have been shown to play a role in LNM. The integrated analysis of miRNAs and gene expression profiles together with transcription factors (TFs) has been shown to improve the identification of functional miRNA-target gene-TF relationships, providing a more complete view of molecular events underlying metastasis process.
Objectives. We reanalyzed The Cancer Genome Atlas (TCGA) datasets on PTC to identify differentially expressed miRNAs/genes in PTC patients with LNM-positive (LNM-P) versus lymph node negative (LNN) PTC patients and to investigate the miRNA-gene-TF regulatory circuit that regulate LNM in PTC.
Conclusion. We found evidence of five miRNAs differentially expressed in PTC LNM-P. Alteration in OxPhos pathway could be the central event in metastasis to the lymph node in PTC. We postulate that hsa-miR-301b might be involved in regulating LNM in PTC via interactions with HLF, HIF and REL/NFkB. To the best of our knowledge, the roles of these TFs have been studied in PTC but the precise role of this miRNA with these TFs in LNM in PTC has not been investigated.
SubjectsMolecular Biology, Oncology
Keywords Papillary thyroid carcinoma, Lymph node, MicroRNA, Gene expression
INTRODUCTION
Papillary thyroid carcinoma (PTC) is the most common malignancy originating from the thyroid. Although the prognosis of PTC is generally good with a high 5-year survival rate, cases demonstrating certain clinicopathological parameters are progressive, have poorer prognosis and are considered as high-risk (Ito et al.,2009). Numerous classification systems for thyroid carcinoma have been established in order to classify high-risk cases such as AMES (Cady & Rosai,1988), AGES (Hay et al.,1987), MACIS (Hay et al.,1993) as well as TNM (Sobin & Wittekind,2002;AJCC,2010). The TNM classification is the most recent classification system and is based on size and extrathyroid extension (T), lymph node involvement (N), distant metastasis (M) and patient’s age.
MicroRNAs (miRNAs), firstly identified in Caenorhabditis elegans, are a class of endogenous (non-protein-coding), 19–24 nucleotides single-stranded RNAs that derive from a stem-loop precursor to inhibit gene expression by binding primarily to the 3′-UTR of specific ‘target’ messenger RNA (mRNAs). MiRNAs that bind with perfect or nearly perfect complementarity to protein-coding mRNA sequences induce the RNA-mediated interference (RNAi) pathway, resulting in the disruption of mRNA stability and/or translation (Bartel,2009). Dysregulation of miRNAs expression in human cancers have been demonstrated by many studies (Iorio & Croce,2012). Through expression profiling studies, miRNAs were shown to be linked to tumor development, tumor progression, and response to treatment, signifying their potential use as biomarkers for diagnosis and prognosis (Iorio & Croce,2012). MiRNAs have also been shown function as biomarkers in predicting lymph node metastasis (LNM). There was a positive correlation between high hsa-miR-21 expression with tumor stage and LNM in patients with breast cancer (Yan et al.,2008), and the development of distant metastases in colorectal cancer patients (Slaby et al.,2007). Most recently, hsa-miR-1207-5p was suggested as a useful biomarker in the prediction of LNM in gastric cancer (Huang et al.,2015) and head and neck cancer (De Carvalho et al.,2015).
functional miRNA-target gene relationships (Nunez-Iglesias et al.,2010;Ma et al.,2011). As miRNAs act prevalently through degradation of the target genes, expression profiles of miRNA and target genes/transcripts are predicted to be inversely correlated (Bisognin et al.,2012). Another regulatory component, the transcription factors (TF), has also been shown to activate or repress miRNA expression level, further adding to the complexity of gene regulation. Efforts have been made to comprehend the mechanism of miRNAs in decreasing target genes expression; however the study of miRNA regulation by TFs (TF–miRNA regulation) is rather limited (Wang et al.,2010a).
The Cancer Genome Atlas (TCGA) Research Network recently published a molecular characterization of 507 PTCs and 59 matched normal adjacent tissues with respect to genomic, transcriptomic and proteomic signatures together with DNA methylation profiles, clinical and pathological features (Cancer Genome Atlas Research Network,2014). Data were collected through several studies across different institutions, thus creating a comprehensive dataset of PTC samples. Through unsupervised clustering methods, TCGA yielded six subtypes for miRNA expression and five for gene expression. However, miRNA and gene expression profiles between PTC with and without LNM were not comprehensively discussed. Here we reanalyzed these TCGA datasets on PTC with the aim of identifying differentially expressed miRNAs/genes in PTC patients with LNM-positive (LNM-P) as compared to lymph node negative (LNN) PTC patients and to investigate the miRNA-gene-TF regulatory circuit that governs LNM in PTC.
MATERIALS AND METHODS
TCGA papillary thyroid cancer dataset
We used the TCGA-generated microRNA sequencing (miRNAseq) and mRNAseq data for 495 tumors and 59 normal thyroid samples (Cancer Genome Atlas Research Network,2014). Metadata containing clinical information including BRAF V600E mutation status was obtained from cBioPortal (http://www.cbioportal.org/study.do?cancer_study_id=thca_ tcga_pub#clinical) while miRNAseq and mRNAseq of 507 PTC patients were obtained from the TCGA Data Portal (https://tcga-data.nci.nih.gov/tcga/dataAccessMatrix.htm) (accessed from March 27, 2015 to May 25, 2015). Information were available for 507 PTC patients. The list of patients from the metadata was then filtered for PTC patients with N0, N1, N1a, and N1b, resulting in a total of 421 PTC patients out of the 507 patients (86 patients were excluded due to unavailability of node status). The clinical parameters are presented inTable 1.
Table 1 Patient characteristics and integrated profiles in the TCGA PTC cohort.
Variables PTC LNN PTC LNM-P
N0 (n=213) N1 (n=53) N1a (n=86) N1b (n=66)
Age range (years) 15–85 19–83 18–83 19–89
Mean age 49.4 41.9 43.5 48.4
Gender (n)
Male 50 (23.5%) 14 (26.4%) 25 (29.1%) 27 (40.9%)
Female 163 (76.5%) 39 (73.6%) 61 (70.9%) 39 (59.1%)
Disease free status
Recurred/progressed 5 (2.3%) 7 (13.2%) 6 (7%) 6 (9.1%)
Disease free 178 (83.6%) 41 (77.4%) 75 (87.2%) 47 (71.2%)
Unknown 30 (14.1%) 5 (9.4%) 5 (5.8%) 13 (19.7%)
Disease free (range in months) 0.03–155 0–131 0–157 0.2 –46
Mean disease-free survival 23.6 (n=183) 34.5 (n=48) 21.5 (n=81) 13.5 (n=53) Overall survival status
Deceased 35 (16.4%) 12 (22.6%) 11 (12.8%) 19 (28.8%)
Alive 178 (83.6%) 41 (77.6%) 75 (87.2%) 47 (71.2%)
Overall survival (range in months) 0.03–155 0–131 0–157 0.2 –97.7
Mean overall survival 24.3 (n=182) 35.2 (n=43) 21.4 (n=75) 15.2 (n=50)
Extrathyroidal extension
None 160 (75.1%) 31 (58.5%) 49 (57%) 37 (56.1%)
Minimal (T3) 42 (19.7%) 14 (26.4%) 33 (38.4%) 23 (34.8%)
Moderate/advanced (T4a) 3 (1.4%) 5 (9.4%) 1 (1.2%) 4 (6.1%)
Very advanced (T4b) 0 (0%) 1 (1.9%) 0 (0%) 0 (0%)
Unknown 8 (3.8%) 2 (3.8%) 3 (3.5%) 2 (3%)
BRAF status
Mutated 94 (44.1%) 25 (47.2%) 53 (61.6%) 32 (48.9%)
Wild type 119 (55.9%) 28 (52.8%) 33 (38.4%) 34 (51.5%)
Survival analyses
Kaplan–Meier survival analysis was carried out on disease-free and overall survival duration of TCGA PTC patients for whom follow-up details were available. Overall survival is defined as the duration from the date of diagnosis to death (due to all causes) while disease-free survival is defined as the duration from the date of the diagnosis to the date of recurrence, second cancer, or death due to all causes (whichever occurred first) (Schvartz et al.,2012). Curves were compared by univariate (log-rank) analysis. Statistical analyses were performed using GraphPad Prism version 6 (GraphPad, San Diego, CA, USA).Pvalues≤0.05 were considered significant.
Clinical specimen and total RNA isolation
informed consent had been signed by these 10 subjects included in validation phase according to institution’s rules and regulations. All the slides were reviewed by the pathologist to assess the percentage of tumour cells and normal cells. Only tumour tissues which contain >80% cancer cells and normal tissues with <20% necrosis were subjected to nucleic acid extraction. Total RNA including miRNA was isolated from the frozen samples using AllPrep DNA/RNA/miRNA Isolation Kit (Qiagen, Hilden, Germany) according to the manufacturer’s protocol. The total RNA quality and quantity were assessed via absorbance spectrophotometry on a Nanodrop 1000 instrument (Thermo Scientific, Wilmington, DE, USA) and QubitTMfluorometer (Invitrogen, USA). Integrity of RNA was assessed using Eukaryote Total RNA Nano chip on Bioanalyzer 2100 (Agilent Technologies, Santa Clara, USA). Only total RNA with RNA Integrity Number (RIN) of at least 6 were used for subsequent steps. Eukaryote Small RNA chip (Agilent Technologies, Santa Clara, USA) was used for determination of concentration and percentage of small RNA.
Library preparation and next generation sequencing
MiRNA libraries were prepared using Illumina Truseq Small RNA library preparation kit (Illumina, SanDiego, USA) following manufacturer’s protocol. Briefly, 3′and 5′ adapters were sequentially ligated to the ends of small RNAs fractionated from 1µg of total RNA, and
reverse transcribed to generate cDNA. The cDNA was amplified using a common primer complementary to the 3′adapter, and a primer containing 1 of 48 index sequences. Samples were size-selected (145–160 bp fragments) on a 6% polyacrylamide gel, purified, quantified and pooled for multiplexed sequencing. The resulting pooled libraries were normalized to 2 nM and were hybridized to oligonucleotide-coated single-read flow cells for cluster generation using HiSeqR Rapid SR Cluster Kit v2 on Hiseq 2500. Subsequently the clustered pooled microRNA libraries were sequenced on the HiSeq 2500 for 50 sequencing cycles using HiSeqR Rapid SBS Kit v2 (50 Cycle). Base calling was performed using CASAVA (v.1.8.2) (Illumina, San Diego, CA, USA) and short-read sequences in FASTQ format were used for downstream analysis.
Bioinformatics analyses
The miRNASeq and RNASeq V2 level 3 data from TCGA were used exclusively. The normalised expression (reads per million or RPM) of all miRNAs was log2-transformed and
used for fold change calculation. The RNAseq by Expectation-Maximization (RSEM) values (from files with the extension .rsem.genes.results) were used to quantify messenger RNA (mRNA) expression levels. The RSEM algorithm is a statistical model that estimates RNA expression levels from RNA sequencing counts (Li & Dewey,2011). We then performed the Students’ unpaired t-test with a Benjamini Hochberg false discovery rate (FDR) multiple testing correction and log2fold change calculation using Bioconductor version
3.1 (BiocInstaller 1.18.2) (Gentleman et al., 2004) in R version 3.2.0 (R Development Core Team, 2008) (Files S1 andS2). Downregulated genes will have negative log2
values while upregulated genes will have positive log2 values. Statistical significance
created using Venn online tool (http://bioinformatics.psb.ugent.be/webtools/Venn). All other figures were created or labelled using Adobe Photoshop.
Analysis of the miRNAseq data from our in house experiment were performed using BaseSpace miRNA Analysis app version 1.0.0 (Illumina, San Diego, CA, USA) using the default setting. Briefly, adapters were trimmed using cutadapt, the trimmed reads were mapped on miRNA precursors using SHRiMPS aligner, the reads associated to mature miRNAs were counted and differential expression between experimental conditions were analysed using DESeq2 (Cordero et al.,2012). The expression, log2fold change and adjusted
p-value of hsa-miR-146b, hsa-miR-375, hsa-miR-31, hsa-miR-7-2 and hsa-miR-204 were then extracted from the overall results.
Pathway enrichment analysis and integrated analysis of miRNA and gene expression
The functions and pathways of the differentially expressed genes were annotated and analysed using the annotation tools from the Database for Annotation, Visualization and Integrated Discovery (DAVID) (Huang, Sherman & Lempicki,2009a;Huang, Sherman & Lempicki,2009b) according to the steps described in these publications. The identified genes were also jointly annotated against the Kyoto Encyclopedia of Genes and Genomes (KEGG) database (Kanehisa & Goto,2000). The genes that were annotated in the KEGG database as being involved in signaling pathways were subjected to further analysis. Pathways with Benjamini-adjustedpvalue≤0.05 were considered to be statistically significant.
Integration of the miRNAs dataset with gene expression dataset and calculation of correlation were performed in MAGIA2, a web tool for the integrated analysis of target pre-dictions, miRNA and gene expression data (Bisognin et al.,2012). MiRNA target predictions include transcription factor binding sites (TFBS) within miRNA and gene promoters. In this analysis, matched expression data matrices of significantly dysregulated miRNAs and genes (BH adjustedpvalue≤0.05) were uploaded for integrated analysis. EntrezGene IDs and DIANA-microT (Maragkakis et al.,2009) target prediction algorithms were selected. Anticorrelated expressions were investigated between miRNA and their putative target genes using Pearson correlation measure.
RESULTS
The effect of lymph node status on survival duration of TCGA PTC patients
Overall survival in PTC patients was not influenced by LNM status (Fig. 1A); however, PTC patients with LNM has significantly shorter disease-free survival rate compared to PTC patients without LNM (Log-rank Mantel Cox test,p=0.0049;Fig. 1B).
Differentially expressed miRNAs
Figure 1 Survival analysis of PTC with LNM and PTC without LNM.
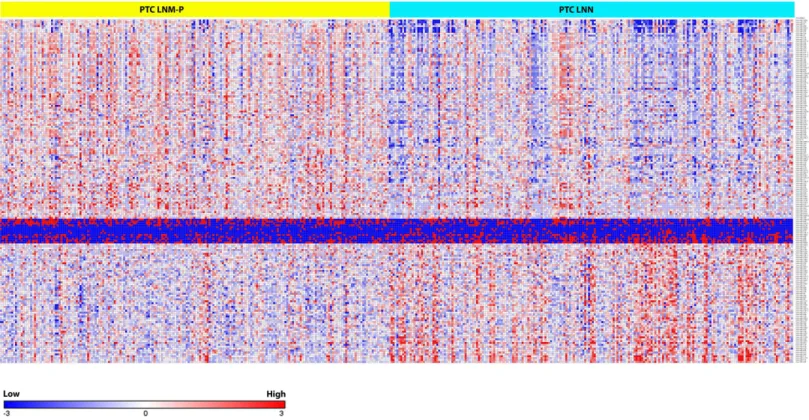
Figure 2 Heat map of the 181 differentially expressed miRNAs in PTC LNM-P and LNN (Student’sT-test with BH correctedpvalue≤0.05).
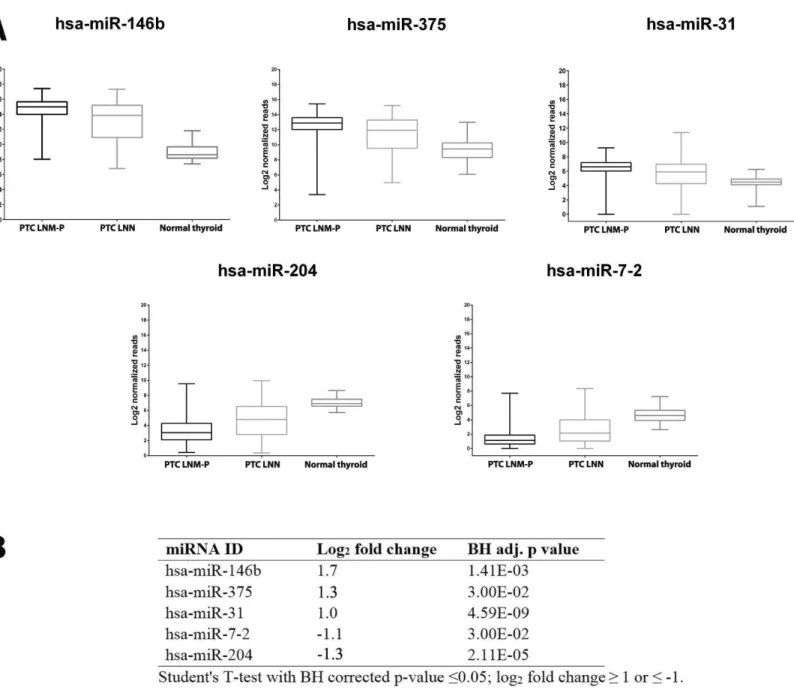
of 181 deregulated miRNAs in PTC LNM-P versus PTC LNN. The list of top deregulated miRNAs includes hsa-miR-146b, hsa-miR-375, hsa-miR-31, hsa-miR-7-2 and hsa-miR-204 (log2fold change 1.7, 1.3, 1,−1.1 and−1.3, respectively,Fig. 3). On the other hand, 395
Figure 3 Expression levels of five selected miRNAs deregulated in PTC.Boxplots (A) illustrate log2normalized miRNA reads in PTC LNM-P, PTC LNN and normal thyroid. Table (B) showing log2 fold change andpvalue of selected miRNAs in PTC LNM-P compared to PTC LNN.
We then determine the expression of these top deregulated miRNAs in a small set of validation experiment consisted of five pairs of tumour-adjacent normal from each PTC LNM-P and PTC LNN cases (total of 20 samples comprised of five PTC LNM-P, five PTC LNN and 10 adjacent normal thyroid tissues from each patient). As illustrated inFig. 3B, hsa-miR-146b was significantly upregulated in PTC LNM-P versus adjacent normal thyroid (log2fold change 6.0) and in PTC LNN versus adjacent normal thyroid
(log2fold change 4.7). Similar trends were observed for hsa-miR-375, hsa-miR-31 and
hsa-miR-204 in PTC LNM-P versus adjacent normal thyroid (log2 fold change 3.6, 3.1
versus adjacent normal thyroid did not reach statistical significance. On the other hand, expression of hsa-miR-375, hsa-miR-7-2 and hsa-miR-204 in PTC LNN versus adjacent normal thyroid were in concordance with our analysis using the TCGA data (log2fold
change 3.6,−2.3 and−2.7,Fig. 3B).
These findings did not deviate much from our analysis using the TCGA PTC data with the exception to hsa-miR-7-2 in PTC LNM-P versus adjacent normal thyroid and hsa-miR-31 in PTC LNN versus adjacent normal thyroid which failed to reach statistical significance (Table S2). This could be explained due to the fact that our validation samples were tumour-adjacent normal tissues while TCGA PTC specimens were of unpaired normal tissues. However, the differential expression of these five top deregulated miRNAs did not reach statistical significant when we compared between PTC LNM-P and PTC LNN (Fig. 3B). This might be due to small sample size in our validation study.
Differentially expressed genes
Initial filtering revealed 8,611 significantly deregulated genes in PTC LNM-P versus PTC LNN, 14,192 genes in PTC LNM-P versus normal thyroid and 13,392 genes in PTC LNN versus normal thyroid. There were 4,135 upregulated and 4,476 downregulated genes in PTC LNM-P relative to PTC LNN. By increasing the stringency of selection to genes with log2fold change ≥1 or ≤ −1, 407 genes were identified as strongly deregulated.
Among the strongly deregulated genes wereSFTPB,CLDN10,DIO1andMT1G(log2fold
change 3.1, 2.9,−2.2 and−2.5 respectively,Table S4). Various cancer-related genes were also differentially expressed significantly, includingBRAF,BRCA2,VEGFA,VEGFB,RET, PIK3CA,CTNNB1andGNAS(Table S4).
Enriched pathways in PTC LNM-P
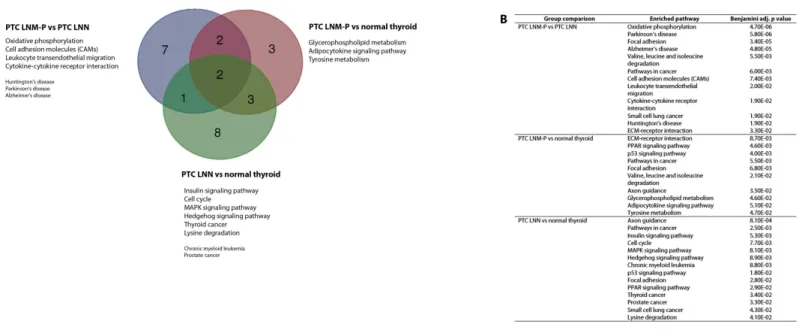
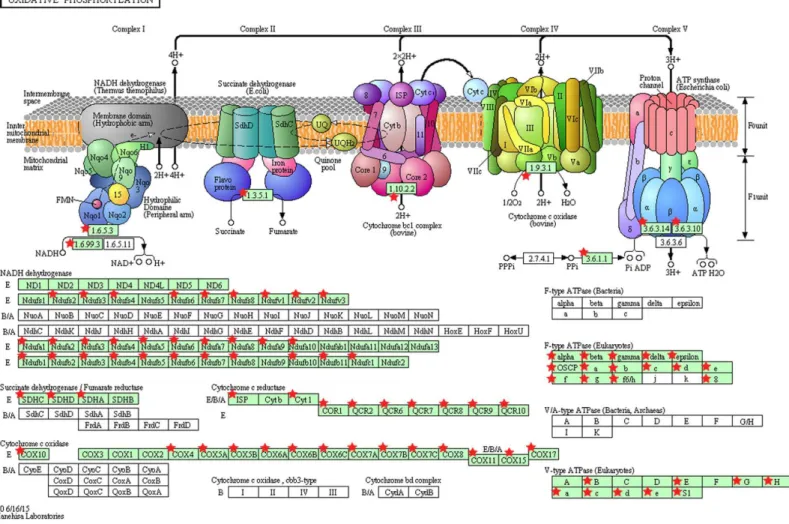
The significantly dysregulated genes in PTC LNM-P versus PTC LNN were mainly enriched in 12 KEGG pathways including oxidative phosphorylation (OxPhos), Parkinson’s disease, focal adhesion, Alzheimer’s disease, valine, leucine and isoleucine degradation, pathways in cancer, cell adhesion molecules (CAMs), leukocyte transendothelial migration, cytokine–cytokine receptor interaction, small cell lung cancer, Huntington’s disease and extracellular matrix receptor interaction (Fig. 4A). When we overlapped the results from the three comparison groups (PTC LNM-P versus PTC LNN, PTC LNM-P versus normal thyroid and PTC LNN versus normal thyroid), four unique pathways potentially involved in metastasis to the lymph nodes were significantly enriched, namely, oxidative phosphorylation (OxPhos), cell adhesion molecules (CAMs), leukocyte transendothelial migration and cytokine–cytokine receptor interaction pathways (Fig. 4A). The oxidative phosphorylation pathway was the most significantly perturbed (p=4.70E−06) with general downregulation of 90 OxPhos-related genes (Fig. 5). Focal adhesion and pathways in cancer were commonly enriched in all the three group comparisons. Pathways in cancer is a collection of general cancer-related pathways and is an indication that many essential carcinogenic processes may be under the influence of dysregulated miRNAs (Pizzini et al.,
Figure 4 Significantly enriched pathways in PTCs.Significant KEGG pathway associations to 8611 significantly deregulated genes in PTC LNM-P versus PTC LNN, 14,192 genes in PTC LNM-P versus normal thyroid and 13,392 genes in PTC LNN versus normal thyroid.
LNN and PTC LNM-P versus normal thyroid but were not enriched in PTC LNN versus normal thyroid (Fig. 4B).
Integrated mixed regulatory circuits, involving miRNAs, genes and TFs in PTC LNM-P
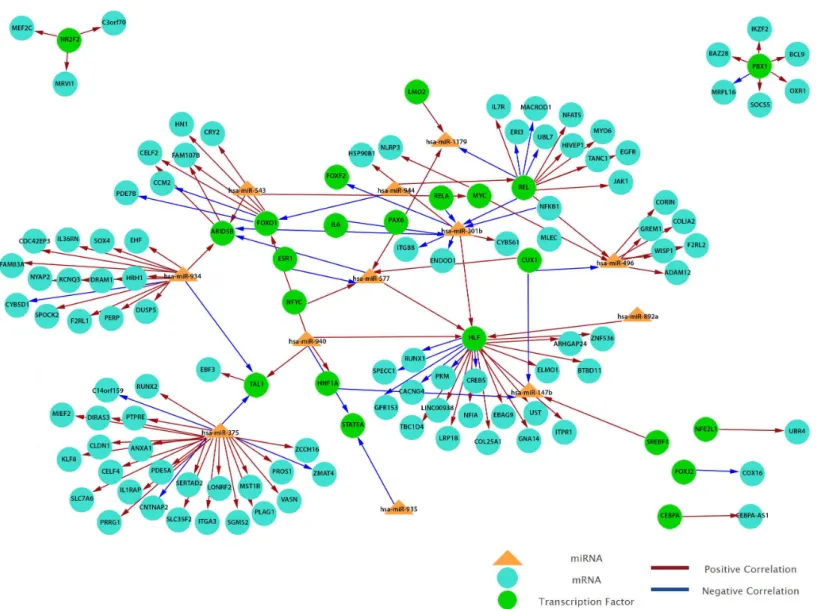
To obtain a more comprehensive insight into the molecular circuits behind LNM in PTC, we focused on functional miRNA-target relationships by performing anin silicointegration between differentially expressed miRNAs and genes using MAGIA2. Transcription factors-miRNA (TF-factors-miRNA) prediction was based on mirGen2.0 database (Friard et al.,2010) and TransmiR (Wang et al.,2010a), whereas the TF–gene interactions were acquired from the ‘TFBS conserved’ track of the University of California Santa Cruz (UCSC) genome annotation for humans (version hg19) (Bisognin et al.,2012). Our results show that 12 miRNAs are involved in the strongest 200 interactions and they were identified as significant by MAGIA2. Hsa-miR-147b, hsa-miR-301b, hsa-miR-375, hsa-miR-496, hsa-miR-543, hsa-miR-577, hsa-miR-765, hsa-miR-892a, hsa-miR-934, hsa-miR-935, hsa-miR-940 and hsa-miR-944 were predicted to activate or inhibit 3,746 genes and 1,987 TFs (Fig. 6). Hsa-miR-577 and hsa-miR-147b consistently appeared in the top 20 regulatory circuits across all group comparisons. Interestingly, hsa-miR-301b appeared in both of the top 20 circuits in PTC LNM-P versus PTC LNN or normal thyroid but was absent in PTC LNN versus normal thyroid (Fig. S3).
DISCUSSION
Figure 5 KEGG pathway map illustrating oxidative phosphorylation in human.The OxPhos-related genes significantly altered in PTC LNM-P compared to PTC LNN were depicted with red star. Pathway figure was obtained from KEGG (Kyoto Encyclopedia of Genes and Genomes) ( Kane-hisa & Goto,2000;Kanehisa et al.,2016) in DAVID analysis.
miRNAs in PTC LNM-P versus PTC LNN. The top deregulated miRNAs includes hsa-miR-146b, hsa-miR-375, hsa-miR-31, hsa-miR-7-2 and hsa-miR-204. Our findings are supported by several other similar studies, and in particular hsa-miR-146b, which was reported to be upregulated in PTC LNM-P versus PTC LNN (Lee et al.,2013;Yang et al.,
2013;Acibucu et al.,2014;Deng et al.,2015).
Figure 6 Grand view of top 200 regulatory circuits constructed using significantly dysregulated miRNAs and genes in PTC LNM-P compared to PTC LNN.
increased hsa-miR-146b expression is one of the independent risk factors for poor prognosis in PTC, implicating the potential of this miRNA as a prognostic marker.
The genes targeted by hsa-miR-146b are mostly unknown, and to date there are only two genes which has been reported as the direct targets of this miRNA in PTC.
Ring Finger 3 (ZNRF3) gene was revealed as a direct target of hsa-miR-146b-5p and this miRNA was shown to stimulate cell migration, invasion and epithelial-to-mesenchymal transition (EMT) by downregulating ZNRF3(Deng et al.,2015). Another study showed thatZNRF3inhibits Wnt signaling by interacting with FZD and LRP 5/6 complexes, hence promoting Wnt receptor ubiquitination and degradation (Hao et al.,2012). Hsa-miR-146b-5p increases the cell surface levels of FZD6 and LRP6 via suppression ofZNRF3, causing enhanced Wnt/β-catenin signaling. These findings revealed a novel mechanism of hsa-miR-146b-5p in mediating the induction of EMT and implied the role ofZNRF3as a tumor suppressor in PTC (Deng et al.,2015). Additional efforts to identify genes controlled by hsa-miR-146b associated with LNM will eventually revealed new biomarkers that can be utilized to correlate with disease outcome in PTC patients.
Hsa-miR-204 expression in PTC LNM-P is significantly lower than in PTC LNN. This is the first report showing the downregulation of hsa-miR-204 in PTC LNM-P. This miRNA was also downregulated in PTC compared to adjacent normal thyroid tissue and noncancerous thyroid (Swierniak et al.,2013). It is likely that hsa-miR-204 is downregulated in PTC compared to normal or benign thyroid disease and is further supressed when lymph node metastasis occurs. This miRNA is known as a tumor suppressor miRNA and is downregulated in various cancers including renal clear cell carcinoma (Gowrishankar et al.,
2014), minimal deviation adenocarcinoma (MDA) of uterine cervix (Lee et al.,2014) and breast cancer (Li et al.,2014). This miRNA has also been shown to have a prognostic value; low level of hsa-miR-204-5p expression was correlated with LNM, advanced stage and low survival rate in endometrial cancer (Bao et al.,2013), and also poor prognosis in colorectal cancer (Yin et al.,2014).In vitrofunctional analyses revealed the involvement of hsa-miR-204 in inhibiting the clonogenic growth, migration and invasion of endometrial carcinoma cells (Bao et al.,2013). In addition, restoration of hsa-miR-204-5p expression supressed cell proliferation, migration, invasion and induced apoptosis and chemotherapeutic sensitivity in colorectal cancer cell (Yin et al.,2014).
The validated targets for hsa-miR-204 in PTC are also not well-characterized. To date there is only one study investigating the functional role of hsa-miR-204 in PTC (Liu et al.,
2015). Enforced expression of hsa-miR-204-5p inhibited cell proliferation and induced apoptosis and cell cycle arrest in PTC cell lines (TCP-1 and BCPAP). In addition, hsa-miR-204-5p also inhibits PTC cell tumorigenicityin vivo(Liu et al.,2015). Bioinformatics prediction analyses using three algorithms (miRanda, Pictar, and TargetScan) revealed the insulin-like growth factor-binding protein 5 (IGFBP5), a gene playing an essential role in carcinogenesis (Beattie et al.,2006), as a potential target of hsa-miR-204-5p. Luciferase reporter assay confirmed the direct binding of hsa-miR-204-5p to the 3′ UTR ofIGFBP5
(Liu et al.,2015). In the same study, hsa-miR-204-5p andIGFBP5expression were also shown to be inversely correlated. Their findings confirmed the role of hsa-miR-204-5p as a tumor suppressor in PTC and revealed the potential use of this miRNA as a therapeutic agent in the treatment of PTC.
pathways. In addition, Lee and colleagues, (2015a)also showed that the expression of OxPhos gene sets was significantly lower in primary PTC than in matched normal thyroid tissue. Our findings revealed a similar trend with OxPhos genes being significantly downregulated in PTCs versus normal thyroid tissues as well as in PTC LNM-P versus PTC LNN. However, significant enrichment of OxPhos pathway was only observed in PTC LNM-P compared to PTC LNN. Alteration in metabolic processes has been considered as an indispensable component of malignant transformation (Lee et al.,2015a) thus the involvement of oxidative phosphorylation in LNM in PTC necessitates further investigation.
Oxidative phosphorylation is a process whereby an adenosine triphosphate (ATP) is produced as a result of electrons transfer from nicotinamide adenine dinucleotide (NADH) or flavin-adenine dinucleotide (FADH2) to oxygen by a series of electron carriers (Berg,
Tymoczko & Stryer,2002). The thyroid gland is an endocrine organ with a high energy consumption and oxidative processes are crucial for thyroid hormone synthesis (Lee et al.,
2015b). The mitochondria is responsible for providing 90% of the cellular energy necessary for various biological functions through oxidative phosphorylation and plays an important role in energy metabolism in the normal thyroid gland and in thyroid tumors (Kim et al.,
2012). The mitochondria is involved in many cell signaling pathways by playing crucial roles in apoptosis, cell proliferation and cellular Ca2+homeostasis (Rustin,2002). Mitochondrial
DNA (mtDNA) content was shown to be higher in PTC compared to the paired normal DNA and in normal controls (Mambo et al.,2005). Despite advancement in the elucidation of molecular events underlying thyroid carcinogenesis in the last decade, the function and nature of energy metabolism in thyroid cancer remain unclear (Lee et al.,2015b). In addition to oxidative phosphorylation, we also identified significant enrichment of other cancer-related pathways such as cell adhesion molecules (CAMs), leukocyte transendothelial migration and cytokine–cytokine receptor interaction pathways which were unique to PTC LNM-P versus PTC LNN. Interestingly, these pathways were not significantly enriched when PTCs (LNM-P and LNN) were compared to normal thyroid tissues. Taken together, it could be hypothesized that metastasis to the lymph node in PTC occurred via changes in the aforementioned pathways. However, some pathways in our analysis, such as valine, leucine and isoleucine degradation, could not be associated with oncogenesis or metastasis and may need further investigation.
Our integrated analysis revealed hsa-miR-301b’s presence in the top 20 circuits in both PTC LNM-P versus PTC LNN and PTC LNM-P versus normal thyroid but was absent in PTC LNN versus normal thyroid despite significant downregulation with modest fold change (log2fold change of−0.3). Hsa-miR-301 is located in the intronic region ofSKA2
control (Wang et al.,2010b). The inhibition of hsa-miR-301 decreased breast cancer cell proliferation, clonogenicity, migration, invasion, tamoxifen resistance, tumor growth and microvessel density, further establishing this miRNA as an oncomiR (Shi et al.,2011). FOXF2,BBC3,PTEN, andCOL2A1were confirmed as its direct targets through luciferase reporter assays (Shi et al.,2011).
Transcription factors (TFs) are a group of proteins involved in the initiation of transcription and are important for the regulation of genes. Majority of oncogenes and tumor suppressor genes encode the TFs (Ell & Kang, 2013). Dysregulation of oncogenic or tumor suppressive TFs could influence multiple steps of the metastasis cascade, leading to cancer progression (Ell & Kang, 2013). The involvement of TFs in PTC has been investigated since decades ago and several thyroid-specific TFs have been identified (Guazzi et al.,1990;
Fabbro et al.,1994). Most recently, the glioma-associated oncogene homolog 1 (GLI1) has been identified as a TF marker for LNM in PTC and it increases tumor aggressiveness via the Hedgehog signaling pathway (Lee et al.,2015c). The hepatic leukemia factor (HLF) is the only TF which appeared in the top 20 circuits of PTCs with or without LNM versus normal thyroid from our integrated analysis. On the other hand, REL was identified in the top 20 circuits only in PTC LNM-P in comparison to PTC LNN and will be discussed further in the following section.
The HLF is a transcription factor that facilitates thyroid hormone activation from the thyroid hormone receptor/retinoid X receptor heterodimer to hypoxia-inducible factor (HIF-1α) (Otto & Fandrey,2008). Triiodothyronine (T3) indirectly increases HIF-1α mRNA by increasing the expression of HLF, subsequently initiating the transcription of HIF-1α transcription factor (Burrows et al.,2011). HIF is another transcription factor which acts under hypoxia and thus is active in a number of diseases associated with low oxygen environment including cancer (Burrows et al.,2011). In fact, the HIF-1αprotein was differentially expressed in primary thyroid cancers associated with advanced stage; its expression was supressed in normal thyroid tissue and was highest in the most aggressive dedifferentiated anaplastic thyroid carcinomas (ATCs) (Hanada, Feng & Hemmings,2004), supporting its role for thyroid tumor aggressiveness, progression as well as metastasis. In addition, we also identified a significant involvement of REL/NFkB in lymph node metastasis of PTC which is in concordance with previously published data (Du et al.,2006).
ADDITIONAL INFORMATION AND DECLARATIONS
Funding
This manuscript was supported by the Fundamental Research Grant Scheme (FRGS) from the Ministry of Education Malaysia (FRGS/1/2014/SKK01/UKM/03/1). The funders had no role in study design, data collection and analysis, decision to publish, or preparation of the manuscript.
Grant Disclosures
The following grant information was disclosed by the authors:
Fundamental Research Grant Scheme (FRGS): FRGS/1/2014/SKK01/UKM/03/1.
Competing Interests
The authors declare that there are no competing interests.
Author Contributions
• Nurul-Syakima Ab Mutalib conceived and designed the experiments, performed the experiments, wrote the paper, prepared figures and/or tables.
• Sri Noraima Othman analyzed the data, contributed reagents/materials/analysis tools. • Azliana Mohamad Yusof analyzed the data.
• Shahrun Niza Abdullah Suhaimi, Rohaizak Muhammad and Rahman Jamal wrote the paper, reviewed drafts of the paper.
Human Ethics
The following information was supplied relating to ethical approvals (i.e., approving body and any reference numbers):
Universiti Kebangsaan Malaysia Research Ethics Committee (UKMREC).
Ethics
The following information was supplied relating to ethical approvals (i.e., approving body and any reference numbers):
Universiti Kebangsaan Malaysia Research Ethics Committee (UKMREC) (reference: UKM 1.5.3.5/244/UMBI-2015-002).
Data Availability
The following information was supplied regarding data availability:
The raw data generated from the validation study has been supplied asData S1.
Supplemental Information
REFERENCES
Acibucu F, Dökmetaş HS, Tutar Y, Elagoz S, Kilicli F. 2014.Correlations between the expression levels of microRNA146b, 221, 222 and p27Kip1 protein mRNA and the clinicopathologic parameters in papillary thyroid cancers.Experimental and Clinical Endocrinology & Diabetes122(3):137–143DOI 10.1055/s-0034-1367025.
AJCC. 2010. Thyroid. In: Edge SB, Byrd DR, Compton CC, Fritz AG, Greene FL, Trotti A, (eds.)AJCC cancer staging manual. 7th edition. New York: Springer, 87–96.
Alexiou P, Maragkakis M, Papadopoulos GL, Reczko M, Hatzigeorgiou AG. 2009.Lost in translation: an assessment and perspective for computational microRNA target identification.Bioinformatics25(23):3049–3055DOI 10.1093/bioinformatics/btp565.
Bao W, Wang HH, Tian FJ, He XY, Qiu MT, Wang JY, Zhang HJ, Wang LH1, Wan XP. 2013.A TrkB-STAT3-miR-204-5p regulatory circuitry controls prolifer-ation and invasion of endometrial carcinoma cells.Molecular Cancer12:155 DOI 10.1186/1476-4598-12-155.
Bartel DP. 2009.Micrornas: target recognition and regulatory functions.Cell
136(2):215–233DOI 10.1016/j.cell.2009.01.002.
Beattie J, Allan GJ, Lochrie JD, Flint DJ. 2006.Insulin-like growth factor-binding protein-5 (IGFBP-5): a critical member of the IGF axis.Biochemical Journal
395(1):1–19DOI 10.1042/BJ20060086.
Berg JM, Tymoczko JL, Stryer L. 2002.Biochemistry. 5th edition. New York: WH Freeman.
Bisognin A, Sales G, Coppe A, Bortoluzzi S, Romualdi C. 2012.MAGIA2: from miRNA
and genes expression data integrative analysis to microRNA-transcription factor mixed regulatory circuits (2012 update).Nucleic Acids Research40(Web Server issue):W12–W21DOI 10.1093/nar/gks460.
Burrows N, Babur M, Resch J, Williams KJ, Brabant G. 2011.Hypoxia-inducible factor in thyroid carcinoma.Journal of Thyroid Research2011:762905
DOI 10.4061/2011/762905.
Cady B, Rosai R. 1988.An expanded view of risk group definition in differentiated thyroid carcinoma.Surgery 104(6):947–953.
Cancer Genome Atlas Research Network. 2014.Integrated genomic characterization of papillary thyroid carcinoma.Cell159(3):676–690DOI 10.1016/j.cell.2014.09.050.
Cao G, Huang B, Liu Z, Zhang J, Xu H, Xia W, Li J, Li S, Chen L, Ding H, Zhao Q, Fan M, Shen B, Shao N. 2010.Intronic miR-301 feedback regulates its host gene, ska2, in A549 cells by targeting MEOX2 to affect ERK/CREB pathways.Biochemical and Bio-physical Research Communications396(4):978–982DOI 10.1016/j.bbrc.2010.05.037.
Chen YT, Kitabayashi N, Zhou XK, Fahey III TJ, Scognamiglio T. 2008.MicroRNA analysis as a potential diagnostic tool for papillary thyroid carcinoma.Modern Pathology21(9):1139–1146DOI 10.1038/modpathol.2008.105.
carcinomas with high risk features including extrathyroidal invasion and the BRAF(V600E) mutation.Thyroid20(5):489–494DOI 10.1089/thy.2009.0027.
Chou CK, Yang KD, Chou FF, Huang CC, Lan YW, Lee YF, Kang HY, Liu RT. 2013.Prognostic implications of miR-146b expression and its functional role in papillary thyroid carcinoma.Journal of Clinical Endocrinology and Metabolism
98(2):E196–E205DOI 10.1210/jc.2012-2666.
Cordero F, Beccuti M, Arigoni M, Donatelli S, Calogero RA. 2012.Optimizing a massive parallel sequencing workflow for quantitative miRNA expression analysis.PLoS ONE
7(2):e31630DOI 10.1371/journal.pone.0031630.
De Carvalho AC, Scapulatempo-Neto C, Maia DC, Evangelista AF, Morini MA, Car-valho AL, Vettore AL. 2015.Accuracy of microRNAs as markers for the detection of neck lymph node metastases in patients with head and neck squamous cell carcinoma.BMC Medicine13:108 DOI 10.1186/s12916-015-0350-3.
Deng X, Wu B, Xiao K, Kang J, Xie J, Zhang X, Fan Y. 2015.MiR-146b-5p pro-motes metastasis and induces epithelial-mesenchymal transition in thyroid cancer by targeting ZNRF3.Cellular Physiology and Biochemistry35(1):71–82 DOI 10.1159/000369676.
Du ZX, Zhang HY, Gao DX, Wang HQ, Li YJ, Liu GL. 2006.Significance of VEGF and NF-κB expression in thyroid carcinoma.Chinese Journal of Clinical Oncology
3:166–171DOI 10.1007/s11805-006-0112-2.
Ell B, Kang Y. 2013.Transcriptional control of cancer metastasis.Trends in Cell Biology
23(12):603–611DOI 10.1016/j.tcb.2013.06.001.
Fabbro D, Di Loreto C, Beltrami CA, Belfiore A, Di Lauro R, Damante G. 1994.
Expression of thyroid-specific transcription factors TTF-1 and PAX-8 in human thyroid neoplasms.Cancer Research54(17):4744–4749.
Fassina A, Cappellesso R, Simonato F, Siri M, Ventura L, Tosato F, Busund LT, Pelizzo MR, Fassan M. 2014.A 4-MicroRNA signature can discriminate primary lymphomas from anaplastic carcinomas in thyroid cytology smears.Cancer Cy-topathology122(4):274–281DOI 10.1002/cncy.21383.
Friard O, Re A, Taverna D, De Bortoli M, Corá D. 2010.CircuitsDB: a database of mixed microRNA/transcription factor feed-forward regulatory circuits in human and mouse.BMC Bioinformatics11:435DOI 10.1186/1471-2105-11-435.
Garzon R, Calin GA, Croce CM. 2009.MicroRNAs in cancer.Annual Review of Medicine
60:167–179DOI 10.1146/annurev.med.59.053006.104707.
Gentleman RC, Carey VJ, Bates DM, Bolstad B, Dettling M, Dudoit S, Ellis B, Gautier L, Ge Y, Gentry J, Hornik K, Hothorn T, Huber W, Iacus S, Irizarry R, Leisch F, Li C, Maechler M, Rossini AJ, Sawitzki G, Smith C, Smyth G, Tierney L, Yang JY, Zhang J. 2004.Bioconductor: open software development for computational biology and bioinformatics.Genome Biology5(10):R80DOI 10.1186/gb-2004-5-10-r80.
Geraldo MV, Yamashita AS, Kimura ET. 2012.MicroRNA miR-146b-5p regulates signal transduction of TGF-β by repressing SMAD4 in thyroid cancer.Oncogene
Gowrishankar B, Ibragimova I, Zhou Y, Slifker MJ, Devarajan K, Al-Saleem T, Uzzo RG, Cairns P. 2014.MicroRNA expression signatures of stage, grade, and progression in clear cell RCC.Cancer Biology & Therapy15(3):329–341 DOI 10.4161/cbt.27314.
Guazzi S, Price M, De Felice M, Damante G, Mattei MG, Di Lauro R. 1990.Thyroid nuclear factor 1 (TTF-1) contains a homeodomain and displays a novel DNA binding specificity.The EMBO Journal9(11):3631–3639.
Hanada M, Feng J, Hemmings BA. 2004.Structure, regulation and function of PKB/AKT–a major therapeutic target.Biochimica et Biophysica ACTA/General Subjects1697(1–2):3–16.
Hao HX, Xie Y, Zhang Y, Charlat O, Oster E, Avello M, Lei H, Mickanin C, Liu D, Ruffner H, Mao X, Ma Q, Zamponi R, Bouwmeester T, Finan PM, Kirschner MW, Porter JA, Serluca FC, Cong F. 2012.ZNRF3 promotes Wnt receptor turnover in an R-spondin-sensitive manner.Nature485(7397):195–200DOI 10.1038/nature11019.
Hay ID, Bergstrahl EJ, Goellner JR, Ebersold JR, Grant CS. 1993.Predicting outcome in papillary thyroid carcinoma: development of a reliable prognostic scoring system in a cohort of 1779 patients surgically treated at one institution during 1940 through 1989.Surgery114(6):1050–1057; discussion 1057–1058.
Hay ID, Grant CS, Taylor WF, MaConahey WM. 1987.Ipsilateral lobectomy versus bi-lateral lobar resection in papillary thyroid carcinoma: a retrospective analysis of sur-vical outcome using a novel prognostic scoring system.Surgery102(6):1088–1095.
He H, Jazdzewski K, Li W, Liyanarachchi S, Nagy R, Volinia S, Calin GA, Liu CG, Franssila K, Suster S, Kloos RT, Croce CM, De la Chapelle A. 2005.The role of microRNA genes in papillary thyroid carcinoma.Proceedings of the National Academy of Sciences of the United States of America102(52):19075–19080 DOI 10.1073/pnas.0509603102.
Huang KH, Lan YT, Fang WL, Chen JH, Lo SS, Li AF, Chiou SH, Wu CW, Shyr YM. 2015.The correlation between miRNA and lymph node metastasis in gastric cancer. BioMed Research International2015:543163DOI 10.1155/2015/543163.
Huang DW, Sherman BT, Lempicki RA. 2009a.Bioinformatics enrichment tools: paths toward the comprehensive functional analysis of large gene lists.Nucleic Acids Research37(1):1–13DOI 10.1093/nar/gkn923.
Huang DW, Sherman BT, Lempicki RA. 2009b.Systematic and integrative analysis of large gene lists using DAVID bioinformatics resources.Nature Protocols4(1):44–57 DOI 10.1038/nprot.2008.211.
Iorio MV, Croce CM. 2012.Microrna dysregulation in cancer: diagnostics, monitoring and therapeutics. A comprehensive review.EMBO Molecular Medicine4(3):143–159 DOI 10.1002/emmm.201100209.
Kanehisa M, Goto S. 2000.KEGG: Kyoto Encyclopedia of Genes and Genomes.Nucleic Acids Research28(1):27–30DOI 10.1093/nar/28.1.27.
Kanehisa M, Sato Y, Kawashima M, Furumichi M, Tanabe M. 2016.KEGG as a reference resource for gene and protein annotation.Nucleic Acids Research
44(D1):D457–D462DOI 10.1093/nar/gkv1070.
Kim SJ, Kwon MC, Ryu MJ, Chung HK, Tadi S, Kim YK, Kim JM, Lee SH, Park JH, Kweon GR, Ryu SW, Jo YS, Lee CH, Hatakeyama H, Goto Y, Yim YH, Chung J, Kong YY, Shong M. 2012.CRIF1 is essential for the synthesis and insertion of oxidative phosphorylation polypeptides in the mammalian mitochondrial membrane.Cell Metabolism16(2):274–283DOI 10.1016/j.cmet.2012.06.012.
Lee J, Chang JY, Kang YE, Yi S, Lee MH, Joung KH, Kim KS, Shong M. 2015b. Mi-tochondrial energy metabolism and thyroid cancers.Endocrinology Metabolism
30(2):117–123DOI 10.3803/EnM.2015.30.2.117.
Lee J, Jeong S, Lee CR, Ku CR, Kang SW, Jeong JJ, Nam KH, Shin DY, Chung WY, Lee EJ, Jo YS. 2015c.GLI1 transcription factor affects tumor aggres-siveness in patients with papillary thyroid cancers.Medicine94(25):e998 DOI 10.1097/MD.0000000000000998.
Lee H, Kim KR, Cho NH, Hong SR, Jeong H, Kwon SY, Park KH, An HJ, Kim TH, Kim I, Yoon HK, Suh KS, Min KO, Choi HJ, Park JY, Yoo CW, Lee YS, Lee HJ, Lee WS, Park CS, Lee Y. 2014.Gynecological pathology study group of the Korean society of pathologists. MicroRNA expression profiling and Notch1 and Notch2 expression in minimal deviation adenocarcinoma of uterine cervix.World Journal of Surgical Oncology12:334DOI 10.1186/1477-7819-12-334.
Lee J, Seol MY, Jeong S, Lee CR, Ku CR, Kang SW, Jeong JJ, Shin DY, Nam KH, Lee EJ, Chung WY, Jo YS. 2015a.A metabolic phenotype based on mitochondrial ribosomal protein expression as a predictor of lymph node metastasis in papillary thyroid carcinoma.Medicine94(2):e380DOI 10.1097/MD.0000000000000380.
Lee JC, Zhao JT, Clifton-Bligh RJ, Gill A, Gundara JS, Ip JC, Glover A, Sywak MS, Delbridge LW, Robinson BG, Sidhu SB. 2013.MicroRNA-222 and microRNA-146b are tissue and circulating biomarkers of recurrent papillary thyroid cancer.Cancer
119(24):4358–4365DOI 10.1002/cncr.28254.
Li B, Dewey CN. 2011.RSEM: accurate transcript quantification from RNA-Seq data with or without a reference genome.BMC Bioinformatics12:323 DOI 10.1186/1471-2105-12-323.
Li W, Jin X, Zhang Q, Zhang G, Deng X, Ma L. 2014.Decreased expression of miR-204 is associated with poor prognosis in patients with breast cancer.International Journal of Clinical and Experimental Pathology7(6):3287–3292. eCollection 2014.
Ma L, Huang Y, Zhu W, Zhou S, Zhou J, Zeng F, Liu X, Zhang Y, Yu J. 2011.An
integrated analysis of miRNA and mRNA expressions in non-small cell lung cancers. PLoS ONE6(10):e26502DOI 10.1371/journal.pone.0026502.
Mambo E, Chatterjee A, Xing M, Tallini G, Haugen BR, Yeung SC, Sukumar S, Sidransky D. 2005.Tumor-specific changes in mtDNA content in human cancer. International Journal of Cancer 116(6):920–924 DOI 10.1002/ijc.21110.
Maragkakis M, Reczko M, Simossis VA, Alexiou P, Papadopoulos GL, Dalamagas T, Giannopoulos G, Goumas G, Koukis E, Kourtis K, Vergoulis T, Koziris N, Sellis T, Tsanakas P, Hatzigeorgiou AG. 2009.DIANA-microT web server: elucidating microRNA functions through target prediction.Nucleic Acids Research37(Web Server issue):W273–W276DOI 10.1093/nar/gkp292.
Nilubol N, Sukchotrat C, Zhang L, He M, Kebebew E. 2011.Molecular pathways associated with mortality in papillary thyroid cancer.Surgery150(6):1023–1031 DOI 10.1016/j.surg.2011.09.021.
Nunez-Iglesias J, Liu CC, Morgan TE, Finch CE, Zhou XJ. 2010.Joint genome-wide profiling of miRNA and mRNA expression in Alzheimer’s disease cortex reveals altered miRNA regulation.PLoS ONE5(2):e8898
DOI 10.1371/journal.pone.0008898.
Otto T, Fandrey J. 2008.Thyroid hormone induces hypoxia-inducible factor 1alpha gene expression through thyroid hormone receptor beta/retinoid x receptor alpha-dependent activation of hepatic leukemia factor.Endocrinology
149(5):2241–2250DOI 10.1210/en.2007-1238.
Pallante P, Visone R, Ferracin M, Ferraro A, Berlingieri MT, Troncone G, Chiappetta G, Liu CG, Santoro M, Negrini M, Croce CM, Fusco A. 2006. Mi-croRNA deregulation in human thyroid papillary carcinomas.Endocrine-Related Cancer13(2):497–508DOI 10.1677/erc.1.01209.
Pizzini S, Bisognin A, Mandruzzato S, Biasiolo M, Facciolli A, Perilli L, Rossi E, Esposito G, Rugge M, Pilati P, Mocellin S, Nitti D, Bortoluzzi S, Zanovello P. 2013.Impact of microRNAs on regulatory networks and pathways in human colorectal carcinogenesis and development of metastasis.BMC Genomics14:589 DOI 10.1186/1471-2164-14-589.
R Development Core Team. 2008.R: a language and environment for statistical comput-ing. Vienna: R Foundation for Statistical Computing.Available athttps:// www.R-project.org.
Rossing M, Borup R, Henao R, Winther O, Vikesaa J, Niazi O, Godballe C, Krogdahl A, Glud M, Hjort-Sørensen C, Kiss K, Bennedbæk FN, Nielsen FC. 2012. Down-regulation of microRNAs controlling tumourigenic factors in follicular thyroid carcinoma.Journal of Molecular Endocrinology48(1):11–23
DOI 10.1530/JME-11-0039.
Rustin P. 2002.Mitochondria, from cell death to proliferation.Nature Genetics
30(4):352–353DOI 10.1038/ng0402-352.
overall survival of radioactive iodine in low-risk differentiated thyroid cancer patients.Journal of Clinical Endocrinology and Metabolism97(5):1526–1535 DOI 10.1210/jc.2011-2512.
Shi W, Gerster K, Alajez NM, Tsang J, Waldron L, Pintilie M, Hui AB, Sykes J, P’ng C, Miller N, McCready D, Fyles A, Liu FF. 2011.MicroRNA-301 mediates prolif-eration and invasion in human breast cancer.Cancer Research71(8):2926–2937 DOI 10.1158/0008-5472.CAN-10-3369.
Slaby O, Svoboda M, Fabian P, Smerdova T, Knoflickova D, Bednarikova M, Nenutil R, Vyzula R. 2007.Altered expression of miR-21, miR-31, miR-143 and miR-145 is related to clinicopathologic features of colorectal cancer.Oncology72(5–6):397–402 DOI 10.1159/000113489.
Sobin LH, Wittekind Ch (eds.) 2002.UICC: TNM classification of malignant tumors. 6th edition. New York: WileyLiss.
Sun Y, Yu S, Liu Y, Wang F, Liu Y, Xiao H. 2013.Expression of miRNAs in papillary thyroid carcinomas is associated with BRAF mutation and clinicopathological features in Chinese patients.International Journal of Endocrinology2013:128735 DOI 10.1155/2013/128735.
Swierniak M, Wojcicka A, Czetwertynska M, Stachlewska E, Maciag M, Wiechno W, Gornicka B, Bogdanska M, Koperski L, De la Chapelle A, Jazdzewski K. 2013.
In-depth characterization of the microRNA transcriptome in normal thyroid and papillary thyroid carcinoma.Journal of Clinical Endocrinology and Metabolism
98(8):E1401–E1409DOI 10.1210/jc.2013-1214.
Tetzlaff MT, Liu A, Xu X, Master SR, Baldwin DA, Tobias JW, Livolsi VA, Baloch ZW. 2007.Differential expression of miRNAs in papillary thyroid carcinoma compared to multinodular goiter using formalin fixed paraffin embedded tissues.Endocrine Pathology18(3):163–173DOI 10.1007/s12022-007-0023-7.
Wang J, Lu M, Qiu C, Cui Q. 2010a.TransmiR: a transcription factor–microRNA
regulation database.Nucleic Acids Research38:D119–D122DOI 10.1093/nar/gkp803.
Wang YX, Zhang XY, Zhang BF, Yang CQ, Chen XM, Gao HJ. 2010b.Initial study of microRNA expression profiles of colonic cancer without lymph node metastasis. Journal of Digestive Diseases11(1):50–54DOI 10.1111/j.1751-2980.2009.00413.x.
Wojtas B, Ferraz C, Stokowy T, Hauptmann S, Lange D, Dralle H, Musholt T, Jarzab B, Paschke R, Eszlinger M. 2014.Differential miRNA expression defines migration and reduced apoptosis in follicular thyroid carcinomas.Molecular and Cellular Endocrinology388(1–2):1–9DOI 10.1016/j.mce.2014.02.011.
Yan LX, Huang XF, Shao Q, Huang MY, Deng L, Wu QL, Zeng YX, Shao JY. 2008.
MicroRNA miR-21 overexpression in human breast cancer is associated with advanced clinical stage, lymph node metastasis and patient poor prognosis.RNA
14(11):2348–2360DOI 10.1261/rna.1034808.
Yin Y, Zhang B, Wang W, Fei B, Quan C, Zhang J, Song M, Bian Z, Wang Q, Ni S, Hu Y, Mao Y, Zhou L, Wang Y, Yu J, Du X, Hua D, Huang Z. 2014.miR-204-5p inhibits proliferation and invasion and enhances chemotherapeutic sensitivity of colorectal cancer cells by downregulating RAB22a.Clinical Cancer Research20(23):6187–6199 DOI 10.1158/1078-0432.CCR-14-1030.