Vol-7, Special Issue-Number5-July, 2016, pp888-896 http://www.bipublication.com
e Research Articl
The Effect of Seawater on the Interfacial Tension
:Smart Water Flooding
Reza Naeli1, 2,*, Ali Rahimi1,2 and Bizhan honarvar2 1- Young Researchers and Elite Club, Marvdasht Branch ,
Islamic Azad University, Marvdasht , Iran
2- Department Of Petroleum Engineering, Marvdasht Branch ,Islamic Azad University, Shiraz, Iran
*Corresponding author: Tel.: +989171025458 (mobile); Fax: +987143311172, ,
E-mail address: [email protected].
ABSTRACT
The first water flooding by smart water was accomplished in an experimental work in The University of Wyoming during 90s. One of way to achieve smart water is using seawater that by changing salt contents that exist in the seawater, smart water leads to an increase in the capillary number. The main subject of this paper is the effect of smart water on the interfacial tension (IFT) to increase oil recovery.
In this study the IFT of the sea water and oil was measured at different concentrations using Pendant drop method. So the effect of SO42- and Ca2+ ions and aging time on the IFT was investigated. The results show that there is an
optimum salinity point for sea water where in the lowest IFT and highest oil recovery was obtained. Ions available in seawater have different effect on the IFT. Also aging time affects properties between seawater and oil and cause reduction in IFT.
Key word: Interfacial tension, smart water, aging time, salinity
1. INTRODUCTION
The fluids of reservoirs drive into wells by hydraulic forces. However the power of this natural driving forces were decreased during production from the reservoir. As an example, Iranian reservoirs on average have 8-10 percent production and pressure drop annually. With continuous reservoir pressure drop, production rate decreased gradually as far as natural production of the reservoir has been stopped. Thus the amount of oil recovery for reservoirs was estimated about 15-20 percent, in the other words, 80 to 85 percent of total oil of the reservoir remained in the formation and also by using secondary methods (injection of water and gas) almost half of the oil was remained in the reservoir. Therefore for with drawing the remaining oils in the reservoir, new and advanced
techniques must be used that enhanced oil recovery (EOR) methods were used (Donaldson et al., 1985).
EOR is same as increasing the recovery factor of oil that is achieved by an increase in the recovery of original oil in place. Generally methods that change mechanisms of oil production and cause an increase in the production called EOR (Sheng, 2013). Thomas (2008) explained EOR as a defined process to reduce oil saturation below residual oil saturation. Recovery of remained oils due to capillary force and oils that are immobile or have little mobility due to high viscosity can be accomplished only by reducing their saturation below critical saturation.
capillary forces which is called capillary number and defined as follows:
(1)
Where in this relation µ and u are viscosity and velocity, respectively of the displacing fluid and σ IFT between displacing and displaced fluid that greater capillary number is needed to increase oil recovery. For different size distribution of pores in the core, capillary number in the range of 10-6 to 10-5 is suitable for water flooding. In EOR process for increasing viscosity of displaced fluid, polymer was used and to reduce IFT between two fluids, surfactant, alkaline and smart water were used (Ahmed and Meehan, 2011 ). One of the most important factors in EOR process is the costs of operation and injected fluid, for this reason according to the oil price use of the surfactant and alkaline is not often cost-effective but use of smart water flooding seems to be an appropriate method according to its low cost.
Smart water was said to an optimal salinity of water which cause an increase in oil recovery by alteration properties between oil, water and reservoir rock. The first water flooding by smart water was accomplished in an experimental work in The University of Wyoming during 90s. They study the effect of brine, oil and minerals on the IFT (Al-Attar, 2013). After them a lot of laboratory and field studies have been done in this area. In an experimental study Jadhunandan and Morrow (1995) showed that by water flooding in a very weakly water-wet (so called semi water-wet) reservoir, oil recovery carried out efficiently. Sea water and formation water are the two main sources for water injection into oil reservoirs which due to the costs and difficulties of using seawater in onshore reservoirs, it is almost used in offshore reservoirs. Generally, salinity classifies by geologists into three categories:
1. Slightly saline water - From 1,000 ppm to 3,000 ppm
2. Moderately saline water - From 3,000 ppm to 10,000 ppm
3. Highly saline water - From 10,000 ppm to 35,000 ppm
to the inside of the surface and has a tendency to reduce the area of the interface (Kumar, 2012). Gibbs stated a relation to calculate changes in IFT and change in chemical activity of the components in the solution, which is defined as follow in a binary system with changes from vapor phase to solution phase:
(2)
Where C is concentration of special surface-active solution, Г stands for the surface excess concentration, R presents the universal gas
constant, T denotes temperature and is the change in IFT that according to negative sign in the relation, surface excess concentration must be positive until IFT changes become negative and by reduction of interfacial tension, capillary number increased. For example surface excess concentration is positive in surfactant solutions (Hiemenz and Rajagopalan, 1997).
Moeini et al. (2014) studied the effect of sodium chloride and calcium chloride on the IFT between oil and water. They found that IFT increased as concentration of salt increased. Also in the following of their research about the effect of temperature and pressure on the IFT, they observed that by increase temperature and reduction of pressure, IFT decreased. Vijapurapu and Rao (2004) studied the effect of brine dilution and surfactant addition on spreading and adhesion behavior of crude oil on dolomite surfaces and concluded that interfacial tension initially decreased as the volume of brine in the mixture decreased but IFT increased with further dilution of reservoir brine with deionized water. Xu (2005) Measured IFT between oil and water by changing percentage of brine salinity. He used five different system include: deionized water, calcium chloride brine, sodium chloride brine, formation water and solution of 50% formation water and 50% deionized water and concluded that calcium chloride solution has a higher equilibrium IFT compared to other systems. Hirasaki et al. (1995) investigated the effect of temperature on the IFT
between oil and water and concluded that IFT decreased with increase temperature which this is due to movement of molecules in the fluid surface that this in itself reduces the surface free energy. In this study, the effects of salinity of seawater, Ca2+ and SO4
ions and aging time on the IFT were investigated. The pendent drop method was used for measuring the IFT between seawater and oil.
2. MATERIALAND METHODS
In this study, we use Experimental study.
2.1 Plant Material
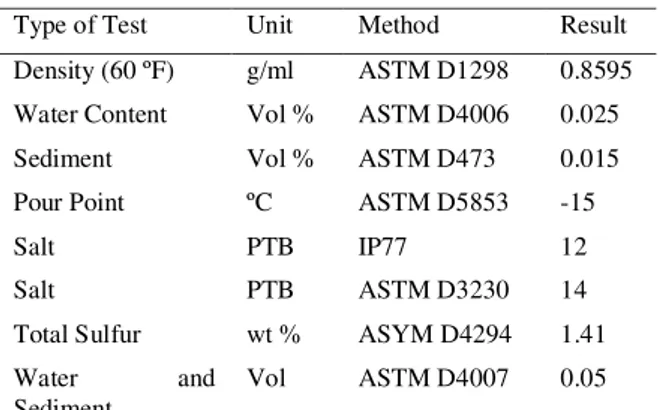
The oil used for the experiments was supplied from one of the oil reservoirs in south west of Iran with API of 33.13. Its properties are given in
Table 1. To study the effect of salts in the seawater on the IFT, sodium sulfate and calcium chloride at concentrations of 0 to 40000 ppm has been used in diluted solution of seawater which were provided from MERCK company of Germany with the purity of 99% wt. In all experiments Persian Gulf water has been used for the aqueous phase which analysis of seawater is shown in Table 2. Toluene and acetone were utilized for cleaning apparatus after any experiment and nitrogen gas was used after cleaning by toluene and acetone.
Table 1. Properties of oil in south west reservoir of Iran
Table 2. Salt content in Persian Gulf water.
Type of Salt Content (ppm)
Calcium 419
Magnesium 1304
Sodium 10710
Potassium 390
Type of Test Unit Method Result
Density (60 ºF) g/ml ASTM D1298 0.8595
Water Content Vol % ASTM D4006 0.025
Sediment Vol % ASTM D473 0.015
Pour Point ºC ASTM D5853 -15
Salt PTB IP77 12
Salt PTB ASTM D3230 14
Total Sulfur wt % ASYM D4294 1.41
Water and
Sediment
Bicarbonate 146
Sulfate 2690
Chloride 19350
Bromine 70
TDS 35079
2.2 Apparatus and methods 2.2.1 Density measurement
High-pressure and high-temperature pycnometer PY-R10 was used to measure the density. Density is used to measure IFT and has a significant effect on the drop analysis in the pendant drop method. After each measuring of density, distilled water was used to cleaning pycnometer. It also used to measure the density of seawater and aqueous solution. Acetone was utilized to cleaning oil phase. Nitrogen gas was used for cleaning and drying glass container. It flow into glass container and then glass container became dry and clean. Air in the aqueous phase causes error in the measurements that high heat was used to remove it.
2.2.2 IFT measurement
Pendant drop method is an appropriate method for measuring IFT because this method give a suitable picture from arrangement of aqueous phase with oil and compared to other methods of measuring IFT, this method is more appropriate. Oil drop comes out from inside of the base amongst volume of the fluid (aqueous phase) and drop located into the volume of brine. In static condition liquid drop shape controlled by balancing of gravity and surface forces. Gravity force trying to spreading drop on the base and surface force keeps the shape of drop spherical. According to gravity and surface forces, following relation is obtained to measure IFT which is the basis of drop analysis.
(3)
Where is Density difference between the two immiscible phase in gr/cm3, g is the acceleration due to gravity, de is the maximum horizontal
diameter in cm, H is the drop shape factor and is the IFT (Niederhauser and Bartell, 1947)
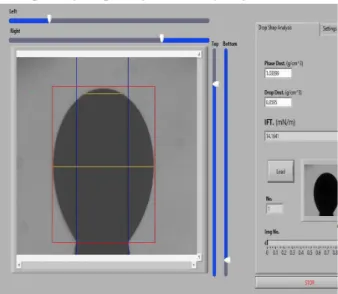
The IFT 400 instrument, supplied by Fars EOR Company, was used to determine IFT. The current instrument works at maximum operating temperature and pressure of 200 °C (with accuracy of 0.1 °C) and 3000 psi respectively and can measured liquid-liquid IFT in ambient and reservoir condition. The pendant drop method was used in this instrument by putting fluid sample into contact with fluid. System has a chamber with volume of 50 cm3 which made from stainless steel. Chamber has a sight glass area that provides the possibility of capturing image from drop by camera and thermodynamic changes of drop and fluid is visible by sight glass area. Also IFT force between fluid sample and fluid was determined through analyzing collected data by image analysis software which was coded by Lab view software. Method of drop analysis is shown in Fig 1. Measurement steps of interfacial tension using IFT 400 are as follows:
1. Full cleaning of the system before the test 2. Preparation of the drop injection basic for pendant drop method
3. Connecting camera and adjustment of the lens. 4. Ensure the tightness of all fittings and checking all valves
5. Pumping aqueous phase to the chamber and then injection of drop
6. Setting pressure and temperature of the system 7. Capturing drop image and analyzing it.
3. RESULTS
3.1 Density measurement of seawater
The density of seawater was measured at temperature of 80 °C and pressure of 14.7 psia for solutions with different concentrations of seawater. At each step of density measurement, first pycnometer was cleaned by the distilled water and then was dried and cleaned completely by nitrogen gas. The density of seawater in various concentrations was shown in Table 3. Table 3. density of seawater in various concentrations.
Seawater Concentration (%)
Density (gr/cm3)
pH
20 1.03582 7.93
40 1.04198 7.78
60 1.05075 7.72
80 1.05730 7.65
100 1.06362 7.5
3.2 Effect of seawater salinity
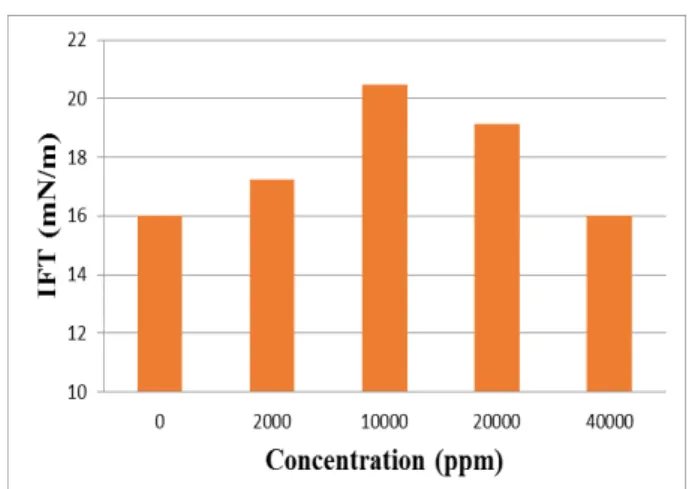
Seawater salinity influences properties of the film between oil and water and disturbs fluids equilibrium in reservoir, so it cause change in the surface charge (Adamson, and Gast, 1997). IFT between seawater and oil was measured in different concentrations. The IFT in different concentrations of seawater (by diluting using distilled water ) was measured, which all measurements were done at temperature and pressure of 80 °C and 14.7 psia respectively. In all experiments were allowed to the IFT to reach equilibrium during two minutes. Interfacial tension initially decreased as salinity of seawater increased and this trend was continued up to the salinity concentration of 20% seawater and then began to increase, that shown in Fig 2. IFT of 17.9422 mN/m was for distilled water which by increase salinity concentration to 20% seawater, IFT was decreased to 16.481 mN/m then IFT was increased to 20.9432 mN/m for solution with 100 % seawater. Therefore solution with concentration of 20% seawater was chosen as optimal salinity which can say that the biggest capillary number is at this point and it is expected that at this point maximum recovery of oil obtained but to
accurately investigate this issue needs to perform core flooding test.
Figure 2. Effect of seawater concentration on IFT at 80 ºC and 14.7 psia.
seawater and subsequently the surface excess concentration become negative and according to equation 2 IFT increased.
One of the other possible reasons for increase IFT is salting-out effect (RezaeiDoust et al., 2009). With increase salt concentration in aqueous phase, solubility of the organic phase decreased which causes IFT increased. Reducing salinity below Ionic strength critical point (optimal salinity) can increase the solubility of organic matter which this is due to salting-in effect. In concentrations below optimal salinity, the amount of salt in surface is not in such extent that prevents from presence of surface-active agent into oil in the surface. So the surface excess concentration of active agent is positive. In concentrations below optimal salinity, salts in the seawater move to the surface and therefor surface excess concentration of salt become positive and causes decrease in the IFT. Another reasons for increase IFT as salt concentration increased to salinities above optimum point is increase in the boiling point of water as salt concentration increased (by increase the amount of seawater) which by increase in the boiling point, molecular activity in the surface decreased and total entropy of system increased and therefore free energy of the system decreased and therefore the IFT decreased.
As a result, in optimal salinity (concentrations lower than 20%) lowest the IFT was obtained which result in the largest capillary number. Appropriate smart water at this condition (Temperature of 80 ° C and pressure of 14.7 psia) was in the concentration of 20% seawater which predicted that at optimal salinity maximum oil recovery would be happened.
3.3 Effect of Ca2+ and SO4
ions
Ca2+ and SO4
ions exist naturally in the seawater that act as a potential on the reservoir rocks (chalk rocks) and influence properties of the film between seawater and oil. Also cause to disturb chemical equilibrium in the reservoir. In order to achieve appropriate smart water with lowest IFT between seawater and oil which cause to increase
recovery factor, Ca2+ and SO4
ions was added to water solution of 20% seawater at different concentrations to observe the effect of these ions on the IFT of the seawater.Ca2+ and SO42- ions were exist in seawater with concentrations of 429 ppm and 2690 ppm respectively. All the experiments were done at temperature and pressure of 80 °C and 14.7 psia respectively.
3.4 Effect of Ca2+ ion.
Figure 3. Effect of Ca2+ ion on IFT at 80 ºC and 14.7 psia.
3.5 Effect of SO4
ion
Similar to previous, seawater of 20% concentration was used to evaluate the effect of SO4
ion on the IFT .The initial concentration of SO42- ion in this solution was about 538 ppm and density was measured at all concentrations by high-pressure and high-temperature pycnometer. As shown in Fig 4, IFT initially increased by increase in concentration of SO4
from 15.9964 mN/m in seawater of 20% concentration to 20.4636 mN/m in SO4
concentration of 10000 ppm and then began to decline. The SO4
2-concentration of 10000 ppm in seawater can be considered as critical concentration however this is in terms of IFT effect and certainly cannot known as critical concentration and to evaluate the effect of SO4
ion on oil recovery, also the effects of SO4
ion on the rock must be study. At concentrations lower than the critical point, cations exist in the aqueous phase desire to move into the bulk of seawater and less move to the surface. Cations adsorb SO4
ions that exist in the surface and salt surface excess concentration become negative which cause increase in IFT. But in concentrations above critical point the amount of surface ion is at such extent which cannot adsorb negative ions and therefore the extra concentration of surface was become positive and by increase concentration of SO42- above the critical point, IFT decreased.
Figure 4. Effect of SO42- ion on IFT at 80 ºC and 14.7
psia.
As a result, initially increase in the concentration of the Ca2+ ions to the optimal concentration was lead to reduction in the IFT and then IFT increased that this result is in contrast with experiments of Al-Attar et al. because they observed fluctuation in the interfacial tension with increase in concentration of the Ca2+ ion. Increase in the concentration of SO4
ion up to critical concentration was lead to increase in the interfacial tension and then in the concentration above the critical point interfacial tension began to reduce that this is similar to results of Al-Attar et al. (2013) which observed Increase in the IFT by increase in concentration of the SO4
ion (at low concentrations).
3.6 Effect of aging time
Properties of film between seawater and oil changes with time. Measurement of IFT with time is a dynamic test. Mass and heat transfer was took place at the surface between oil and seawater. Almost the IFT change was used in the surfactant flooding process but film between seawater and oil was changed due to ions in seawater.
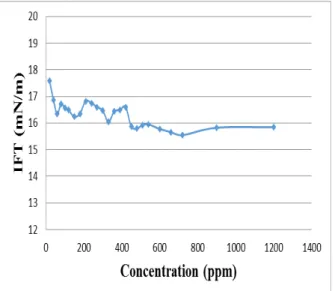
subjected to fluctuation, which as viewed in Fig 5
IFT reached to equilibrium in two times. First interfacial tension equilibrated approximately in 16.71 mN/m and in the second step equilibrated in 15.862 mN/m which with averaging equilibrium point can be assumed 16.286 mN/m. This value does not have much difference with primary assumption in time of 2 minutes.
Figure 5. Effect of aging time on IFT in sea water concentration of 20%.
IFT decreases with time. From view of “Dynamic Adsorption Models”, interfacial tension was reduced due to molecular displacement between surface and subsurface layer and Molecular exchange between the subsurface layer and solution bulk, but this view does not give a fair picture of reduction in the IFT graph with time, so can said that this is not a true assumption. According to reduction of IFT with sharp dip in initial steps until the initial equilibrium time and reduction of IFT with slow dip in times more than 400 seconds, this trend is more look like “Diffusion-Controlled Adsorption Models” because in this model assumed that there is no barrier between sub-surface and surface layer to molecular adsorption and molecular adsorption happened quickly but between subsurface layer and solution bulk is a barrier to molecular diffusion.
4. DISCUSSION
1. The lowest IFT between seawater and oil was achieved in concentration of 20% seawater which this point is optimal salinity. Therefore in this point maximum capillary number was obtained.
2. IFT initially decreased as the concentration of Ca2+ ions increased to optimal point of 2000 ppm then interfacial tension increased.
3. The effect of SO4
ion on the interfacial tension will not be positive and cause interfacial tension increased as concentration of SO42- ion increased up to the critical point. 4. With aging time, IFT reached to equilibrium
in two time stages of the system.
5. ACKNOWLEDGMENTS
Support of Faculties of Petroleum, Marvdasht Azad University is highly acknowledged. The authors wish to acknowledge Dr. Bizhan Honarvar.
6. REFERENCES
1. Ahmed, T. Meehan, D.N. (2011). Advanced Reservoir Management and Engineering (Chapter 6), Boulevard: Langford Lane, Kidlington, Oxford,
2. Abdel-Wali, A.A. ( 1996). Effect of Simple Polar Compounds and Salinity on Interfacial Tension and Wettability of Rock/Oil/Brine System. Journal of King Saul
University-Engineering Science, 8(2): 153-163.
3. Adamson, A.W. Gast, A.P. (1997). Physical Chemistry of Sciences. John Wiley & Sons, Inc. New York,
4. Agbalaka, C. C. Dandekar, A. Y. Patil, S. L. Khataniar, S and Hemsath, J. R. (2009). Core flooding Studies to Evaluate the Impact of Salinity and Wettability on Oil Recovery Efficiency. Transport in Porous Media, 76(1):77-94.
presentation SPE at the EAGE Annual Conference & Exhibition incorporating SPE Europec held in London, United Kingdom. 6. Alotaibi, M.B. Nasr-El-Din, H.A. (2009).
Chemistry of Injection Water and its Impact on Oil Recovery in Carbonate and Clastic Formation, Paper SPE 121565, presentation SPE at the SPE International Symposium on Oilfield Chemistry held in The Woodlands, Texas, USA,
7. Donaldson, E.C. Chilingarian, G.V and Yen, T.F. ( 1985). Enhanced Oil Recovery: Fumdumentals and analysis, Development in Petroleum Science, Elsevier, New York, 8. Green, D.W. and Willhite, G.P. (1998).
Enhanced Oil Recovery, SPE Textbook Series, Volume 6. Society of Petroleum Engineers, Richardson, Texas,
9. Hiemenz, P.C. and Rajagopalan, R. (1997). Principles of Colloid and Surface Chemistry. 3rd Edition, Marcel Dekker, New York, 10.Hirasaki, G.J. Zhang, D.L. (2004) Surface
chemistry of oil recovery from fractured, oil-wet, carbonate formations. SPE J., 151–162. 11.Jadhunandan, P. Morrow, N.R. (1995) Effect
of wettability on water flood recovery for crude oil/Brine/rock systems. SPERE, 10 (1), 40–46.
12.Kumar, B. (2012). Effect of Salinity on the Interfacial Tension of Model and Crude Oil Systems. Master thesis, University of Calgary, 13.Moeini, F, Hemmati-Sarapardeh, A,
Ghazanfari, M.H, Masihi, M, Ayatollahi, Sh. (2014). Toward mechanistic understanding of heavy crude oil/brine interfacial tension: The roles of salinity, temperature and pressure.
Fluid Phase Equilibria, 375: 191–200.
14.Niederhauser, D.O. and Bartell, F.E. A. (1947). Corrected Table for Calculation of Boundary Tensions by Pendant Drop Method, Research on Occurrence and Recovery of Petroleum, A
Contribution from API Research Project, 27, 114-146.
15.RezaeiDoust, R., Puntervold, T., Strand, S., Austad, T. (2009). Smart water as wettability modifier in carbonate and sandstone: a discussion of similarities/ differences in the chemical mechanisms. Energy Fuels 23, 4479– 4485.
16.Sheng, j. (2013). Enhanced oil recovery field case studies. Waltham, MA: Gulf Professional Publishing,
17.Sheng, J.J. (2014). Critical review of low-salinity water flooding. Journal of Petroleum Science and Engineering, 120:216–224. 18.Thomas, S. (2008). Enhanced oil recovery an
overview. Oil & Gas Science and Technology Rev. 63 (1), 9–19.
19.Vijapurapu, C.S. and Rao D.N. (2004) Compositional Effects of Fluid on Spreading, Adhesion and Wettability in Porous Media, Colloids and Surfaces A: Physiochemical and Engineering Aspects, 241(1-3), 335-342. 20.Webb, K.J. Black, C.J.J. Edmonds, I.J.
(2005a). Low Salinity Oil Recovery: the Role of Reservoir Condition Corefloods. Paper presented at the 13th European Sympo-sium on Improved Oil Recovery. Budapest, 25–27. 21.Xu, W. (2005). Experimental Investigation of
Dynamic Interfacial Interactions at Reservoir conditions, MSc. Thesis, Louisiana, USA, 22.Zhang, Y. Morrow, N.R. (2006). Comparison
of Secondary and Tertiary Recovery with Change in Injection Brine Composition for Crude Oil/Sandstone Combinations. Paper SPE 99757 presented at the SPE/DOE Symposium on Oil Recovery. Tulsa, April,