Characterizing Task-Based OpenMP Programs
Ananya Muddukrishna1*, Peter A. Jonsson2, Mats Brorsson1,2
1KTH Royal Institute of Technology, Stockholm, Sweden,2SICS Swedish ICT, Stockholm, Sweden
Abstract
Programmers struggle to understand performance of task-based OpenMP programs since profiling tools only report thread-based performance. Performance tuning also requires task-based performance in order to balance per-task memory hierarchy utilization against exposed task parallelism. We provide a cost-effective method to extract detailed task-based performance information from OpenMP programs. We demonstrate the utility of our method by quickly diagnosing performance problems and characterizing exposed task par-allelism and per-task instruction profiles of benchmarks in the widely-used Barcelona OpenMP Tasks Suite. Programmers can tune performance faster and understand perfor-mance tradeoffs more effectively than existing tools by using our method to characterize task-based performance.
Introduction
OpenMP is a popular parallel programming API where programmers express logical units of parallelism which are scheduled on threads by a runtime system. Standardization, wide-spread compiler support and quick, incremental parallelization features are among the reasons behind the popularity of OpenMP. OpenMP 3.0 introduced tasks as an explicit notion of logical paral-lelism to simplify expressing irregular and nested paralparal-lelism in a composable manner [1].
However, the relative ease of expressing irregular and nested parallelism using tasks does not simplify solving performance problems in OpenMP. Exposing enough task parallelism to maximize memory hierarchy utilization while simultaneously minimizing parallelization over-heads is crucial for performance. Memory hierarchy utilization and parallelization overover-heads can be inferred using thread state performance provided by current state-of-the-art OpenMP tools [2–7]. Understanding task-based performance such as exposed task parallelism and exe-cution of per-task instances is a struggle since tools provide limited support for tasks, report primarily thread-centric performance and do not close the semantic gap between tasks and threads [4]. Only expert programmers are able to cope by probing the application to reveal tasks and wading through the parallelization mechanics of the compiler and the runtime sys-tem in order to manually infer task-based performance.
Moreover, improving program performance by balancing task parallelism with memory hi-erarchy utilization is an iterative process. Code and scheduling modifications alter task-based composition. The newly exposed task parallelism has to be re-understood tediously for each it-eration. The number of iterations spent in the performance tuning process varies depending on a11111
OPEN ACCESS
Citation:Muddukrishna A, Jonsson PA, Brorsson M (2015) Characterizing Task-Based OpenMP Programs. PLoS ONE 10(4): e0123545. doi:10.1371/ journal.pone.0123545
Academic Editor:Vince Grolmusz, Mathematical Institute, HUNGARY
Received:August 3, 2014
Accepted:March 4, 2015
Published:April 10, 2015
Copyright:© 2015 Muddukrishna et al. This is an open access article distributed under the terms of the
Creative Commons Attribution License, which permits unrestricted use, distribution, and reproduction in any medium, provided the original author and source are credited.
Data Availability Statement:All data files are available on the figshare database (http://dx.doi.org/ 10.6084/m9.figshare.1320712).
Funding:The work was funded by Artemis PaPP Project number 295440. The funder’s website is:
http://www.artemis-ia.eu/. The funders had no role in study design, data collection and analysis, decision to publish, or preparation of the manuscript.
programmer experience, but multiple iterations are typically necessary even for experienced programmers.
Even simple task-based programs are surprisingly difficult to debug. Consider the task-based Fibonacci program which spans a few lines of code and whose sequential execution is well under-stood. Parallel performance remains poor despite solving thread-based performance problems such as load imbalance and contention pointed out by tools. The root of the problem is ill-suited task granularity which tools do not point out. Programmers resort to expert help or understand task granularity by tedious code and system inspection. Lack of task-based performance informa-tion compounds debugging difficulty for complex programs and those without source code.
Tool support for directly understanding task-based performance eliminates the step of man-ual inference in debugging performance problems. The iterative balancing process can be short-circuited allowing programmers to test changes to their programs and immediately un-derstand the effects of the changes. Better tools help programmers regardless of their experi-ence—inexperienced programmers can begin to approach and understand performance issues and experienced programmers will identify and resolve performance issues faster.
Designing the necessary tool support is challenging since there is an inherent conflict be-tween performance of the tools and the quality of the information collected. We contribute with a tool design that provides rich task-based performance information at manageable costs. To obtain detailed task-performance, our tool combines binary instrumentation and hardware performance counter readings captured during task events. We demonstrate utility by using our tool to characterize architecture independent task-based performance of benchmarks in the Barcelona OpenMP Tasks Suite (BOTS) [8] in extensive detail. Our characterization pro-vides input sensitivity and similarity of BOTS benchmarks for the first time to aid benchmark development and task scheduling research in the OpenMP community. Furthermore, we dem-onstrate how task-based metrics can be used to diagnose performance problems in OpenMP programs quickly and more effectively than what is possible using thread-based metrics pro-vided by existing tools.
Our contributions are:
• We describe a simple automated method to extract task-based performance in OpenMP programs.
• We apply the method to produce an extensive, architecture independent characterization of task-based performance of BOTS [8].
• We demonstrate how task-based performance can be used to diagnose performance prob-lems quickly and understand performance tradeoffs in OpenMP programs.
Need For Task-based Performance Analysis
We demonstrate the usefulness of task-based performance analysis by providing a more de-tailed explanation of the Fibonacci problem mentioned in the Introduction section. The Fibo-nacci program we consider is part of BOTS. Despite its simplicity, BOTS FiboFibo-nacci requires an input calleddepth cutofffor performance. The depth cutoff controls the granularity of tasks and is commonly provided as the-xargument during program invocation. Since thread-based
performance measurements such as speedup and thread state durations do not show per-task granularities, programmers are forced to find the best performing depth cutoff by
manual tuning.
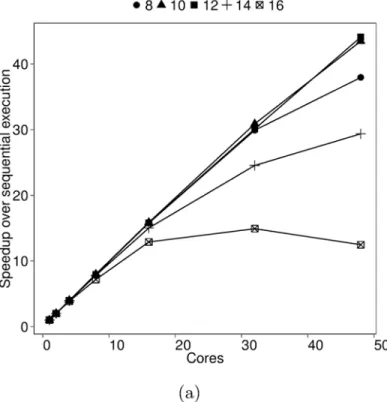
processors. Speedup measured during the tuning session is shown inFig 1a. We refer to the depth cutoff simply as cutoff through the remainder of the section. A cutoff of 12 gives the best performance. Choosing a proper cutoff is crucial for Fibonacci performance.
Let us investigate the sensitivity of Fibonacci performance to the cutoff value. Speedup mea-surements indicate the impact of cutoff on performance but cannot explain why. Thread state durations cannot adequately explain the cutoff performance either. We show trends in the av-erage time spent in different threads states inFig 1b. Performance is worst at cutoff 16 since threads spend more time in parallelization than in execution. However, lower cutoffs also per-form poorly despite good parallelization to execution time ratios. In addition, we cannot ex-plain why overall parallelization time is high. We use idle state time as a proxy indicator of load-balance to conclude that cutoff 12 provides the highest core utilization. However, we can-not determine the reason behind the uneven load. Also, the slight increase in execution time with cutoff is puzzling since work is constant (input n = 48) during tuning.
Speedup and thread state durations are thread-based metrics that are useful when program-mers use threads to compose programs. However, while composing task-based programs, pro-grammers think about tasks without concern for threads and scheduling. Thread-based metrics explain task-based program performance poorly since they fail to probe execution at the level of tasks understood by programmers. Yet thread-based metrics are the only support available from state-of-the-art performance analysis tools.
Lack of in-depth performance diagnosis support from existing tools encourages a culture of ignorance among programmers. Only expert programmers are able to probe deeper than tools and explain performance at the cost of manual probing time. When expert understanding is absent, manual tuning is the sole resort. Manual tuning suffers from combinatorial explosion for task-based programs that have more than one tuning parameter. A majority of BOTS benchmarks have multiple (up to four) cutoffs which expand tuning space to a huge and unmanageable extent.
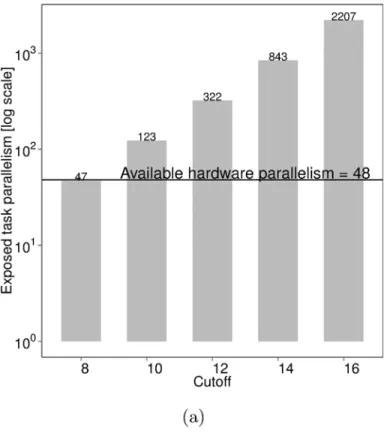
Task-based metrics can explain Fibonacci performance conclusively.Fig 2ashows exposed task parallelism for different cutoffs. Exposed task parallelism is a first-class task-based perfor-mance metric obtained from the shape of the task graph. We divide the total number of execu-tion cycles of all tasks by the number of execuexecu-tion cycles on the critical path of the task graph to infer exposed task parallelism, as per the method established by Cilk theory [9]. A cutoff value of 8 performs poorly since exposed task parallelism is less than the available hardware parallelism. We can conclude that higher cutoffs lead to more parallelism.
Per-tasktime, yet another first-class task-based performance metric, sheds further light on Fibonacci cutoff performance. Per-task time is obtained by measuring thread state time at the granularity of tasks and is shown inFig 2b. Increasing cutoff decreases both per-task execution and idle state time. Higher cutoffs lead to more fine-grained tasks in turn increasing paralleliza-tion costs. A cutoff of 16 creates many fine-grained tasks which take longer to parallelize than execute. Large-grained tasks limit parallelism at lower cutoffs despite low parallelization costs. The increasing execution state time inFig 1bcan now be blamed on a stressed runtime system and poor memory hierarchy utilization—a phenomenon calledwork time inflation[10].
Per-task time inFig 2bguides the choice of good cutoffs for Fibonacci. The performance sweet-spotis the intersection between the per-task idle trend line and the parallelization trend line. Parallelization cost is balanced with load-balancing at the sweet-spot. The intersection be-tween the per-task parallelization trend line and the execution trend line indicates where the runtime system has turned into a bottleneck.
Fig 1. Thread-based performance of BOTS Fibonacci.Input: n = 48, depth cutoff = {8,10,12,14,16}. Executed on 48 cores of a machine with four 12-core AMD Opteron 6172 processors running at highest frequency with frequency scaling turned off. The task scheduler used balances load using thread-private task queues and random work-stealing. (a) Speedup (b) Average number of processor cycles spent in thread states. Threads create and synchronize tasks in theparallelizationstate, execute tasks in thecomputation state and enter theidlestate when work cannot be found.
counts and point out load balance problems so they are excellent indicators of scalability. How-ever, they fail to show problems in exposed task parallelism and per-task execution solving which is crucial for based program performance. Therefore tools should provide task-based metrics in addition to those task-based on threads for meaningful and quick performance analysis of task-based programs.
Characterizing Task-based Performance
We describe an automated method to extract detailed task-based performance information from OpenMP programs at manageable costs in this section. We first classify task-based per-formance and provide background information on source translation and runtime system exe-cution of OpenMP tasks. Next, we explain the details of our performance extraction method.
Terminology
We consider independent (not derivable from one another) task-based performance metrics and classify them into one of:
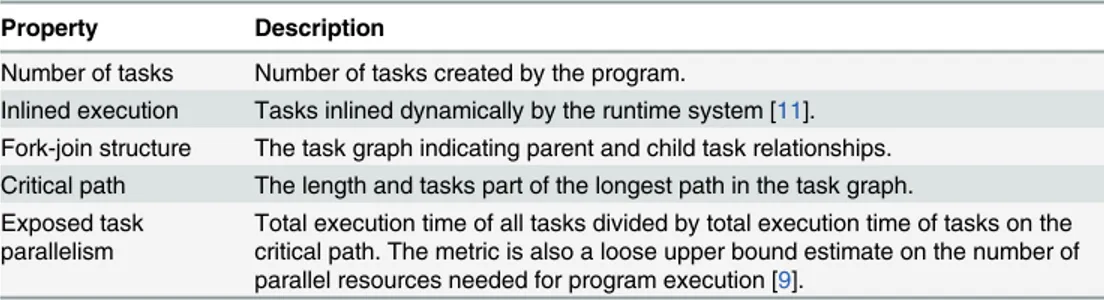
• Task graph propertiesdescribe the task-based composition of the program and are shown inTable 1. Task graph properties are typically architecture independent but can become ar-chitecture dependent in non-deterministic programs.
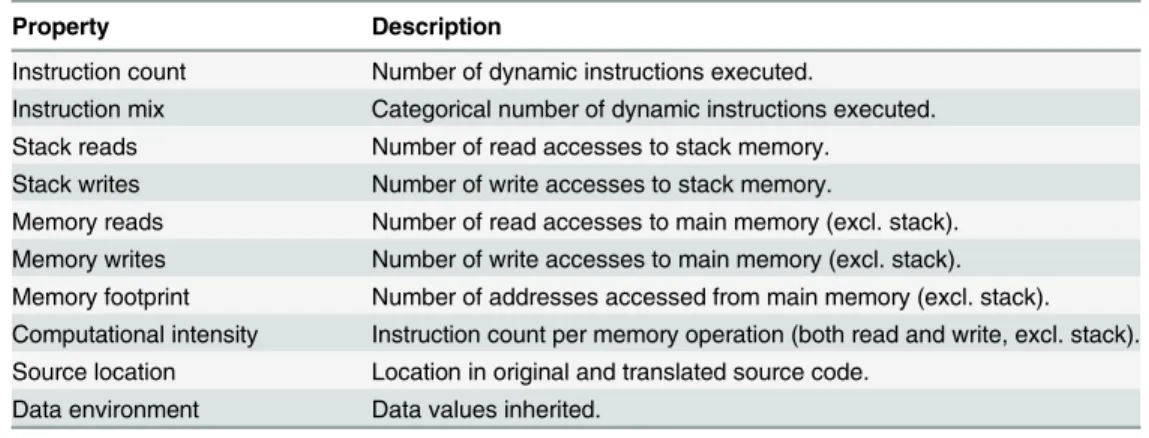
• Per-task propertiesdescribe individual tasks of the program and are shown inTable 2. Per-task properties allow the study of Per-tasks in isolation.
We focus on architecture independent task properties since our goal is to characterize task-based performance inherent in the program. However, our method also provides architecture dependent task properties such as per-task execution time and memory hierarchy statistics which are useful for performance analysis.
Note that we refer to code dependent, micro- and memory-architecture independent prop-erties as architecture independent per-task propprop-erties in the paper. We classify instruction count and instruction mix as architecture independent per-task properties inTable 2in a gen-eral sense although they are not independent of ISA.
line indicates the available 48-core hardware parallelism. (b) Average processor cyclesper taskspent in thread states. Threads create and synchronize tasks in theparallelizationstate, execute tasks in the computationstate and enter theidlestate when work cannot be found.
doi:10.1371/journal.pone.0123545.g002
Table 1. Task graph properties.
Property Description
Number of tasks Number of tasks created by the program.
Inlined execution Tasks inlined dynamically by the runtime system [11]. Fork-join structure The task graph indicating parent and child task relationships. Critical path The length and tasks part of the longest path in the task graph. Exposed task
parallelism Total execution time of all tasks divided by total execution time of tasks on thecritical path. The metric is also a loose upper bound estimate on the number of parallel resources needed for program execution [9].
Tasks in OpenMP are defined by surrounding code regions using thetaskstatement. OpenMP source translators typically handle task definitions by moving the surrounded code region into a named function and inserting an asynchronous call in its place. The named func-tion is called theoutline function. The asynchronous function call is made using thetask crea-tioninterface provided by the runtime system.
The runtime system assigns an unique identifier to each newly created task. The creating task is called theparentand the created task thechild. The point at which the child task is creat-ed is callcreat-ed aforkpoint in the execution of the parent task.
OpenMP tasks synchronize using thetaskwaitstatement. The parent task waits for all child tasks to finish execution during task synchronization. The point at which child tasks are syn-chronized is called ajoinpoint in the execution of the parent task. Source translators handle synchronization using thetask synchronizationinterface provided by the runtime system.
Extraction Method
The extraction method combines information from source translation, native compilation, runtime system task management, OS memory management, dynamic binary instrumentation, hardware performance counters and architectural topology to derive task-based performance information as shown inFig 3.
We extract task graph properties using task creation and synchronization information from the runtime system. Task identifiers, data environment and scheduling point timestamps are recorded during extraction.
We extract per-task properties by uniquely identifying task instances and recording instruc-tions and hardware performance counters during task execution.
Tracking task instances. We use a contextual stack-based approach to track task execu-tion. A new context is created when a task begins execuexecu-tion. The previous context is pushed on the stack and the newly created context is set as current. All profiling costs are attributed to the current context. The context on the stack is restored when the current task finishes execution.
Our approach to track task execution is simple to implement and requires two things. Inlin-ing calls to the task outline function durInlin-ing compilation must be disabled to correctly distin-guish task contexts. Disabling inlining preserves the profiled task properties. Second, costs of dynamically inlined tasks [11] must be transferred to the parent context in a post-profiling step since inlined tasks appear as real tasks to the profiler.
Table 2. Architecture independent per-task properties.
Property Description
Instruction count Number of dynamic instructions executed.
Instruction mix Categorical number of dynamic instructions executed. Stack reads Number of read accesses to stack memory.
Stack writes Number of write accesses to stack memory.
Memory reads Number of read accesses to main memory (excl. stack). Memory writes Number of write accesses to main memory (excl. stack). Memory footprint Number of addresses accessed from main memory (excl. stack). Computational intensity Instruction count per memory operation (both read and write, excl. stack). Source location Location in original and translated source code.
Data environment Data values inherited.
Obtaining per-task properties. We obtain per-task instructions using dynamic binary in-strumentation. We obtain per-task execution and memory hierarchy performance by capturing hardware performance counter values at task execution boundaries. Code executed within out-line functions including nested user-level function calls are included while counting perfor-mance. Runtime system function calls made from the task context are excluded to avoid misattribution of parallelization activity to task execution. We link executing tasks to source code using compilation information (Example: AST using GCC option -fdump-tree-optimized).
Note that we minimize performance skewing by collect binary instrumentation and hard-ware performance counter information during mutually-exclusive profiling steps. Binary in-strumentation runs once since architecture independent performance remains constant for a given program-input pair. Hardware performance collection repeats several times to filter noise and minimize multiplexing costs incurred while reading multiple
counters simultaneously.
Post-processing. We process the extracted task graph properties to construct the fork-join task graph and associate per-task properties with graph elements. We also plot the task graph to visualize how program tasks were created at runtime.
Tasks on the critical path of the task graph are good optimization candidates [12]. We ob-tain the critical path of the task graph using individual task instruction count as a proxy for ar-chitecture independent execution time.
We additionally derive the amount of exposed task parallelism using the critical path and total instruction count of all tasks. Our derivation is based on the notion oflogicalparallelism in the Cilkview tool [9]. Exposed task parallelism can quickly explain under-utilization of avail-able hardware parallelism (cores) as demonstrated in the Fibonacci example in the previous section. Exposed task parallelism also provides a loose upper bound on the amount of hard-ware parallelism required for program execution [9].
We estimate the computational intensity of tasks by measuring the number of instructions executed per memory read or write operation. Computational intensity is a useful metric for Fig 3. Extraction of task-based performance from OpenMP programs.
guiding the choice of performance optimizations—a concept elegantly demonstrated by the Roofline model [13].
Prototype Implementation
We built a prototype tool that implements the extraction method using Intel’s Pin-2.12 [14] for binary instrumentation, PAPI [15] for accessing hardware performance counters, R [16] for data-parallel post-processing and igraph [17] for task graph plotting.
We tested the tool on task-based OpenMP programs compiled using GCC-4.8.0 with opti-mization O2, linked with a custom runtime system called MIR [18] and executed on Linux-ker-nel-2.6.32. Implementing tool functionality in other runtime systems require two simple extensions—a mechanism for unique identification of task instances and a mechanism for at-tributing hardware and instruction-level performance to each task.
We disabled inlining of functions in program code to enable our method to distinguish task contexts as explained before. Disabling inlining degraded performance by less then 8% for BOTS benchmarks.
We cannot distinguish and exclude runtime system data structure operations while instru-menting tasks due to profiling infrastructure limitations. We compensate by subtracting run-time system data structure operations—typically constant—from profiled information in the post-processing step. We additionally cannot instrument dynamically linked user-level func-tion calls and system calls made in the context of outlined funcfunc-tions due to profiling infrastruc-ture and OS protection limitations. We account for system calls in the post-processing step and statically link user-level functions whenever possible.
Our tool minimizes required compiler and runtime system support by ignoring implicit tasks, untied tasks and tasks which live beyond their parent. Implicit tasks can be tracked by de-fining tasks explicitly in theparallelregion. Untied tasks can be tracked with additional imple-mentation complexity and is being considered for future versions of the tool. Tasks which live beyond the parent, also calledrogue tasks, are uncommon, problematic to profile, and will like-ly be removed in future OpenMP specifications to improve composability. Our tool also mini-mizes instrumentation overheads by disregarding program performance outside the scope of tasks.
We have built our tool such that performance depends on desired profiling information richness. The task graph structure is profiled in parallel with less than 1% overhead. Reading cycle and cache stall counters to obtain architecture dependent per-task properties, also done in parallel, incurs an average 2.5% overhead for BOTS benchmarks. Profiling architecture inde-pendent per-task properties—task instructions, memory footprint and memory accesses— slows execution by 36X for BOTS benchmarks. The slowdown is mainly due to sequential pro-filing and unavoidable binary instrumentation technology overheads. We use sequential profil-ing to simplify our Pin tool implementation which uses a sprofil-ingle task-trackprofil-ing stack and avoids complicated book-keeping or locking. However, the relatively high cost to obtain architecture independent per-task properties is paid only once since the properties remain constant for a given program-input pair. Once profiled, architecture independent per-task properties can be carried across runs with different core allotments (available hardware parallelism). Further-more, low overhead profiling of the task graph and architecture dependent per-task properties permits analysis of long-running programs.
BOTS Characterization
benchmarks: Alignment, FFT, Fibonacci, Floorplan, Health, NQueens, Sort, SparseLU and UTS. Alignment and SparseLU are iterative while the rest are recursive.
We contribute with a detailed architecture independent task-based characterization of BOTS benchmarks to complement existing predominantly thread-based characterizations. We first describe the relationship between benchmark inputs and exposed task parallelism. Next, we analyze benchmark input sensitivity to architecture independent task performance. We de-scribe the similarity between benchmarks by comparing task graph and per-task properties across inputs in the end.
Inputs
Understanding the influence of inputs is necessary to properly evaluate BOTS benchmarks be-cause the inputs control both data size and task parallelism. We characterize the influence of inputs on exposed task parallelism by first classifying the inputs into DATA SIZE, GRAIN SIZE and DEPTH.Fig 4shows the relationship between the inputs using the iceberg-shaped task graph (plotted by our tool) of BOTS Fibonacci—a typical example of recursive fork-join programs.
The task graph shows tasks using gray colored circles. The size of the task circles encodes in-struction counts—large-grained tasks appear as large circles. Fork-join points are indicated using plain circles. The longest path of the graph—critical path—in terms of instruction count is marked by circles with a red border.
The task graph begins execution at the top with a single root task which divides the Fibo-nacci problem and branches off to solve the parts in parallel. Each branch divides the problem further exposing more parallelism and widens the task graph. The extent of division in a branch is proportional to the problem specified by the DATA SIZE input.
The task graph becomes widest when most branches cannot divide the problem further. The highest amount of task parallelism—thepotential parallelismof the program—is exposed at the widest part. Performance is limited when potential parallelism is reached since instruc-tion count of tasks—grain size—is small and comparable with parallelizainstruc-tion overheads. The problem is solved by limiting branch growth to a depth where task grain sizes are practical for performance. The task graph with limited branch growth now contains theexposed parallelism of the program at the widest point. The growth-limited task graph of Fibonacci is shown in the inset inFig 4.
Both GRAIN SIZE and DEPTH inputs shown inTable 3are used to limit branch growth. GRAIN SIZE specifies the size of the problem at which branches should stop division. DEPTH specifies the maximum depth to which a branch can grow. GRAIN SIZE and DEPTH are com-monly calledcutoffparameters in BOTS. Tasks at the cutoff point (end of branch) are called leaftasks which typically execute the brunt of the work.
Fig 4. Task graph of Fibonacci.Large graph: input n = 8, depth cutoff =1. Small graph in inset: input n = 8, depth cutoff = 3. Size of task nodes (gray) indicates instruction count. Critical path is marked by nodes with a red border.
doi:10.1371/journal.pone.0123545.g004
Table 3. Inputs to limit task graph size in BOTS benchmarks.
Input Benchmarks
GRAIN SIZE Alignment, FFT, Sort, SparseLU, Strassen
DEPTH Fibonacci, Floorplan, Health, NQueens, Strassen, UTS
Input Sensitivity
We measure BOTS input sensitivity by quantifying changes in task graph and architecture in-dependent per-task properties with increasing data sizes. We use input sensitivity results to val-idate input behavior explained in the previous section and estimate scalability of benchmarks.
We found it difficult to choose standard and meaningful input values while designing our input sensitivity experiment. BOTS contains inconsistent and outdated input values recogniz-ing which widely varyrecogniz-ing input values have been used in existrecogniz-ing studies. In addition, cutoff values chosen for experiments are rarely indicated. We solved the problem by choosing input values to match the most common experiment machine size.
Our experimental setup to measure input sensitivity was as follows. We chose three increas-ing data sizes and a constant cutoff such that each benchmark executed for 1, 5 and 10 seconds on all cores of a 24-core AMD Opteron 6172 machine with frequency scaling turned off. We chose 24 cores to reflect the most accessible machine size for researchers. The three data sizes and constant cutoffs chosen for each benchmark are respectively shown in Tables4and5. We profiled each benchmark using our prototype tool and extracted task graph and per-task prop-erties for the three data sizes.
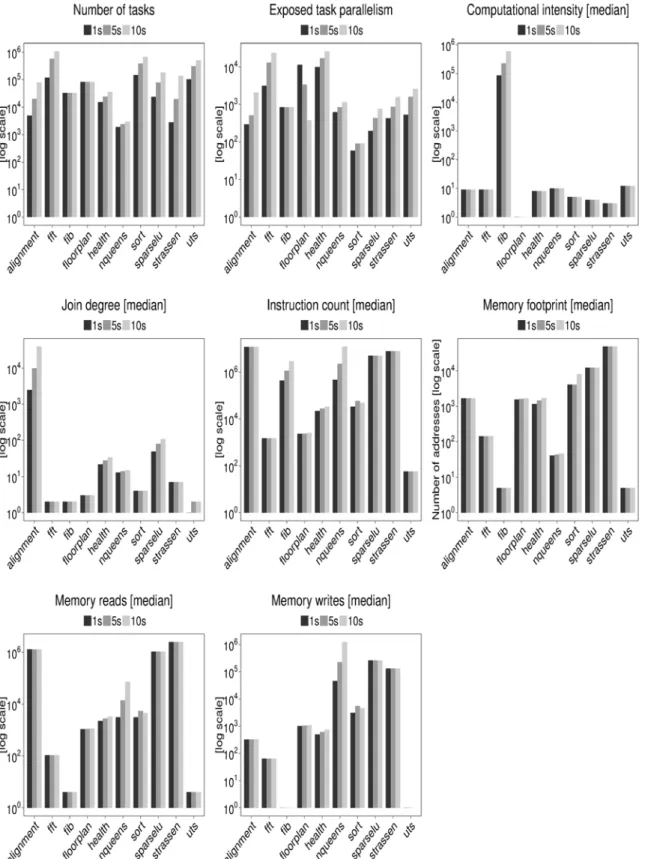
We show a subset of data collected by the input sensitivity experiment inFig 5. We use me-dian values to account for the most common change observable in extracted properties excluding outliers.
We validate input behavior as described in the previous section using the input sensitivity data inFig 5. A summary of the validation is available inTable 6. Alignment, FFT, Sort, Spar-seLU, Strassen and UTS support the explanation by showing an increase in tasks and exposed parallelism with increasing data and constant GRAIN SIZE input. Fibonacci, Floorplan, Health and NQueens support the explanation by showing an increase in task grain size and holding exposed parallelism constant with increasing data and constant DEPTH. The number of tasks in Health and NQueens surprisingly increases with data size despite constant DEPTH input. The increase in tasks is explained by the increase in join node degree indicating a non-linear widening of the task graph.
We can make first-order estimates of the scalability of BOTS benchmarks using extracted task graph and per-task properties. A summary of the scalability estimates is available in
Table 6. Fibonacci, Alignment and NQueens expose a large number of tasks with relatively high computational intensity and instruction count. The composition is favorable for perfor-mance since memory hierarchy utilization is likely to be high and parallelization overheads low. The benchmarks scale linearly on many architectures [8,19] which validates our estima-tion. The benchmarks additionally expose a high and growing amount of exposed parallelism favoring scaling on larger machines.
FFT, Health, Sort and UTS create the largest number of tasks but with relatively low compu-tational intensity and instruction count. The composition is ill-suited for performance since both memory hierarchy and the runtime system are likely to be stressed. Several studies have reported that the benchmarks scale poorly [8,10,20]. FFT, Health and UTS expose a high and growing amount of exposed parallelism which promises good scalability provided memory hi-erarchy utilization problems are solved. Sort is a pathological benchmark whose scaling will re-main poor on larger machines due to a low amount of exposed parallelism. We show later that Sort’s low amount of parallelism is by construction.
The decrease in exposed parallelism of the Floorplan benchmark with increasing data re-flects its non-deterministic nature. Constant number of tasks yet a slow growth of instruction count are additional odd behaviors of the benchmark. The performance implications of Floor-plan can only be understood by detailed experimentation.
Similarity Analysis
We identify BOTS benchmarks with similar task graph properties and per-task properties usingPrincipal Component Analysis(PCA) andHierarchical Clustering—techniques common-ly used to identify similarity of computer architecture workloads [21–23]. Our similarity analysis provides new directions to extend BOTS and pin-points redundant benchmark-input pairs which when avoided expedites timing-intensive studies such as computer architecture simulation.
Table 4. Data sizes to study BOTS input sensitivity.
Benchmark Input 1s 5s 10s
Alignment Number of sequences 100 200 400
FFT Number of samples 221 223 224
Fibonacci Number 48 50 52
Floorplan Number of shapes 10 15 20
Health Cities 22 28 34
NQueens Number of queens 13 14 15
Sort Array size 224 226 227
SparseLU Number of blocks 64 96 128
Strassen Matrix size 2048 4096 8192
UTS* Root branching factor 10000 30000 50000
*UTS is a synthetic stress benchmark whose default inputs produce an extraordinary amount of tasks—approx. 1.5–4 billion—which cannot be profiled
using our system. We have chosen input sets for UTS which produce approx. 100–300 thousand tasks and maintain stress.
doi:10.1371/journal.pone.0123545.t004
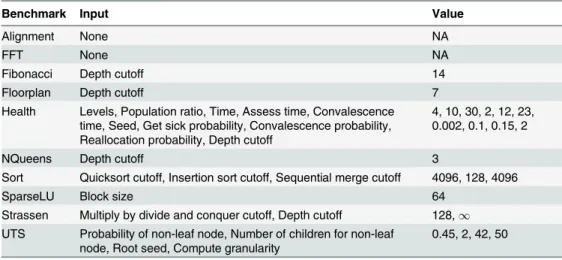
Table 5. Inputs held constant while studying BOTS input sensitivity.
Benchmark Input Value
Alignment None NA
FFT None NA
Fibonacci Depth cutoff 14
Floorplan Depth cutoff 7
Health Levels, Population ratio, Time, Assess time, Convalescence time, Seed, Get sick probability, Convalescence probability, Reallocation probability, Depth cutoff
4, 10, 30, 2, 12, 23, 0.002, 0.1, 0.15, 2
NQueens Depth cutoff 3
Sort Quicksort cutoff, Insertion sort cutoff, Sequential merge cutoff 4096, 128, 4096
SparseLU Block size 64
Strassen Multiply by divide and conquer cutoff, Depth cutoff 128,1 UTS Probability of non-leaf node, Number of children for non-leaf
node, Root seed, Compute granularity 0.45, 2, 42, 50
Fig 5. Task graph properties and per-task properties of BOTS benchmarks.1s, 5s and 10s indicate execution time in seconds on 24-core AMD Opteron
6172 machine.
Our experimental setup to measure similarity across BOTS benchmarks is inspired by the work of Eeckhout et al. [24] who meticulously describe their experimental setup to measure similarity between SPECint95 benchmarks.
We chose the following 10 task graph properties and per-task properties to measure similar-ity: number of tasks, memory footprint, memory reads, memory writes, stack reads, stack writes, instruction count, join degree, critical path and sequential work. The properties repre-sent program execution in an independent manner—they cannot be directly derived from each other. Note that we avoided thread-based properties since they indistinguishably mix architec-ture and runtime system scheduler properties with program execution. Our intention is to measure similarity inherent in the task-based structure of BOTS benchmarks.
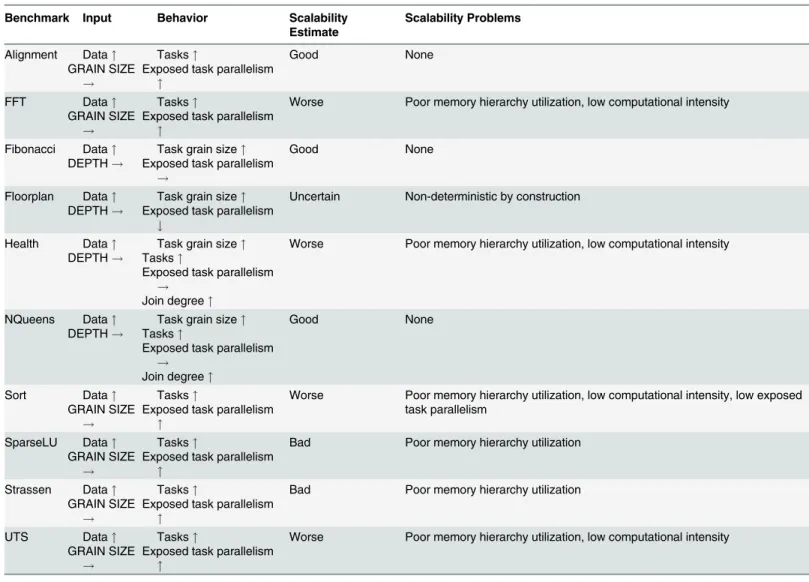
We profiled all 30 benchmark-input pairs inTable 4and collected median values of the 10 properties into a 10×10×3 dataset called BOTS-INP-ALL. Weautoscaled(scaling data to pro-duce unit variance, zero-centered mean) BOTS-INP-ALL to assign equal weights to properties with different units. We performed PCA on BOTS-INP-ALL using theprincompfunction in the R statistical programming language and retained Principal Components (PCs) that Table 6. Summary of BOTS input sensitivity study.The symbol"quantifies increasing,#decreasing and!fixed input values.
Benchmark Input Behavior Scalability
Estimate
Scalability Problems
Alignment Data" GRAIN SIZE
!
Tasks"
Exposed task parallelism "
Good None
FFT Data" GRAIN SIZE
!
Tasks"
Exposed task parallelism "
Worse Poor memory hierarchy utilization, low computational intensity
Fibonacci Data" DEPTH!
Task grain size" Exposed task parallelism
!
Good None
Floorplan Data" DEPTH!
Task grain size" Exposed task parallelism
#
Uncertain Non-deterministic by construction
Health Data" DEPTH!
Task grain size" Tasks"
Exposed task parallelism !
Join degree"
Worse Poor memory hierarchy utilization, low computational intensity
NQueens Data" DEPTH!
Task grain size" Tasks"
Exposed task parallelism !
Join degree"
Good None
Sort Data" GRAIN SIZE
!
Tasks"
Exposed task parallelism "
Worse Poor memory hierarchy utilization, low computational intensity, low exposed task parallelism
SparseLU Data" GRAIN SIZE
!
Tasks"
Exposed task parallelism "
Bad Poor memory hierarchy utilization
Strassen Data" GRAIN SIZE
!
Tasks"
Exposed task parallelism "
Bad Poor memory hierarchy utilization
UTS Data" GRAIN SIZE
!
Tasks"
Exposed task parallelism "
Worse Poor memory hierarchy utilization, low computational intensity
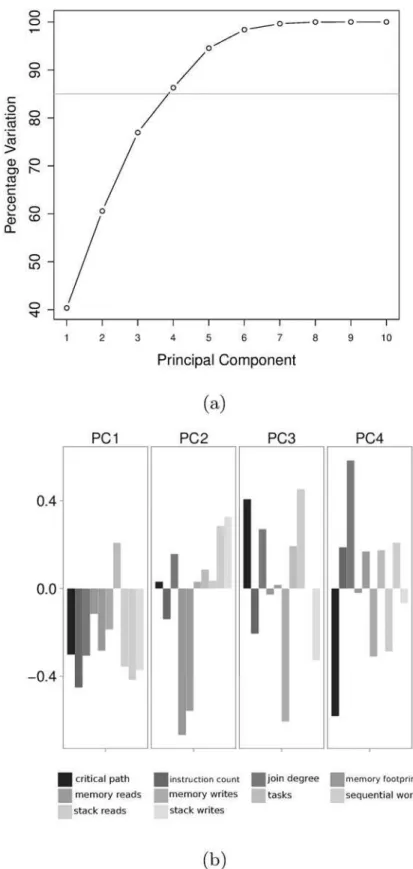
accounted for 85% of variations in the data set. We analyzed the meaning of the retained PCs and projection of BOTS-INP-ALL in the retained PC space.
We autoscaled retained PC scores and applied agglomerate hierarchical clustering using the hclustfunction in R with Euclidean distance as the linkage metric and Ward’s minimum vari-ance method for clustering data. We visualized the result of hierarchical clustering in a dendo-gram and cut groups into it to infer similarity.
We can account for more than 85% of variations in BOTS-INP-ALL using the first four PCs as shown inFig 6a.
Component loadings of the four retained PCs are shown inFig 6b. PC1 is an indicator of fine-grained benchmarks since it is positively influenced by the number of tasks and negatively influenced by instruction count. PC2 indicates benchmarks with stack memory intensive tasks, PC3 those with limited parallelism and fine-grained tasks and PC4 those benchmarks with lim-ited parallelism, large-grained tasks implemented using iterative fork-join parallelism.
Planes PC1-PC2 and PC3-PC4 defined by projecting benchmark-input pairs into the four-dimensional retained PC space are shown inFig 7. Alignment, NQueens and Fibonacci show widely dissimilar behavior with increasing data sizes since they are spread out in both planes. Strassen and SparseLU show slightly dissimilar behavior. The rest—Health, Sort, UTS, Floor-plan and FFT form close clusters indicating similar behavior irrespective of data size. Experi-ments using Health, Sort, UTS, Floorplan and FFT can save evaluation time by using the smallest data size. The empty spaces in the PC1-PC2 plane indicate an abundance of fine-grained but few memory intensive benchmarks in BOTS.
Results of hierarchical clustering of BOTS-INP-ALL are summarized inFig 8. The large cluster on the left shows that several benchmarks behave similarly not only across data inputs but also across each other. The remaining clusters indicate benchmarks with similar properties across data inputs. We can conclude that benchmark-input pairs in BOTS-INP-ALL have a strong resemblance in terms of the task-based properties chosen in our experiment. The simi-larity allows researchers concerned mainly with our chosen set of task-based properties to pick a single benchmark from each cluster and save evaluation time in timing-intensive experiments.
We reduced the likelihood of over-fitting by taking several measures. We have ensured that the BOTS-INP-ALL is complete without any missing values. We have reduced the number of variables describing data in two steps. First, we chose 10 independent task graph properties and per-task properties while composing the BOTS-INP-ALL dataset. Next, we scored BOT-S-INP-ALL using 4 PCs that described more than 85% of variations. Furthermore, we avoided bias by autoscaling both initial and scored datasets. As a last step to avoid over-fitting, we per-formedleave-one-outcross-validation on BOT-INP-ALL which estimated that 4 PCs can de-scribe the changing datasets with minimal error. We performed leave-one-out cross-validation using the R functionestim_ncpPCApart of themissMDApackage.
Diagnosing Performance Problems
We demonstrate how task-based performance can be used to diagnose performance problems quickly and understand performance tradeoffs using two troublesome programs—BOTS Sort and Strassen—as examples.
Sort
Fig 6. Principal Component Analysis.(a) Variation explained by Principal Components. We retain the first
four Principal Components which explain more than 85% variation. (b) Loadings of retained Principal Components.
Fig 7. Projection in retained Principal Component space.
are recursively merged. The choice of sorting algorithm and merge recursion depth is guided by multiple independent chunk sizes provided as inputs calledcutoffs.
Sort performs badly under default cutoffs as shown inFig 9a. However, performance im-proves significantly when good cutoffs are provided.
Thread-based performance cannot explain performance adequately. Thread state durations show more time spent in parallelization than in execution of tasks under default cutoffs, hint-ing without quantification that tasks are fine-grained. We cannot ensure if overall paralleliza-tion time is a robust measure i.e., if parallelizaparalleliza-tion time surpasses execuparalleliza-tion time of most tasks or just a few. Inspecting thread time-lines shown inFig 9bshows that tasks are created more Fig 8. Hierarchical clustering dendogram with a 5-cluster cut.
Fig 9. Diagnosing performance problems using thread-based performance metrics in BOTS Sort and Strassen.Sort input: array size = 64M elements, quicksort cutoff = {4096 (default), 262144}, sequential merge sort cutoff same as quicksort cutoff, insertion sort cutoff = 128. Strassen input: dimension = 4096, cutoff = 128 (default). Blocked matrix multiplication (blk-matmul) input: dimension = 4096, block size = 128. Executed on all cores of 48-core AMD Opteron 6172 machine running at highest frequency with frequency scaling turned off. (a) Speedup (b) Visualization of state traces from 6/48 threads executing Sort with default cutoffs. White bars indicate task creation, black bars, task execution and gray bars, task synchronization. The six threads are bound to cores on different dies.
frequently than executed but cannot explain why. Moreover, the inspection process requires careful navigation through dense time-lines—a difficult process when dealing with a large number of threads. Manual-tuning for multiple independent cutoffs is the only option available given thread-based performance.
Task-based performance shown inFig 10acan diagnose performance conclusively. We can confirm that per-task execution time is undoubtedly lower than parallelization time under de-fault cutoffs. Large per-task idle time indicates load imbalance on threads. Exposed parallelism cannot compensate exceeding parallelization costs despite being higher than the available hard-ware parallelism. Low computational intensity indicates an algorithmic problem in the compu-tation assigned to tasks.
Inspecting the task-graph produced by our tool further reveals performance bottlenecks. Ex-posed parallelism is non-uniform under default cutoffs as shown inFig 11. Parallelism grows gradually from the top and becomes highest in the middle of the task-graph as is typical for re-cursive fork-join task-based programs. However, unlike the typical case, Sort continues to work exposing non-uniform parallelism while winding down which creates the load imbalance seen in thread-based measurements. The task graph also points to aggressive branching as the reason behind frequent task creation phases seen on thread time-lines.
Task-based performance can also improve program understanding and expedite tuning. Let us try to reduce the high task creation frequency under default cutoff conditions. Code-links associated with fork edges of our task graph reveal that the cutoffs themselves are responsible for task creation. The implication of cutoffs becomes clear when we link fork points to respon-sible cutoffs using the captured data environment. We can immediately get good performance by selecting cutoffs in the low-branching sections of the task graph. Note that the same cutoffs emerge from manual-tuning.
Task-based performance under good cutoffs is shown inFig 10a. Task execution time ex-ceeds parallelization time and is higher than the default cutoffs counterpart. Idle time remains high due to non-uniform parallelism and large-grained tasks. Parallelism reduces slightly com-pared to the default cutoffs counterpart but is large enough to match the available hardware parallelism. Low computational intensity points to a continued algorithmic problem in task computation.
Strassen
The benchmark multiplies matrices by recursively splitting them into progressively smaller blocks. The smallest blocks are multiplied using the Strassen multiplication method. Tasks are used to split blocks until they reach a cutoff size provided as input. Blocks are split using se-quential execution after the task cutoff point.
Strassen scales modestly in our test case shown inFig 9a. Task-based metrics can help boost performance further. Per-task execution time inFig 10bexceeds parallelization time suggesting that performance problems lie elsewhere. Low computational intensity, frequent stack accesses and a large amount of time spent in dynamic memory allocation during task execution point to an algorithmic problem. The task graph inFig 12reveals work concentration at leaf tasks con-firming the algorithmic problem.
scaling turned off. Time spent in parallelization, computation and idle states is expressed in cycles. (a) Sort cutoff performance. (b) Strassen and Blocked matrix multiplication (blk-matmul) performance.
Fig 11. Task graph of BOTS Sort.Input: array size = 4096 elements, quicksort cutoff = sequential merge cutoff = 32. Input sizes are reduced to obtain graphs which satisfy space restrictions and preserve clarity. (a) Task graph with rectangle marking area of interest. (b) Task graph zoomed into area of interest.
We solved the algorithmic problem by re-implementing the leaf task computation as a BLAS-enabled blocked matrix multiplication. Our strategy improves performance significantly as shown inFig 9aat the one-time cost of finding a cache-friendly block size.
Related Work
Performance Analysis Tools
Popular OpenMP profiling tools Intel VTune Amplifier [2,3], Sun Studio Performance Ana-lyzer [6], Scalasca [7], Vampir [25] and HPCToolKit [5] capture detailed thread state and event performance but do not attribute captured performance to tasks [4].
Few profiling tools support capturing and presenting OpenMP task performance to the user. A common advantage of our tool is richer task performance information obtained at lower costs.
Qian et al. [26] combine the thread line and the function call graph to construct a hybrid graph called the Profiled Timeline Graph (PTG) which shows time spent by threads executing tasks and scheduling points of OpenMP programs. While the PTG is useful to infer runtime system overheads and task granularity, it cannot measure exposed task parallelism—a crucial metric to diagnose performance problems. Our method characterizes exposed task parallelism, per-task hardware and instruction-level performance in addition to metrics indicated by the PTG at lower profiling costs. Our implementation lowers profiling costs by tightly coupling with the runtime system and using parallel post-processing whenever possible. The PTG im-plementation suffers high overheads since it uses source instrumentation, is decoupled from the runtime system and uses sequential post-processing.
Ding et al. [27] retrieve parent-child relationship and execution time of tasks from OpenMP programs. The authors use the information to construct a visual fork-join task graph similar to our approach. Their fork-join task graph connects fork and join edges from children to the same parent node, forming cycles which makes calculation of exposed task parallelism difficult and complicates graph layouting. Our fork-join task graph separates fork and join nodes from task nodes and joins them to form a DAG which simplifies both parallelism calculation and graph layouting. The authors also suggest super-imposing fork-join information with thread time-line visualization which reduces clarity for large thread counts. Their tool is implemented as an external library that perform task monitoring by intercepts calls to the libgomp runtime system. Compared to our method which is implemented in the runtime system itself, an exter-nal library allows decoupling from the runtime system implementation which potentially re-duces implementation complexity. However, the external library approach is restricted to capture information at interception points or events which makes it hard to capture non-events such as task completion and task switching. Task completion and task switching events are Fig 12. Task graph of BOTS Strassen.Input: dimension = 512, divide and conquer multiplication cutoff = 128, depth cutoff =1. Input sizes are reduced to obtain graphs which satisfy space restrictions and preserve clarity.
necessary to attribute per-task properties to each task instance. Another drawback of external monitoring is fragility to runtime system changes. Their tool profiles parent-child relationships and task execution time at an average 15% overhead for BOTS benchmarks whereas our imple-mentation extracts the same metrics incurring an average 2.5% overhead.
The OmpP tool [28] uses source instrumentation to record entry into, execution time within and exit from OpenMP task regions but without not per-task information which is necessary to study performance of tasks in isolation. Our methods provide richer performance informa-tion than OmpP.
Lin and Mazurov [29] extend OpenMP performance sampling API [30] with support for querying the runtime system for task execution information such as task instance identification and parent-child relationships. Use of such information in performance analysis is not demon-strated in their paper. Qawasmeh et al. [31] implement OpenMP performance sampling API for task-based profiling. They capture creation, execution and synchronization time of individ-ual task instances with low-overheads similar to our approach, but do not demonstrate how captured information can be used to solve performance problems. Our methods additionally capture exposed task parallelism and per-task hardware and instruction-level performance, and demonstrate their usefulness in improving real-world OpenMP programs.
OMPT [32,33] is a performance analysis API recently proposed by the OpenMP Tools Working Group. OMPT allows external tools to asynchronously sample execution states of and register for event notification with the runtime system. Our approach to uniquely identify task instances and track their creation, execution and synchronization can also be performed using task-centric data structures and notification mechanisms specified by OMPT. While OMPT covers all aspects all aspects of OpenMP execution such as parallel regions, work-shar-ing for-loops and tasks, our approach focuses on task-based execution. OMPT is well thought-out but is presented surprisingly withthought-out an accompanying implementation, complicating overhead comparison. Demonstration of how OMPT supplied information can be used to solve performance problems in OpenMP programs is also missing in OMPT literature. OMPT is incapable of characterizing exposed task parallelism and per-task hardware and instruction-based performance.
The debugger IDB [34] in Intel Composer XE 2013 provides task creation and synchroniza-tion informasynchroniza-tion but not task execusynchroniza-tion time for OpenMP programs. Task execusynchroniza-tion time is crucial for performance tuning in which tasks are composed to be larger than runtime system overheads but not too large to cause load imbalance. Intel also provides an autotuner called the Intel Software Autotuning Tool [35] which can graphically quantify relationships between task granularities and inputs of TBB programs.
The Cilkview tool [9] monitorslogical parallelismand analyses the scalability of Cilk Plus programs. Logical parallelism is an intrinsic, construction-based property of Cilk Plus pro-grams which we adopt to derive the notion of exposed task parallelism in task-based OpenMP programs. Cilkview extracts critical path of the task graph using instruction count as a proxy for execution time similar to our approach.
Aftermath [39] is a graphical tool to analyze performance problems in programs written using OpenStream, a streaming/data-flow task-based programming language. Aftermath ap-plies a combination of task-based and topology-based filters on thread time-line visualization to aggregate task execution times, per-task memory performance and per-task communication patterns. It is unclear whether Aftermath supports filtering and aggregation of recursive tasks which are the most common type of tasks composed in OpenMP programs. Aftermath cannot quantify exposed task parallelism and per-task instruction-level performance.
BOTS Characterization
While thread-based performance of BOTS benchmarks has been extensively characterized on several multicore architectures and under different scheduler implementations [8,10,19,40–
42], only few task-based characterizations of BOTS benchmarks exist.
BOTS creators guide runtime system design using average values of per-task instruction count and memory accesses profiled for the medium input set [8]. Lorenz et al. [36] use Score-P to profile and report mean task execution time for BOTS benchmarks for the medium input set. Ding et al. [27] provide task creation and synchronization counts of BOTS benchmarks for a custom input set. Qian et al. [26] provide task count, average task execution time and creation time (GCC 4.7.2) of BOTS benchmarks for a custom input set. Input sensitivity studies of BOTS benchmarks using task-based performance measurements are absent. Similarity analysis of BOTS benchmarks using both thread-based and task-based performance measurements are also absent.
We focus on techniques that guide proper choice ofcutoffinputs to increase performance of task-based programs in the paper. Cutoffs inhibit task creation for performance and are cur-rently inferred using manual tuning and expert judgment. Automatic choice of good cutoffs in the runtime system has been studied by Duran et al. [43]. They use dynamically profiled execu-tion time of past tasks to adaptively inhibit or allow task creaexecu-tion and obtain good performance for task-based OpenMP programs that predate BOTS. Although wise cutoff support in the run-time system is desirable, widely-used compilers GCC (version 4.9) and Intel ICC (libomp_oss version 20131209) implement simple heuristic-based cutoffs. GCC cuts off task creation when the number of tasks in the system exceeds a magic number (number of threads64). ICC cuts off task creation when tasks queues are full. Both mechanisms did not work well with BOTS benchmarks in our tests allowing us to conclude that proper cutoff choice continues to be a programmer responsibility.
Conclusions
diagnose performance problems quickly and understand performance tradeoffs while analyz-ing OpenMP programs.
Acknowledgments
The authors thank Artur Podobas for insightful discussions and suggestions regarding the manuscript.
Author Contributions
Conceived and designed the experiments: AM. Performed the experiments: AM. Analyzed the data: AM PAJ MB. Contributed reagents/materials/analysis tools: MB. Wrote the paper: AM PAJ MB.
References
1. Ayguadé E, Copty N, Duran A, Hoeflinger J, Lin Y, Massaioli F, et al. The design of OpenMP tasks.
Par-allel and Distributed Systems, IEEE Transactions on. 2009; 20(3):404–418. doi:10.1109/TPDS.2008. 105
2. Intel Corporation. Profiling OpenMP applications with Intel VTune Amplifier XE; 2013. Available:https://
software.intel.com/sites/default/files/article/489352/profiling-openmp-applications-with-intel-vtune-amplifier-xe.pdf. Accessed 30 July 2014.
3. Intel Corporation. Intel VTune Amplifier 2013 (Document number: 326734-012); 2013. Available:http://
software.intel.com/en-us/vtuneampxe_2013_ug_lin. Accessed 30 July 2014.
4. Schmidl D, Terboven C, Mey Da, Müller MS. Suitability of Performance Tools for OpenMP Task-Parallel Programs. In: Knüpfer A, Gracia J, Nagel WE, Resch MM, editors. Tools for High Performance Comput-ing 2013. SprComput-inger International PublishComput-ing; 2014. p. 25–37.
5. Liu X, Mellor-Crummey JM, Fagan MW. A new approach for performance analysis of OpenMP pro-grams. In: ICS; 2013. p. 69–80.
6. Itzkowitz M, Maruyama Y. HPC Profiling with the Sun Studio Performance Tools. In: Müller MS, Resch MM, Schulz A, Nagel WE, editors. Tools for High Performance Computing 2009. Springer Berlin Hei-delberg; 2010. p. 67–93.
7. Geimer M, Wolf F, Wylie BJ, Ábrahám E, Becker D, Mohr B. The Scalasca performance toolset archi-tecture. Concurrency and Computation: Practice and Experience. 2010; 22(6):702–719.
8. Duran A, Teruel X, Ferrer R, Martorell X, Ayguade E. Barcelona OpenMP tasks suite: A set of bench-marks targeting the exploitation of task parallelism in OpenMP. In: Parallel Processing, 2009. ICPP’09. International Conference on; 2009. p. 124–131.
9. He Y, Leiserson CE, Leiserson WM. The Cilkview scalability analyzer. In: Proceedings of the 22nd ACM symposium on Parallelism in algorithms and architectures. ACM; 2010. p. 145–156.
10. Olivier SL, de Supinski BR, Schulz M, Prins JF. Characterizing and mitigating work time inflation in task
parallel programs. In: High Performance Computing, Networking, Storage and Analysis (SC), 2012 In-ternational Conference for; 2012. p. 1–12.
11. Duran A, Corbalan J, Ayguadé E. Evaluation of OpenMP Task Scheduling Strategies. In: Eigenmann
R, Supinski BRd, editors. OpenMP in a New Era of Parallelism. No. 5004 in Lecture Notes in Computer Science. Springer Berlin Heidelberg; 2008. p. 100–110.
12. Sinnen O. Task scheduling for parallel systems. vol. 60. John Wiley & Sons; 2007.
13. Williams S, Waterman A, Patterson D. Roofline: an insightful visual performance model for multicore ar-chitectures. Communications of the ACM. 2009; 52(4):65–76. doi:10.1145/1498765.1498785 14. Luk CK, Cohn R, Muth R, Patil H, Klauser A, Lowney G, et al. Pin: building customized program
analy-sis tools with dynamic instrumentation. ACM Sigplan Notices. 2005; 40(6):190–200. doi:10.1145/ 1064978.1065034
15. Mucci PJ, Browne S, Deane C, Ho G. PAPI: A portable interface to hardware performance counters. In: Proceedings of the Department of Defense HPCMP Users Group Conference; 1999. p. 7–10.
16. R Core Team. R: A Language and Environment for Statistical Computing. Vienna, Austria; 2014.
Avail-able from:http://www.R-project.org.
18. Muddukrishna A, Jonsson PA, Vlassov V, Brorsson M. Locality-Aware Task Scheduling and Data Dis-tribution on NUMA Systems. In: Rendell AP, Chapman BM, Müller MS, editors. OpenMP in the Era of Low Power Devices and Accelerators. No. 8122 in Lecture Notes in Computer Science. Springer Berlin Heidelberg; 2013. p. 156–170.
19. Podobas A, Brorsson M, Faxén KF. A Quantitative Evaluation of popular Task-Centric Programming Models and Libraries. KTH, Software and Computer systems, SCS; 2012. 12:03.
20. Olivier S, Huan J, Liu J, Prins J, Dinan J, Sadayappan P, et al. UTS: An Unbalanced Tree Search Benchmark. In: Almasi G, Cascaval C, Wu P, editors. Languages and Compilers for Parallel Comput-ing. No. 4382 in Lecture Notes in Computer Science. Springer Berlin Heidelberg; 2007. p. 235–250. 21. Hoste K, Eeckhout L. Microarchitecture-independent workload characterization. Micro, IEEE. 2007; 27
(3):63–72. doi:10.1109/MM.2007.56
22. Bienia C, Kumar S, Li K. PARSEC vs. SPLASH-2: A quantitative comparison of two multithreaded benchmark suites on chip-multiprocessors. In: Workload Characterization, 2008. IISWC 2008. IEEE In-ternational Symposium on; 2008. p. 47–56.
23. Joshi A, Phansalkar A, Eeckhout L, John LK. Measuring benchmark similarity using inherent program characteristics. Computers, IEEE Transactions on. 2006; 55(6):769–782. doi:10.1109/TC.2006.85
24. Eeckhout L, Vandierendonck H, De Bosschere K. Quantifying the impact of input data sets on program
behavior and its applications. Journal of Instruction-Level Parallelism. 2003; 5(1):1–33.
25. Brunst H, Mohr B. Performance Analysis of Large-Scale OpenMP and Hybrid MPI/OpenMP Applica-tions with Vampir NG. In: Mueller MS, Chapman BM, Supinski BRd, Malony AD, Voss M, editors. OpenMP Shared Memory Parallel Programming. No. 4315 in Lecture Notes in Computer Science. Springer Berlin Heidelberg; 2008. p. 5–14.
26. Qian C, Ding Z, Sun H. A Performance Visualization Method for OpenMP Tasks. In: High Performance
Computing and Communications & 2013 IEEE International Conference on Embedded and Ubiquitous Computing (HPCC_EUC), 2013 IEEE 10th International Conference on. IEEE; 2013. p. 735–741.
27. Ding Y, Hu K, Wu K, Zhao Z. Performance Monitoring and Analysis of Task-Based OpenMP. PLoS
ONE. 2013 10; 8(10):e77742. doi:10.1371/journal.pone.0077742PMID:24204946
28. Fürlinger K, Skinner D. Performance Profiling for OpenMP Tasks. In: Müller MS, Supinski BRd, Chap-man BM, editors. Evolving OpenMP in an Age of Extreme Parallelism. No. 5568 in Lecture Notes in Computer Science. Springer Berlin Heidelberg; 2009. p. 132–139.
29. Lin Y, Mazurov O. Providing Observability for OpenMP 3.0 Applications. In: Müller MS, Supinski BRd, Chapman BM, editors. Evolving OpenMP in an Age of Extreme Parallelism. No. 5568 in Lecture Notes in Computer Science. Springer Berlin Heidelberg; 2009. p. 104–117.
30. Itzkowitz M, Mazurov O, Copty N, Lin Y. An OpenMP runtime API for profiling. OpenMP ARB as an offi-cial ARB White Paper available online athttp://www compunity org/futures/omp-api html.
2007;314:181–190.
31. Qawasmeh A, Malik A, Chapman B, Huck K, Malony A. Open Source Task Profiling by Extending the OpenMP Runtime API. In: Rendell AP, Chapman BM, Müller MS, editors. OpenMP in the Era of Low Power Devices and Accelerators. No. 8122 in Lecture Notes in Computer Science. Springer Berlin Hei-delberg; 2013. p. 186–199.
32. Eichenberger AE, Mellor-Crummey J, Schulz M, Wong M, Copty N, Dietrich R, et al. OMPT: An
OpenMP Tools Application Programming Interface for Performance Analysis. In: Rendell AP, Chapman BM, Müller MS, editors. OpenMP in the Era of Low Power Devices and Accelerators. No. 8122 in Lec-ture Notes in Computer Science. Springer Berlin Heidelberg; 2013. p. 171–185.
33. Eichenberger A, Mellor-Crummey J, Schulz M, Copty N, DelSignore J, Dietrich R, et al. OMPT and OMPD: OpenMP tools application programming interfaces for performance analysis and debugging; 2013.
34. Intel Corporation. Intel Debugger User’s and Reference Guide (Document Number 323267-008US); 2013. Available:http://software.intel.com/sites/products/documentation/doclib/stdxe/2013SP1/ composerxe/debugger/user_guide/index.htm. Accessed 30 July 2014.
35. Intel Corporation. Intel Software Autotuning Tool; 2010. Available:https://software.intel.com/en-us/ articles/intel-software-autotuning-tool. Accessed 30 July 2014.
36. Lorenz D, Philippen P, Schmidl D, Wolf F. Profiling of OpenMP tasks with Score-P. In: Parallel
Process-ing Workshops (ICPPW), 2012 41st International Conference on; 2012. p. 444–453.
38. Schmidl D, Philippen P, Lorenz D, Rössel C, Geimer M, Mey Da, et al. Performance Analysis Tech-niques for Task-Based OpenMP Applications. In: Chapman BM, Massaioli F, Müller MS, Rorro M, edi-tors. OpenMP in a Heterogeneous World. No. 7312 in Lecture Notes in Computer Science. Springer Berlin Heidelberg; 2012. p. 196–209.
39. Drebes A, Pop A, Heydemann K, Cohen A, Drach-Temam N. Aftermath: A graphical tool for perfor-mance analysis and debugging of fine-grained task-parallel programs and run-time systems. In: 7th Workshop on Programmability Issues for Heterogeneous Multicores (MULTIPROG, associated with HiPEAC), Vienna, Austria; 2014.
40. Olivier SL, Porterfield AK, Wheeler KB, Spiegel M, Prins JF. OpenMP task scheduling strategies for
multicore NUMA systems. International Journal of High Performance Computing Applications. 2012; 26 (2):110–124. doi:10.1177/1094342011434065
41. Olivier SL, Porterfield AK, Wheeler KB, Prins JF. Scheduling task parallelism on multi-socket multicore
systems. In: Proceedings of the 1st International Workshop on Runtime and Operating Systems for Su-percomputers; 2011. p. 49–56.
42. Podobas A, Brorsson M. A comparison of some recent task-based parallel programming models. In:
Proceedings of the 3rd Workshop on Programmability Issues for Multi-Core Computers, (MULTI-PROG’2010), Jan 2010, Pisa; 2010.
43. Duran A, Corbalán J, Ayguadé E. An Adaptive Cut-Off for Task Parallelism. In: High Performance