Positive Allosteric Modulator of GABA Lowers
BOLD Responses in the Cingulate Cortex
Susanna A. Walter1,2, Mikael Forsgren2,3, Karin Lundengård2,3, Rozalyn Simon2,3,
Maritha Torkildsen Nilsson4, Birgitta Söderfeldt5,6, Peter Lundberg2,3,7, Maria Engström2,3*
1Department of Clinical and Experimental Medicine, Linköping University, Linköping, Sweden,2Center for Medical Image Science and Visualization (CMIV), Linköping University, Linköping, Sweden,3Department of Medical and Health Sciences, Linköping University, Linköping, Sweden,4The National Board of Forensic Medicine and Linköping University, Linköping, Sweden,5Department of Clinical Science and Education, Karolinska Institutet, Stockholm, Sweden,6Radiation Physics, Department of Medical and Health Sciences, Linköping University, Linköping, Sweden,7Radiology, Department of Medical and Health Sciences, Linköping University, Linköping, Sweden
Abstract
Knowledge about the neural underpinnings of the negative blood oxygen level dependent (BOLD) responses in functional magnetic resonance imaging (fMRI) is still limited. We hypothesized that pharmacological GABAergic modulation attenuates BOLD responses, and that blood concentrations of a positive allosteric modulator of GABA correlate inversely with BOLD responses in the cingulate cortex. We investigated whether or not pure task-related negative BOLD responses were co-localized with pharmacologically modulated BOLD responses. Twenty healthy adults received either 5 mg diazepam or placebo in a double blind, randomized design. During fMRI the subjects performed a working memory task. Results showed that BOLD responses in the cingulate cortex were inversely corre-lated with diazepam blood concentrations; that is, the higher the blood diazepam concentra-tion, the lower the BOLD response. This inverse correlation was most pronounced in the pregenual anterior cingulate cortex and the anterior mid-cingulate cortex. For subjects with diazepam plasma concentration>0.1 mg/L we observed negative BOLD responses with
respect to fixation baseline. There was minor overlap between cingulate regions with task-related negative BOLD responses and regions where the BOLD responses were inversely correlated with diazepam concentration. We interpret that the inverse correlation between the BOLD response and diazepam was caused by GABA-related neural inhibition. Thus, this study supports the hypothesis that GABA attenuates BOLD responses in fMRI. The minimal overlap between task-related negative BOLD responses and responses attenuated by diazepam suggests that these responses might be caused by different mechanisms.
OPEN ACCESS
Citation:Walter SA, Forsgren M, Lundengård K, Simon R, Torkildsen Nilsson M, Söderfeldt B, et al. (2016) Positive Allosteric Modulator of GABA Lowers BOLD Responses in the Cingulate Cortex. PLoS ONE 11(3): e0148737. doi:10.1371/journal. pone.0148737
Editor:Xuchu Weng, Hangzhou Normal University, CHINA
Received:September 15, 2015
Accepted:December 22, 2015
Published:March 1, 2016
Copyright:© 2016 Walter et al. This is an open access article distributed under the terms of the
Creative Commons Attribution License, which permits unrestricted use, distribution, and reproduction in any medium, provided the original author and source are credited.
Data Availability Statement:All relevant data are available in the Supporting Information files.
Funding:Linköping University and the County Council of Östergötland are gratefully acknowledged for financial support. The funders had no role in study design, data collection and analysis, decision to publish, or preparation of the manuscript.
1. Introduction
Blood oxygen level dependent (BOLD) responses in functional magnetic resonance imaging (fMRI) reflect hemodynamic responses to neural activation [1,2], and the responses can become either positive or negative in relation to baseline activity. Positive BOLD responses can be explained by activated neurons that cause increased metabolic demands with accompanying increases of cerebral blood flow and volume [3]. Recent findings, however, suggest that positive BOLD responses are associated with vasodilatation mediated by the excitatory neurotransmit-ter glutamate [4–6]. However, there are only limited data that explain the neurovascular mech-anisms to the frequently observed negative BOLD responses in fMRI [4,7–9].
A few studies indicate an association between BOLD responses and the inhibitory neuro-transmitter gamma-aminobutyric acid (GABA) [8,10–12]. In these studies, GABA concentra-tions were measured during rest with magnetic resonance spectroscopy (MRS), and the BOLD responses were measured subsequently during visual or emotional processing. It has also been shown that a positive allosteric modulator of GABA (GABA-PAM) further lowers the negative BOLD response during emotional processing [13]. Other studies have reported dose-depen-dent relations between GABA-PAMs and decreased cerebral blood flow [14,15], and dose-dependent attenuation of BOLD responses during emotional processing [16]. However, phar-macodynamics vary widely between individuals, and the relationship between the effective plasma concentrations of GABA-PAMs and BOLD responses has not been investigated yet.
In the current study, we have therefore investigated the relation between plasma concentra-tions of the GABA-PAM diazepam (DZ) and the BOLD responses in healthy subjects during executive processing. In a previous study we investigated the potential effects of DZ on brain activation, and found no drug-related effects [17]. However, in that study we did not examine negative BOLD responses and we did not take individual plasma concentrations of the GABA--PAM into account. Given lead by previous studies reporting correlations between the GABA system and the vascular response in the cingulate cortex [12,14], the paramount role of the cingulate cortex in executive processing [18], and the relation between GABA levels measured by MRS and negative BOLD responses in the default mode network (DMN) during working memory processing [19], we decided to investigate the effect of the GABA-PAM DZ on BOLD responses in the cingulate cortex during working memory performance. More specifically, we aimed to investigate if pharmacologic GABAergic modulation influences BOLD responses in task-related cingulate regions, or if the pharmacologically modulated responses occur else-where in the cingulate cortex. This research contributes importantly to the understanding of the neural mechanisms behind the BOLD response; an issue, which recently has gained much interest and is a matter of debate.
2. Materials and Methods
2.1 Subjects
2.2 Study design
The study had a double blind, randomized, counter-balanced, crossover, and placebo-con-trolled design. A randomization list and envelopes containing either compressed and non-coated DZ or placebo tablets were prepared by a third party not participating in the study (Apoteket AB, Sweden). Each subject received 5 mg DZ perorally at one fMRI session and pla-cebo at the other. The distribution half-life of DZ is approximately 40 minutes. We used DZ at low dose to obtain‘minimal sedation’, which has been defined as‘normal response to verbal stimuli’;i.e., the subject responds normally to verbal commands although cognitive functions may be impaired (American Society of Anesthesiologists, ASA). As the study had a counter-balanced design, half of the subjects received DZ on the first fMRI session and the other half on the second session.
2.3 Procedure
All subjects went through three separate MRI examinations on three different occasions, namely: 1) structural MRI, 2) DZ fMRI, and 3) placebo fMRI. On the first occasion, the sub-jects were informed about the study, and they were examined by structural MRI in order to allow them to be acquainted with the MRI environment. Both fMRI sessions were separated by at least one, and at most six weeks. During the fMRI sessions, three different tasks in random-ized order for each subject were administered: 1) working memory (WM), 2) word fluency, and 3) finger tapping (results of the word fluency and finger tapping tasks are not reported here).
The subjects were instructed not to take alcohol or other drugs for 24 h before the fMRI examinations. In addition, they were firmly instructed not to intake products containing caf-feine or nicotine on the examination day. At the fMRI session, the subjects were administered DZ or a placebo approximately 30 minutes before the scanning started. Blood plasma samples for measurements of DZ concentration were collected immediately before and approximately 45 minutes (range 37–68 minutes) after the administration of the drug. We aimed to collect blood samples in the middle of the investigation in order to obtain diazepam concentrations as close to the fMRI task as possible. However, due technical issues and previous scans not being completed in time the second blood samples were sometimes drawn later than planned.
2.4 Blood sample analysis
Plasma samples were analyzed for DZ concentration at the National Board of Forensic Medi-cine, Linköping, Sweden. After adding prazepam as an internal standard, each sample was extracted at pH 7. The extract was analyzed with gas chromatography with a nitrogen-phos-phorus detector (Hewlett Packard 5890 Series II GC, Hewlett-Packard Company, Palo Alto, USA). The chromatograph was temperature-programmed. The accuracy of the analysis method was controlled by repeated measurements: five replicates of two low-concentration samples (0.005 and 0.010 mg/g). The coefficient of variation (CV) was 4.08% and 2.00% respec-tively. More details of the analytic method are reported elsewhere [20,21].
2.5 Task design
displayed one at a time and the subjects were asked to determine: a) if the current letter was the same as a specified target letter (0-back or baseline); b) if the current letter was the same as the previously presented letter (1-back); c) If the current letter was the same as the letter presented two letters previously (2-back). Each letter was presented for 0.5 s followed by a blank screen, which was displayed for 1.5 s. Each n-back block comprised 15 events (= presented letters), of which four were targets. The level of the upcoming n-back task was indicated on the screen during 5 s before each task block. Total duration of the task was 8 min and 40 s.
The tasks were presented using a back projection screen viewed via a mirror mounted on the head coil. The participants responded to the given task using a response box (Photon Con-trol Inc., Burnaby, Canada). Response time and accuracy were measured as behavioral perfor-mance. The fMRI paradigm was designed using the SuperLab software (Cedrus Corporation, San Pedro, USA).
2.6 fMRI data acquisition
An echo planar imaging (EPI) gradient echo sequence optimized for BOLD contrast was used to acquire fMRI data on a Philips Achieva 1.5 T scanner (Philips Healthcare, Best, The Nether-lands). The following image parameters were used: Data matrix = 80x80, Field of View (FOV) = 230 mm, Echo Time (TE) = 40 ms, Repetition Time (TR) = 2700 ms, Flip angle = 90°, Num-ber of slices = 31, Slice thickness = 3 mm, NumNum-ber of volumes = 193. Axial slices aligned between the floor of sella turcica and the corner of the fourth ventricle were acquired in inter-leaved order.
2.7 fMRI data analysis
2.7.1 Preprocessing. Pre-processing and first level analysis of the fMRI data were per-formed using SPM2 (Wellcome Department of Imaging Neuroscience, University College, London, UK), employing the same method as described in a previous paper by us [17]. The images were firstly corrected for different acquisition timing using sinc interpolation. Thereaf-ter the images were realigned to the mean image to correct for subject movement during scan-ning. The images were also corrected for movement-related susceptibility effects using generative models as described by Andersson and co-workers [22]. Finally, the images were normalized to Montreal Neurological Institute (MNI) standard space with voxel size 3x3x3 mm3, and smoothed with an 8 mm Gaussian filter to ameliorate differences in intersubject localization.
2.7.2 First level analysis. The EPI images were analyzed using a general linear model (GLM) implemented in SPM8. To estimate the BOLD responses in each subject, we used the canonical hemodynamic response function implemented in SPM8 and its temporal derivative. Each condition of the n-back task (0-back, 1-back, 2-back) was modeled separately in the GLM analysis. The fixation period was regarded as a short pause and thus not modeled explicitly. Parameters from the movement correction were included as nuisance variables in the GLM to statistically control for signal change related to head motion. In addition, we applied a high-pass filter with cut-off at 128 s and the AR(1) autocorrelation model type. Here, we estimated the BOLD responses during the most difficult condition of the WM task. We did so by calculat-ing contrast images representcalculat-ing differences in the BOLD responses between the 2-back condi-tion and the 0-back condicondi-tion, which was regarded as a controlled low-level activacondi-tion baseline. The contrasts were based on the hemodynamic response function and not on its temporal derivative, which was included as a nuisance variable.
contrast images from the placebo session. Group-related differences in brain responses between the DZ and the placebo sessions were obtained from paired t-tests of the contrast images. In this way we could analyze for regions that were more activated during the DZ ses-sion compared to the placebo sesses-sion and vice versa.
We aimed to investigate which regions of the brain that had BOLD responses that were directly correlated to DZ concentration. Therefore, the plasma DZ levels were included as covariates of interest in the second level analyses of the DZ session. In this way, the correlations between BOLD responses and DZ concentrations in each image voxel were calculated. The contrast estimates from the image voxel with highest correlation between BOLD responses and DZ concentrations were extracted for each subject as measures of brain responses to DZ treat-ment for pharmacokinetic/pharmacodynamic (PK/PD) modeling (see section2.12).
2.8 Regions of interest
In this study, we aimed to investigate if DZ attenuates brain activation in the cingulate cortex during a working memory task. Therefore we did small volume corrections within the entire cingulate cortex to investigate if there were any pure task-related effects or evidence for DZ-modulation of brain activation during the working memory task. In follow-up analyses, we investigated these effects in cingulate subregions by making statistical analyses in predefined regions of interest (ROI) in the cingulate cortex based on cytoarchitecture and functional stud-ies. The cingulate cortex is divided into four main sub-regions with different cytoarchitectures and functions: the anterior cingulate cortex (ACC), the midcingulate cortex (MCC), the poste-rior cingulate cortex (PPC), and the retrosplenial cortex [23]. The ACC is further subdivided into a subgenual (sACC) and a pregenual (pACC) portion, which are thought to be involved with affective and autonomic responses, and emotional integration, respectively [18,23]. The MCC is also subdivided into two different compartments: the anterior MCC (aMCC), which is involved in cognition, and the posterior MCC (pMCC), which is involved in skeletomotor ori-entation [24]. The role of the PCC is multifaceted; it is thought to be involved in diverse func-tions such as autobiographical memory, spatial learning, and mind wandering [25]. Image masks of the PCC (size = 122 voxels), pMCC (size = 515 voxels), aMCC (size = 217 voxels), pACC (size = 180 voxels), and the sACC (size = 68 voxels) were constructed from the Wake Forrest University (WFU) Pick Atlas [26] and the MarsBaR ROI toolbox [27] based on the descriptions in [23]. Voxels sizes are given as mean value of left and right hemisphere ROIs, since the ROIs were slightly asymmetric.
2.9 Significance Thresholds
At the whole brain level of analysis of task-related effects during the placebo session, the result-ing images were preliminarily thresholded at uncorrected p = 0.001. In the ROI analyses, we used a somewhat lower preliminary threshold, p = 0.01. In the full-scale significance estimation of all analyses, we firstly investigated if there were any significant effects in the entire cingulate cortex cluster using the criterion p<0.05, family-wise error (FWE) corrected for multiple comparisons. Results from the follow-up analyses in cingulate subregions are reported as sig-nificant if peak activation p<0.05 FWE corrected in each ROI and as trends if p<0.1 FWE corrected.
2.10 Movement analysis
movement correction of the fMRI images. Rotational parameters are given in radians (ø) and they were converted to millimeters by calculating the displacement on a circle (s) with radius, r= 50 mm,s=rø. The radius, r, is an approximation of the average distance from the cerebral cortex to the center of the head [28].
2.11 BOLD response curves
In order to estimate if DZ-modulated responses were positive or negative with respect to base-line, we extracted the BOLD responses in the aMCC from normalized images of three partici-pants with DZ plasma concentration>0.1 mg/L, using a spherical mask with radius 5 mm centered at [0, 18, 21]. Linear trends in the BOLD time series were removed using the detrend command in Matlab R2015a (MathWorks, Natick, MA, USA). BOLD responses from all tasks (0-back, 1-back, and 2-back) where extracted for those task sets where the 2-back task was administered immediately after the fixation period; allowing normalization of the BOLD response curves by subtracting the signal value at the last time point of the fixation period from all data points of the task set time series. The same procedure was performed for both the pla-cebo and the DZ sessions.
2.12 Pharmacological Analysis
2.12.1 Data normalization. The plasma DZ concentrations (measured in mg/L) were nor-malized to body weight (mg/kgBW). Normalization was performed with Nadler’s formula for blood volume, which is based on weight, height, and sex [29], and haematocrit levels of 46% and 42% for males and females respectively were assumed. Furthermore, the BOLD response data was rescaled to run from 0 to 1, where‘0’was defined as 125% of the maximal response below zero and‘1’was defined as 125% of the maximal response above zero for all subjects.
2.12.2 Pharmacological model based analysis. A PK/PD model was used for the model based pharmacological analysis. The purpose was two-fold: (i) to control for variable time between blood sampling and fMRI-measurement, and (ii) to model the physiological effect of DZ on neural activation.
1. In the PK/PD model the elimination of DZ, during the time between the venous blood sam-pling and the fMRI acquisition, was described by a mono-exponential function:
CP¼C
0
Pe
kelDt
ðEq:1Þ
whereCPis the estimated DZ plasma concentration at the fMRI WM experiment,CP0is the
DZ plasma concentration as measured in the venous blood sample approximately 45 min after DZ administration,kelis the elimination constant, andΔτis the time difference
between venous blood sample and the fMRI WM experiment. The elimination constant was found to be negligible in an initial model parametrization. As a result the elimination of DZ during the time between the venous blood sampling and the fMRI acquisition was in a prac-tical sense non-existing. Therefore the plasma concentration of DZ at the time of the fMRI acquisition was assumed to be equal to the DZ concentration measured in the venous blood.
2. The physiological effect of DZ was in the PK/PD model described by a Hill equation, which assumes that the drug effects are directly proportional to receptor occupancy as well as the assumption that the plasma drug concentrations are in rapid equilibration at the receptor site [30]:
Effect ¼E0
Emax CP
EC50þCP
where, due to the normalization of the data, the base line effect (E0) was set to 1, the
maxi-mal effect (Emax) was also set to 1, whereas the drug concentration yielding the half maximal
effect (EC50) was an free parameter in the model parameterization.
The PK/PD model was then parameterized using a nonlinear global optimization method (Differential Evolution [31]). The PK/PD model based analysis was performed using Mathe-matica (10.0.2.0, Wolfram Research Inc., Champaign, IL, U.S.).
3 Results
3.1 DZ did not affect behavior
There were no significant differences in reaction time or performance between the placebo and DZ sessions. The mean reaction times during the 2-back task were 613 ms and 595 ms for the placebo and DZ session, respectively. The accuracy was 98.2% during the placebo session and 98.5% during the DZ session. For more detailed information on behavioral results see Rag-nehed and co-workers [17]. Since DZ might influence the participants’motion during scanning we estimated the average motion parameters in both placebo and DZ sessions. There was no significant difference in average motion between DZ and placebo runs (p = 0.084), although it seemed like the participants moved less during the DZ session (0.12 mm in average) compared to the placebo session (0.15 mm). It should, however, be noted that average motion was sub-millimeter in this experiment and no participant moved more than a voxel size. Importantly for our work, there were no significant correlations between DZ concentration and average motion (p = 0.633).
3.2 DZ plasma concentration varied in individual subjects
In this study, we investigated the effective DZ plasma concentration in each subject before DZ or placebo intake and after approximately 45 minutes during a pause in the fMRI scanning. At the zero point checking of DZ concentration before the first fMRI session, none of the subjects had a measurable DZ plasma concentration. All subjects were given the same dose of DZ (5 mg). Nevertheless, we observed a (desired) variation in DZ plasma concentration among the subjects, ranging from zero to 0.16 mg/L. The observed time course and plasma concentrations agreed with what has been reported previously [32]. Self-rated sedative effects reached an opti-mum around 0.5–2 h after DZ-intake, which also agreed with the experimental design
described here.
3.3 WM whole brain analyses
3.3.1 WM elicited positive BOLD responses in the executive network. As expected from previous studies [33], the WM task elicited brain activation in the executive network (Fig 1). Data from whole-brain analysis showed significant (p<0.05 FWE corrected for multiple com-parisons) task-related positive BOLD responses in several areas of the executive network: the bilateral posterior parietal cortex, dorsolateral prefrontal cortex, and the medial frontal cortex including the supplementary motor area (SMA) and adjacent aMCC. Task-related positive BOLD responses were also found in the bilateral inferior temporal lobe and the thalamus.
3.4 WM elicited negative BOLD responses the cingulate cortex
Data showed significant task-related negative BOLD responses in the cingulate cortex, p<0.001, FWE corrected. We found negative responses in following sub-regions: the bilateral pACC corre-sponding to BA 32 (MNI co-ordinates = [0, 51, 9], p = 0.002), the bilateral PCC in BA 31 (MNI co-ordinates = [0,–51, 27], p<0.001), and the bilateral pMCC, BA 31 (MNI co-ordinates = [3,– 21, 48], p = 0.006); seeFig 2. All ROI analyses were based on preliminary uncorrected statistical threshold of p = 0.01 and FWE small volume correction in each ROI. We found no cingulate clusters of significant task-positive responses after correction for multiple comparisons, p = 0.27.
3.5 DZ lowers BOLD responses in the cingulate cortex
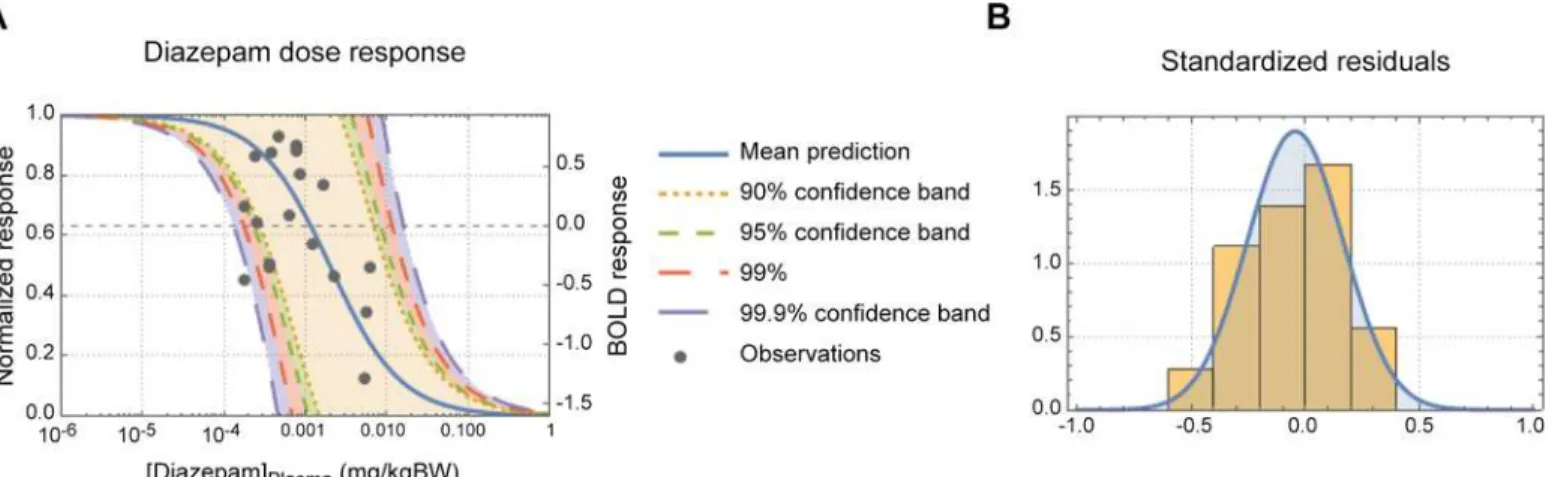
The modelled plasma DZvs. WM brain responses dose response curve is shown inFig 3. As can be seen inFig 3A, the dynamic dose range was about 0.1 to 10 mg/kgBW (body weight). The con-ventional PK/PD model was able to describe about 90% of the variance in the data (R2= 0.902) and as can be seen inFig 3Bthe residuals followed an expected normal distribution.
A small volume correction of the entire cingulate region showed that we had significant inverse correlation between BOLD responses and individual DZ plasma concentrations, cluster p = 0.006, FWE corrected. A follow-up ROI analysis in sub-regions of the cingulate cortex showed that DZ modulated the BOLD responses in the bilateral aMCC (medial BA 24) and in the right pACC (BA 32 and medial BA 24), seeTable 1,Fig 2. We also found trends (p<0.1,
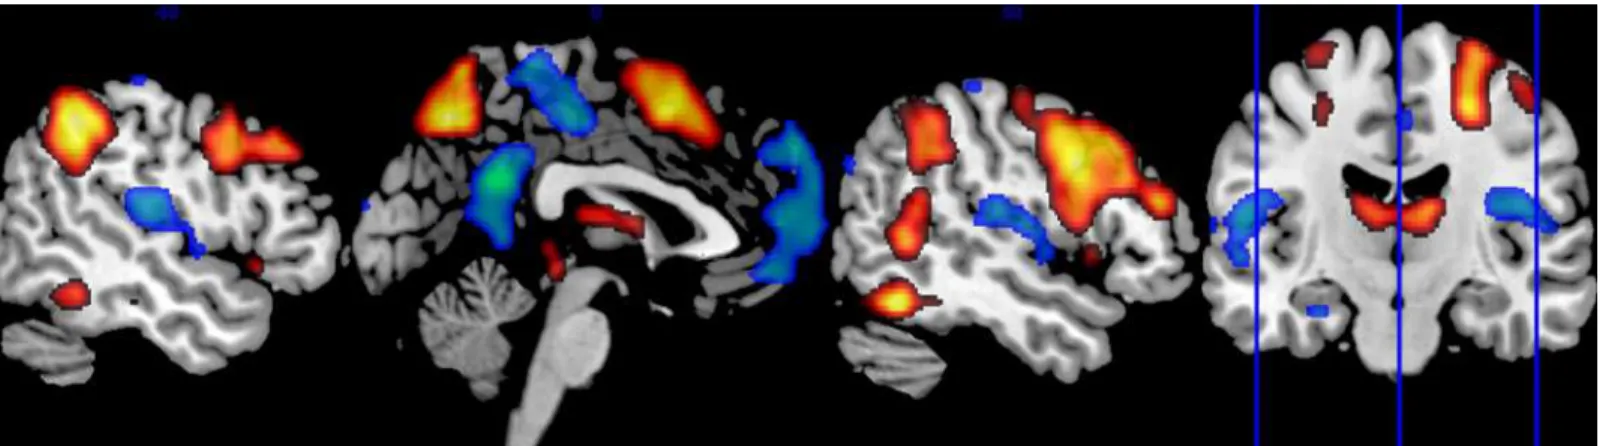
Fig 1. Positive and negative BOLD responses during executive processing.The sagittal brain images show whole brain group activation during the working memory task. Areas in orange/red denote positive BOLD responses, which were mainly found in the executive network. Areas in green/blue denote negative BOLD responses, which were mainly found in the default mode network. The coronal image shows the position of visualized sagittal slices.
doi:10.1371/journal.pone.0148737.g001
Fig 2. Task- and DZ-related BOLD responses in the cingulate cortex.The sagittal brain images show regions with task-related positive (red) and negative (blue) BOLD responses in the cingulate cortex in the whole group during the working memory task. Regions where the BOLD responses correlated inversely to diazepam plasma concentration are visualized in green. Task-negative and diazepam-attenuated responses were significant after family wise error (FWE) correction for multiple comparisons. Task-positive responses in the cingulate cortex were not significant after FWE correction.
FWE corrected) of inverse correlations between the BOLD responses and DZ concentrations in the bilateral PCC, and the right sACC and pMCC.
Fig 3Ashows the inverse dose-response correlation between the BOLD response in the aMCC and DZ concentration. From the dose-response curve it can be seen that half maximal effect (EC50) of DZ is 2.0μg/kgBW and a tenth of the maximal effect (EC10) is 0.2μg/kgBW.
Two subjects were removed from the dose-response analysis as they did not have any detect-able DZ concentration at the time of sampling. Three subjects had plasma DZ
concentration>0.1 mg/L and all of them had aMCC negative BOLD responses in comparison to baseline activity defined as the fixation period administered immediately before the 2-back task condition (Fig 4). InFig 4, it is also shown that BOLD responses to the 2-back task admin-istered during the placebo session are positive with respect to the fixation baseline. None of the pre-defined ROIs showed activation that was positively correlated to individual DZ plasma concentration.
Fig 3. DZ dose-response curve.(A) Panel A shows the predicted diazepam-dose-fMRI response curve. The normalized response is shown on the left y-axis and the actual BOLD response on the right y-y-axis. The mean prediction and a range of prediction confidence bands are also shown in panel A. (B) Panel B shows the standardized residual of the model fit.
doi:10.1371/journal.pone.0148737.g003
Table 1. Inverse correlation between DZ concentration and BOLD response in the cingulate cortex.
The table shows statistics and the location of the peaks in sub-regions of the cingulate cortex where the BOLD response was inversely correlated with DZ plasma concentrations. L = left, R = right. The cluster size denotes the number of inversely correlated voxels in the region of interest (ROI). The p-value is the family-wise error (FWE) corrected p-value in the correlation peak. The co-ordinates (x, y, and z) are given in the Montreal Neurological Institute (MNI) space. All ROI analyses were based on preliminary uncorrected statisti-cal threshold of p = 0.01 and FWE small volume correction in each ROI.
ROIs1 Cluster Size Peak
p(FWE) x y z
sACC R 14 0.069 9 21 -6
pACC R 79 0.044 12 45 15
aMCC L 38 0.016 0 18 21
aMCC R 31 0.030 3 15 21
pMCC R 22 0.069 3 -30 39
PCC L 6 0.057 -6 -45 9
PCC R 20 0.064 6 -48 27
1sACC = subgenual Anterior Cingulate Cortex, pACC = pregenual Anterior Cingulate Cortex,
aMCC = anterior MidCingulate Cortex, pMCC = posterior MidCingulate Cortex, PCC = Posterior Cingulate Cortex.
There were no significant differences between the DZ and the placebo sessions in terms of BOLD responses in the cingulate cortex (PCC, MCC, or ACC) when comparing the two ses-sions without taking the individual DZ concentrations into account.
3.6 Pure task-negative and DZ-attenuated BOLD responses did
sparsely overlap
We observed only a sparse overlap between regions with pure task-related BOLD responses and regions where the BOLD responses were modulated by DZ. InFig 2, it is seen that the task-related negative BOLD responses were mainly found in anterior and posterior portions of the cingulate cortex. The BOLD responses attenuated by DZ appeared primarily in cingulate regions adjacent to the corpus callosum with their main foci separated from negative task-related responses. However, we observed sparse overlap between DZ-modulated responses and pure negative BOLD responses, primarily in the left pACC, but also in small PCC clusters.
4 Discussion
We evaluated the modulatory effect of low doses of the GABA-PAM DZ on the BOLD responses in cingulate cortex sub-regions. The main findings were (1) DZ attenuated BOLD responses in the cingulate cortex; (2) DZ-modulated responses were task-dependent; and (3)
Fig 4. DZ-related negative BOLD responses.The figure shows mean BOLD responses in the anterior midcingulate cortex [0, 18, 21] for three subjects with DZ plasma concentration>0.1 mg/L during the 2-back, 1-back, and 0-back tasks. The BOLD responses are normalized to baseline defined as the fixation period immediately before the 2-back task. The figure shows that the BOLD responses are negative with respect to baseline during the DZ session and positive during the placebo session.
Regions with DZ-modulated responses did for the most part not overlap with cingulate regions with pure task-related BOLD responses.
4.1 GABA-PAMs and BOLD responses
In the present study, we found an inverse sigmoidal dose-response correlation between DZ concentrations and BOLD responses in the cingulate cortex. Hence, we showed that the GABA-PAM DZ clearly attenuates the BOLD responses under these conditions. Moreover, in subjects with high DZ concentration, the BOLD responses were negative in comparison to baseline activity (Fig 4). We interpret these results being caused by GABA-related neural inhibition.
This conclusion is supported by previous studies showing that benzodiazepines reduce BOLD responses in the orbitofrontal cortex [13] and the amygdala [16] during emotional pro-cessing. Previous studies also show that DZ causes BOLD reduction in the midcingulate cortex during a reaction time task [34].
4.2 GABA-related neural inhibition and BOLD responses
We observed an inverse sigmoidal dose-response correlation between DZ concentrations and BOLD responses in the cingulate cortex. Furthermore, subjects with high DZ concentration had negative BOLD responses with respect to the fixation baseline (Fig 4). Prior studies have shown a general GABA-related reduction of cerebral blood flow [14,15]. Reduction of cerebral blood flow is typically connected to increased BOLD responses [3]. However, if the blood flow reduction is caused by neural inhibition, this will lead to attenuated or negative BOLD responses [35]. Therefore, we interpret our findings being caused by GABA mediated neural inhibition (see also discussion in Section4.4).
GABA is the main inhibitory neurotransmitter of the brain and is therefore essential in the regulation of synaptic activity. GABA-PAMs enhance neural inhibition by increasing chloride influx through the GABAAreceptor complex [36]. However, the relation between inhibitory
neurotransmitters and the BOLD response is a matter of debate.
The BOLD response depends on changes in local deoxyhemoglobin content, which are caused by two separate effects: 1) the hemodynamic response related to increased cerebral blood flow as well as volume, 2) the metabolic response related to increased cerebral metabolic rate of oxygen (CMRO2) [37]. The current view is that a positive BOLD response is related to
synaptic activity mediated by glutamate in excitatory neurons [4]; however, it has been shown that inhibitory neurons also produce increased BOLD responses in some cases [8]. Although negative BOLD responses have been explained by decreases in cerebral blood flow due to blood flow redistribution [38] or increases in CMRO2without accompanying cerebral blood flow
increase [39], previous research suggest that negative BOLD responses are related to neural inhibition [9,35].
4.3 GABA-related BOLD responses in the cingulate cortex
A striking feature of our results is the sparse overlap between sub-regions with pure task-relatedBOLD responses and sub-regions withDZ-modulatedresponses. That is to say, the clusters in pACC and aMCC where DZ attenuated the BOLD responses were not primarily found in sub-regions showing pure task-related negative BOLD responses. Therefore, this sug-gests that the structure and location of the DZ receptor might differ from the GABA receptor that is responsible for the pure task-related negative BOLD response in the cingulate cortex. This might be in part due to the known variation of GABA receptor concentration across the human brain [41] and across the cingulate cortex [42,43].
We observed significant task-related negative BOLD responses in pACC and in the poste-rior parts of the cingulate cortex (pMCC and PPC). The pACC is a cingulate cortical area with a higher concentration than average of GABABreceptors [42,43]. Receptor architecture studies
have also shown that pMCC and PPC have higher than average density of both GABABand
non-benzodiazepine binding GABAAreceptors [42,43]. In our work, areas with pure
task-related negative BOLD responses were heterogeneously distributed across the cingulate cortex and partly coincided with cingulate areas with high density of GABA receptors.
4.4 GABA and cerebral blood flow
It is well known that GABA-PAMs influence cerebral blood flow [44] and prior imaging stud-ies have found decreased cerebral blood flow in relation to GABA-PAMs [14,15] and endoge-nous GABA levels measured by MRS [45,46], but see also [47]. Relevant to our study, GABA-PAM mediated reduction of cerebral blood flow has specifically been observed in the cingulate cortex [14,48,49]. Krause and co-workers also reported strong inverse correlation between GABA levels measured in the ACC and whole-brain blood flow [45] indicating that our results might be caused by vascular effects of DZ unrelated to neural activity. As regions where we found significant inverse correlations between DZ and BOLD responses are located in brain areas with large vessels, we made post-hoc analyses of BOLD responses in the anterior insula where the middle cerebral artery passes through. In the anterior insula, we found no sig-nificant DZ-effects or trends thereof. We also made post-hoc analyses of DZ-related responses in the cingulate and anterior insular cortices during the 1-back condition in our working mem-ory task, and also during the verbal fluency task administered in this study (descriptions of the verbal fluency task is found in [17]). We found no trends of DZ-modulated responses in either of these post-hoc analyses. We therefore conclude that DZ modulation of the BOLD response is neural in origin and related to the task performed during fMRI.
4.5 Negative BOLD response and the default mode network
Greiciuset al. studied DMN connectivity during conscious sedation with a GABA-PAM and found that DMN functional connectivity persisted during sedation [58].
4.6 Strengths and limitations
The present study had several methodological strengths. The risk of an intersession effect was reduced by an initial adaptation scan, and the number of subjects was adequate (n = 20). Fur-thermore, the administered DZ dose was low, ensuring minimal sedation and unperturbed normal response to verbal stimuli. The small modulatory doses of DZ given in the present study did not significantly influence the subjects’performance, measured as the number of cor-rect responses and reaction time. This was in our view an important aspect of the experimental design. Nevertheless, it is known that benzodiazepines influence performance in a variety of tasks [34]. Especially, it is known that benzodiazepines impair higher cognitive function such as attention, memory, or planning [59–61]. One limitation of the present study was that we did not investigate the subjects’cognitive function by also administrating more challenging tasks, which might have shown DZ-related performance decreases.
Another particular strength of our study is that DZ plasma concentration was modeled using a non-linear dose-response analysis, to retrospectively control for individual variations in DZ metabolism. However, although small, non-sedative doses of DZ are often prescribed as calming drugs, the low DZ plasma concentration in some subjects, may nevertheless suggest that more individualized dosage by for example controlling for body weight, length and sex could be explored in future studies. The pharmacokinetic model in the present study suggests that DZ plasma concentration of at least 2.0μg/kgBW is necessary to obtain 50% of the
maxi-mal BOLD response. Although we did control for individual variability regarding pharmacoki-netics at the actual time of the experiment, it did not affect the results. According to a
pharmacokinetic study by Friedman and co-workers the peak DZ plasma concentration occurs after 0.5 h after administration [62]. In that study it was also shown that the plasma concentra-tion increases rapidly to a maximum and thereafter decays slowly during several few hours. Shaderet al. reported similar observations [32]. It is possible that the blood samples for DZ analysis were taken too early after administration in some subjects. It is also possible that some subjects had a full stomach, which might have slowed the absorption. Another limitation of the present study was that the subjective levels of consciousness were not explicitly measured (such as by self-rating of the sedative effect), although reaction time and task performance were determined.
5 Conclusions
In summary, the present study demonstrated inverse dose-response correlation between DZ concentration and BOLD response in the cingulate cortex. Our interpretation is that the inverse correlation between DZ and the BOLD response was caused by GABA-related neural inhibition. A particularly interesting finding was that brain regions with DZ-related BOLD responses did only sparsely overlap with brain regions demonstrating task-related negative BOLD responses. The minor overlap between task-related BOLD responses and responses attenuated by DZ suggests that these responses might be caused by different mechanisms.
Supporting Information
one-sample t-test of the negative blood oxygen level (BOLD) responses during the working memory task also obtained during the placebo session. The file 2-backDZcorrelationInverse. img contains the results from the inverse correlation between working memory activation and diazepam plasma concentration. Finally, the files WordDZcorrelationInverse.img contains results from the inverse correlation between brain activation during the word generation task and diazepam plasma concentration discussed in Section 4.4.
(ZIP)
Acknowledgments
Linköping University and the County Council of Östergötland are gratefully acknowledged for financial support. Dr. Mattias Ragnehed and MD Irene Håkansson are acknowledged for their support in data collection.
Author Contributions
Conceived and designed the experiments: BS PL ME. Performed the experiments: MTN ME. Analyzed the data: SW MF MTN ME RS KL. Contributed reagents/materials/analysis tools: MTN. Wrote the paper: SW MF MTN PL KL ME.
References
1. Ogawa S, Lee TM, Kay AR, Tank DW. Brain magnetic resonance imaging with contrast dependent on blood oxygenation. Proc Natl Acad Sci U S A. 1990; 87: 9868–9872. PMID:2124706
2. Weisskoff RM, Kiihne S. MRI susceptometry: image-based measurement of absolute susceptibility of MR contrast agents and human blood. Magn Reson Med. 1992; 24: 375–383. PMID:1569876 3. Kim SG, Ogawa S. Biophysical and physiological origins of blood oxygenation level-dependent fMRI
signals. J Cereb Blood Flow Metab. 2012; 32: 1188–1206. doi:10.1038/jcbfm.2012.23PMID:
22395207
4. Attwell D, Buchan AM, Charpak S, Lauritzen M, Macvicar BA, Newman EA. Glial and neuronal control of brain blood flow. Nature. 2010; 468: 232–243. doi:10.1038/nature09613PMID:21068832 5. Zonta M, Angulu MC, Gobbo S, Rosengarten B, Hossmann K- A, Pozzan T, et al. Neuron-to-astrocyte
signaling is central to the dynamic control of brain microcirculation. Nature Neurosci. 2003; 6: 43–50.
PMID:12469126
6. Pellerin L and Magistretti PJ. Glutamate uptake into astrocytes stimulates aerobic glycolysis: A mecha-nism coupling neuronal activity to glucose utilization. Proc Nat Acad Sci U S A. 1994; 91: 10625–
10629.
7. Buzsaki G, Kaila K, Raichle M. Inhibition and brain work. Neuron. 2007; 56: 771–783. PMID:18054855 8. Lauritzen M, Mathiesen C, Schaefer K, Thomsen KJ. Neuronal inhibition and excitation, and the
dichotomic control of brain hemodynamic and oxygen responses. NeuroImage. 2012; 62: 1040–1050.
doi:10.1016/j.neuroimage.2012.01.040PMID:22261372
9. Mullinger KJ, Mayhew SD, Bagshaw AP, Bowtell R, Francis ST. Evidence that the negative BOLD response is neural in origin: A simultaneous EEG-BOLD-CBF study in humans. NeuroImage. 2014; 94: 263–274. doi:10.1016/j.neuroimage.2014.02.029PMID:24632092
10. Muthukumaraswamy SD, Evans CJ, Edden RAE, Wise RG, Singh KD. Individual variability in the shape and amplitude of the BOLD-HRF correlates with endogenous GABAergic inhibition. Hum Brain Mapp. 2012; 33: 455–465. doi:10.1002/hbm.21223PMID:21416560
11. Muthukumaraswamy SD, Edden RA, Jones DK, Swettenham JB, Singh KD. Resting GABA concentra-tion predicts peak gamma frequency and fMRI amplitude in response to visual stimulaconcentra-tion in humans. Proc Natl Acad Sci U S A. 2009; 106: 8356–8361. doi:10.1073/pnas.0900728106PMID:19416820 12. Northoff G, Walter M, Schulte RF, Beck J, Dydak U, Henning A, et al. GABA concentrations in the
human anterior cingulate cortex predict negative BOLD responses in fMRI. Nat Neurosci. 2007; 10: 1515–1517. PMID:17982452
14. Veselis RA, Reinsel RA, Beattie BJ, Mawlawi OR, Feshchenko VA, DiResta GR, et al. Midazolam changes cerebral blood flow in discrete brain regions: an H2(15)O positron emission tomography study. Anesthesiol. 1997; 87: 1106–1117.
15. Reinsel RA, Veselis RA, Dnistrian AM, Feshchenko VA, Beattie BJ, Duff MR. Midazolam decreases cerebral blood flow in the left prefrontal cortex in a dose-dependent fashion. Int J Neuropsychopharma-col. 2000; 3: 117–127. PMID:11343588
16. Paulus MP, Feinstein JS, Castillo G, Simmons AN, Stein MB. Dose-dependent decrease of activation in bilateral amygdala and insula by lorazepam during emotion processing. Arch Gen Psychiatry. 2005; 62: 282–288. PMID:15753241
17. Ragnehed M, Håkansson I, Nilsson M, Lundberg P, Söderfeldt B, Engström M. Influence of diazepam
on clinically designed FMRI. J Neuropsychiatry Clin Neurosci. 2007; 19: 164–172. PMID:17431063 18. Medford N, Critchley HD. Conjoint activity of anterior insular and anterior cingulate cortex: awareness
and response. Brain Struct Funct. 2010; 214: 535–549. doi:10.1007/s00429-010-0265-xPMID:
20512367
19. Hu Y, Chen X, Gu H, Yang Y. Resting-state glutamate and GABA concentration predict task-induced deactivation in the default mode network. J Neurosci. 2013; 33: 18566–18573. doi:10.1523/
JNEUROSCI.1973-13.2013PMID:24259578
20. Eklund A, Jonsson J, Schuberth J. A procedure for simultaneous screening and quantification of basic drugs in liver, utilizing capillary gas chromatography and nitrogen sensitive detection. J Anal Toxicol. 1983; 7: 24–28. PMID:6834794
21. Druid H, Holmgren P. A compilation of fatal and control concentrations of drugs in postmortem femoral blood. J Forensic Sci. 1997; 42: 79–87. PMID:8988577
22. Andersson JLR, Hutton C, Ashburner J, Turner R, Friston K. Modeling geometric deformations in EPI time series. NeuroImage. 2001; 13: 903–919. PMID:11304086
23. Vogt BA. Pain and emotion interactions in subregions of the cingulate gyrus. Nat Rev Neurosci. 2005; 6: 533–544. PMID:15995724
24. Vogt BA, Berger GR, Derbyshire SW. Structural and functional dichotomy of human midcingulate cor-tex. Eur J Neurosci. 2003; 18: 3134–3144. PMID:14656310
25. Pearson JM, Heilbronner SR, Barack DL, Hayden BY, Platt ML. Posterior cingulate cortex: adapting behavior to a changing world. Trends Cogn Sci. 2011; 15: 143–151. doi:10.1016/j.tics.2011.02.002
PMID:21420893
26. Maldjian JA, Laurienti PJ, Kraft RA, Burdette JH. An automated method for neuroanatomic and cytoarchitectonic atlas-based interrogation of fMRI data sets. NeuroImage. 2003; 19: 1233–1239.
PMID:12880848
27. Brett M, Anton JL, Valabregue R, Poline JB. Region of interest analysis using an SPM toolbox. In Org Hum Brain Mapp (OHBM). 2002, Sendai, Japan.
28. Power J D, Barnes KA, Snyder AZ, Schlaggar BL, Petersen SE. Spurious but systematic correlations in functional connectivity MRI networks arise from subject motion. NeuroImage. 2012; 59: 2142–2154.
doi:10.1016/j.neuroimage.2011.10.018PMID:22019881
29. Nadler SB, Hidalgo JH, Bloch T. Prediction of blood volume in normal human adults. Surgery. 1962; 51: 224–232. PMID:21936146
30. Wagner JG. Kinetics of pharmacologic response. I. Proposed relationships between response and drug concentration in the intact animal and man. J Theor Biol. 1968; 20: 173–201. PMID:5727238 31. Storn R, Price K. Differential Evolution—A Simple and Efficient Heuristic for Global 32.
32. Shader RI, Pary RJ, Harmatz JS, Allison S, Locniskar A, Greenblatt DJ. J Clin Psych. 1984; 45: 411–
413.
33. Cabeza R, Nyberg L. Imaging cognition II: An empirical review of 275 PET and fMRI studies. J Cogn Neurosci. 2000; 12: 1–47.
34. Munoz-Torres Z, Armony JL, Trejo-Martinez D, Conde R, Corsi-Cabrera M. Behavioural and neural effects of diazepam on a rule-guided response selection task. Neurosci Res. 2011; 70: 260–268. doi:
10.1016/j.neures.2011.03.009PMID:21458503
35. Shmuel A, Augath M, Oeltermann A, and Logothetis NK. Negative functional MRI response correlates with decreases in neuronal activity in monkey visual area V1. Nature Neurosci. 2006; 9: 569–577.
PMID:16547508
36. Braestrup C, Albrechtsen R, Squires RF. High densities of benzodiazepine receptors in human cortical areas. Nature. 1977; 269: 702–704. PMID:22814
37. Buxton RB. Dynamic models of BOLD contrast. NeuroImage. 2012; 62:953–961. doi:10.1016/j.
38. Harel N, Lee S-P, Nagaoka T, Kim D-S, Kim S-G. Origin of negative blood oxygenation level-dependent fMRI signals. J Cereb Blood Flow Metab. 2002; 22: 908–917. PMID:12172376
39. Schridde U, Khubchandani M, Motelow JE, Sanganahalli BG, Hyder F, Blumenfeld H. Negative BOLD with large increases in neuronal activity. Cereb Cortex. 2008; 18: 1814–1827. PMID:18063563 40. Chen ZG, Silva AC, Yang JH, Shen J. Elevated endogenous GABA level correlates with decreased
fMRI signals in the rat brain during acute inhibition of GABA transaminase. J Neurosci Res. 2005; 79: 383–391. PMID:15619231
41. Zilles K, Palomero-Gallagher N, Grefkes C, Scheperjans F, Boy C, Amunts K, et al. Architectonics of the human cerebral cortex and transmitter receptor fingerprints: reconciling functional neuroanatomy and neurochemistry. Eur Neuropsychopharmacol. 2002; 12: 587–599. PMID:12468022
42. Palomero-Gallagher N, Mohlberg H, Zilles K, Vogt B. Cytology and receptor architecture of human anterior cingulate cortex. J Comp Neurol. 2008; 508: 906–926. doi:10.1002/cne.21684PMID:
18404667
43. Palomero-Gallagher N, Vogt BA, Schleicher A, Mayberg HS, Zilles K. Receptor architecture of human cingulate cortex: evaluation of the four-region neurobiological model. Hum Brain Mapp. 2009; 30: 2336–2355. doi:10.1002/hbm.20667PMID:19034899
44. Matthew E, Andreason P, Pettigrew K, Carsoni RE, Herscovichv P, Cohen R, et al. Benzodiazepine receptors mediate regional blood flow changes in the livinghuman brain (H2150 positron-emission tomography). Proc Natl Acad Sci U S A. 1995; 92: 2775–2779. PMID:7708722
45. Krause BW, Wijtenburg A, Holcomb HH, Kochunov P, Wang DJJ, Hong LE, Rowland LM. Anterior cin-gulate GABA levels predict whole-brain cerebral blood flow. Neurosci Lett. 2014; 561: 188–191. doi:
10.1016/j.neulet.2013.12.062PMID:24397910
46. Donahue MJ, Rane S, Hussey E, Mason E, Pradhan S, Waddell KW, et al.γ-Aminobutyric acid (GABA)
concentration inversely correlates with basal perfusion in human occipital lobe. J Cereb Blood Flow Metab. 2014; 34: 532–541. doi:10.1038/jcbfm.2013.231PMID:24398941
47. Donahue MJ, Near J, Blicher JU, Jezzard P. Baseline GABA concentration and fMRI response. Neuro-Image. 2010; 53: 392–398. doi:10.1016/j.neuroimage.2010.07.017PMID:20633664
48. Mintzer MZ, Griffiths RR, Contoreggi C, Kimes AS, London ED, Ernst M. Effects of triazolam on brain activity during episodic memory encoding: a PET study. Neuropsychopharmacol. 2001; 25: 744–756. 49. Mintzer MZ, Kuwabara H, Alexander M, Brasic JR, Ye W, Ernst M, et al. Dose effects of triazolam on
brain activity during episodic memory encoding: a PET study. Psychopharmacol (Berl). 2006; 188: 445–461.
50. Raichle ME, MacLeod AM, Snyder AZ, Powers WJ, Gusnard DA, Shulman GL. A default mode of brain function. Proc Natl Acad Sci U S A. 2001; 98: 676–682. PMID:11209064
51. Mason MF, Norton MI, Van Horn JD, Wegner DM, Grafton ST, Macrae CN. Wandering minds: the default network and stimulus-independent thought. Science. 2007; 315: 393–395. PMID:17234951 52. Buckner RL, Andrews-Hanna JR, Schacter DL. The brain's default network: anatomy, function, and
rel-evance to disease. Ann N Y Acad Sci. 2008; 1124: 1–38. doi:10.1196/annals.1440.011PMID:
18400922
53. Tomasi D, Ernst T, Caparelli EC, Chang L. Common deactivation patterns during working memory and visual attention tasks: an intra-subject fMRI study at 4 Tesla. Hum Brain Mapp. 2006; 27: 694–705.
PMID:16404736
54. Fox MD, Snyder AZ, Vincent JL, Corbetta M, Van Essen DC, Raichle ME. The human brain is intrinsi-cally organized into dynamic, anticorrelated functional networks. Proc Nat Acad Sci U S A. 2005; 102: 9673–9678.
55. Gauffin H, van Ettinger-Veenstra H, Landtblom A-M, Ulrici D, McAllister A, Karlsson T, Engström M. Impaired language function in generalized epilepsy: Inadequate suppression of the default mode net-work. Epilepsy Behav. 2013; 28: 26–35. doi:10.1016/j.yebeh.2013.04.001PMID:23648277 56. McKiernan KA, D'Angelo BR, Kaufman JN, Binder JR. Interrupting the "stream of consciousness": an
fMRI investigation. NeuroImage. 2006; 29: 1185–1191. PMID:16269249
57. Weissman DH, Roberts KC, Visscher KM, Woldorff MG. The neural bases of momentary lapses in attention. Nat Neurosci. 2006; 9: 971–978. PMID:16767087
58. Greicius MD, Kiviniemi V, Tervonen O, Vainionpaa V, Alahuhta S, Reiss AL, et al. Persistent default-mode network connectivity during light sedation. Hum Brain Mapp. 2008; 29: 839–847. doi:10.1002/
hbm.20537PMID:18219620
60. Roy-Byrne PP, Uhde TW, Holcomb H, Thompson K, King AK, Weingartner H. Effects of diazepam on cognitive processes in normal subjects. Psychopharmacol (Berl). 1987; 91: 30–33.
61. Buffett-Jerrott SE, Stewart SH. Cognitive and sedative effects of benzodiazepine use. Curr Pharm Des. 2002; 8: 45–58. PMID:11812249
![Fig 4. DZ-related negative BOLD responses. The figure shows mean BOLD responses in the anterior midcingulate cortex [0, 18, 21] for three subjects with DZ plasma concentration > 0.1 mg/L during the 2-back, 1-back, and 0-back tasks](https://thumb-eu.123doks.com/thumbv2/123dok_br/16433548.196158/10.918.53.838.118.581/related-negative-responses-responses-anterior-midcingulate-subjects-concentration.webp)
