Communications in Plant Sciences (July-December 2014) 4(3-4): 55-61 ISSN 2237-4027
www.complantsci.wordpress.com
Manuscript accepted on August 01, 2014 / Manuscript published online on August 05, 2014
Levels of nitrogen and iodosulfuron + mesosulfuron
affecting the wheat competitive ability against weeds
Mahdi Zare*
Department of Agriculture, Abadeh Branch, Islamic Azad University, Abadeh, Fars, Iran
Shole Shamshin
Department of Agriculture, Arsanjan Branch, Islamic Azad University, Arsanjan, Fars, Iran
Sansan Ghasemi
College of Agriculture, Shiraz Branch, Islamic Azad University, Shiraz, Fars, Iran
ABSTRACT
The trial was a split plot experiment based on randomized complete block design (RCBD) with four replications in Abadeh, Fars, Iran, during 2010-2011 growing seasons. The treatments were consisted of three levels of nitrogen (200, 300, and 400 kg ha-1) and four herbicide application levels (53, 68, 83, and 97 g ha-1). Interaction effects of N fertilizer×herbicide levels on number spike per m2, number of kernels spike-1, 1000-seed weight, harvest index, seed yield, number of wild oat, number of common mallow and common mallow dry matter weight were significant. The maximum seed yield was related to 300 kg ha-1 N fertilizer with 97 g ha-1 herbicide treatment (3,526 kg ha-1) and the minimum seed yield was belonged to 200 kg ha-1 N fertilizer with 53 g ha-1 herbicide treatment (2,242 kg ha-1). Number of spikes m-2 was the most important trait contributing to the grain yield in wheat. In conclusion, weed control was essential for efficient use of N fertilizer by the crop. Therefore, integration of N fertilization and herbicide is recommended for the region to increase wheat grain yield.
Keywords: Commom mallow, N fertilizer, wild oat.
_______________________________ *Corresponding author
INTRODUCTION
Weeds are one the main limiting factor in crop production (Enan 2003). Wild oat (Avena fatua) is one of the most interfering weed in cereal producing area and has been adapted with wide range of agro-climate conditions, and therefore consider as one of the main constrains in cereal production. Influence of certain weed on wheat depends on species, weed density, cultivar, rate and time of fertilizer consumption, planting date and time and other ecological and agricultural factors. Fertilization management from view of time and rate of applied fertilizer is an important factor in optimize crop production and weed management (E-Kivi and E-Somarin 2011). Common mallow (Malva sylvestris) weed is also among the most common and problematic weeds in the world (Zahedi and Alemzadeh Ansari 2011).
Despite fertilizers application can increase crop yield in weed free condition (E-Kivi and E-Somarin 2011) but at the same time can increase weed biomass and density, which may increase seed production by weed reported that ability of wild oat for nitrogen absorption is higher than wheat which can result in higher growth of this weed and therefore may reducing wheat yield at the higher rate (Khan and Amanullah 2007). Weed competition with spring barley
(Hordeum vugare L.) for nitrogen was studied by
Petersen (2003).
El-Bawab and Kholousy (2003) reported that controlling weeds by herbicidal treatments increased grain yield by about 40.3 and 13.6%, compared with unweeded and hand weeding treatments, respectively. Simply replacing herbicides by other direct control measures is inadequate. Instead, weed management should be seen as a component of integrated crop management (Kruidhof et al. 2009). Management methods that decrease requirement for agricultural chemicals are needed to reduce adverse environmental impacts (Bilalis et al. 2009).
The phytotoxic effect of foramsulfuron in wheat was increased by using nitrogen fertilizer (Bunting et al. 2004). The combination of herbicide and fertilizer may exceed the weed control three fold in wheat (Agladze and Chabukiani 2003). Use of urea as adjuvant resulted in lower densities of both the weeds. This might have been due to increased retention of herbicide on the leaves (Zadorozhny 2004). The results are in line with those of Bunting et al (2004) who reported increase in herbicide efficiency due to use of urea.
Nitrogen is the major nutrient added to increase crop yield (Camara et al. 2003), but it is not always recognized that altered soil N levels can affect crop–weed competitive interactions. Many weeds are
high-N consumers (Hans and Johnson 2002), thus limiting N for crop growth. Weeds not only reduce the amount of N available to crops, but the growth of many weed species also is enhanced by higher soil N levels (Blackshaw et al. 2003). Delaying N applications, applying slow-release N fertilizers, or placing N below the weed seed germination zone could be potential strategies for reducing early season weed establishment in integrated cropping systems (Sweeney et al. 2008).
The objective of this work was to evaluate the impact of herbicides levels in combination with nitrogen fertilizer levels on weed suppression in wheat planted plots. Since optimum herbicide level and nitrogen requirement for wheat mostly determined in weed free condition and this finding can changed in presence of competition and determine the effects of nitrogen fertilizer and herbicide levels on competitive ability of winter wheat against wild oat and common mallow weeds.
MATERIAL AND METHODS
This experiment was conducted at experimental field, Abadeh, Fars, Iran, located 2,030 meters above the mean sea level with a longitude 52o 40’ E and latitude of 31o 7’ N average rainfall of 116.4 mm, min temperature of -4 and max of 36°C by planting wheat, to investigate the effect of different levels of nitrogen and herbicide on wheat (Triticum aestivum cv. Omid) competitive ability against weeds.
The experimental design was a split-plot with four replications. The main factor was 3 nitrogen (N) levels including 200, 300 and 400 kg ha-1 in form of urea 46% (1/3 pre-plant and the rest was broadcasted
at crop jointing stage) and the sub factor was 4 Chevalier herbicide (iodosulfuron-methyl-sodium +
mesosulfuron-methyl) application levels (53, 68, 83 and 97 g ha-1). Each experimental plot area had 12 m2 with 3×4 dimensions. Each plot was consisted of 10 rows of wheat. In addition, the distance between main plots was estimated two meters. Whereas the plant distance on each row was 6 cm and the rows were 30 cm far from each other.
at the time of planting while, nitrogen was applied in two split doses. First half with the first irrigation and the remaining half at the early boot leaf stage. Prior to planting seeds were inoculating with Carboxy Tiraman fungicide. The herbicides were applied with a knapsack sprayer during mid-January 2011, after first irrigation, when the soil was in an adequate moisture status. Spray the herbicides successfully all the precautionary measures were adopted so as to avoid any danger of physical exposure to the herbicides. To the weed-free control plots, weeds were removed by hand in all growth season. Weeds, sampled in 1 m2 quadrate per plot, were removed by hand at wheat crop maturity stage, and total weed density were determined. Then, samples were immediately dried in a dry oven at 70°C for 48 h and weighted. The studied traits were number of spikes m-2, number of spikelets spike-1, number of kernels spike-1, 1000-grain weight (g), harvest index (%), seed yield (kg ha-1), number of wild oat, number of common mallow, wild oat dry matter weight (g m-2) and common mallow dry matter weight (g m-2).
Analysis of variance was performed using SAS (2001) software. We applied Duncan's Multiple Range Test at 0.05 probability level for means comparison, when the F values were significant.
RESULTS AND DISCUSSION
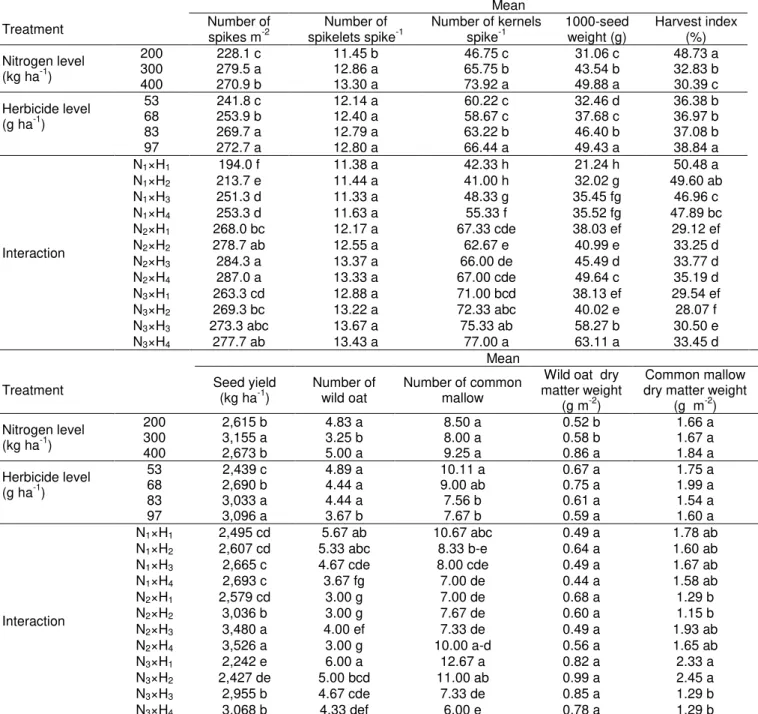
The results indicated that the effect of different N fertilizer levels were significant for all studied traits, except for number of common mallow and common mallow dry matter weight (Table 1). The maximum and minimum number of spike m-2 belonged to 300 and 200 kg ha-1 N fertilizer levels (279.5 and 228.1, respectively) (Table 2). The increase in number of spike m-2 and grain yield with application of nitrogen has also been reported (Akhtar 2001, Naeem 2001, Jatoi 2003). Comparatively lower grain yield obtained with 200 kg ha-1 N could be attributed to poor nutrition to the crop because of insufficient nitrogen uptake. The maximum number of spikelets spike-1 was related to 400 and 300 kg ha-1 N fertilizer (13.30 and 12.86, respectively) and the minimum number of
spikelets spike-1 was belonged to 200 kg ha-1 N fertilizer (11.45) (Table 2). The maximum and
minimum number of kernels spike-1 was reported while 400 and 200 kg ha-1 N fertilizer treatments were applied (73.92 and 46.75, respectively) (Table 2). Similar result was also reported (Gundapur and Bhatti 1993).
Result illustrated that maximum and minimum 1000-seed weight was related to 400 and 200 kg ha-1 N Fertilizer treatment (49.88 and 31.06 g, respectively) (Table 2). This was an expected finding, because
wheat is known to respond positively to higher soil nitrogen (Raun and Johnson 1999). Similar results were also reported by other researchers (Turk et al. 2003, Abd Alla 2004, Khedr and Nemeat Alla 2006, El-Sheref et al. 2007, Blackshaw and Brandt 2008, Nassar 2008).
The maximum and minimum harvest index was related to 200 and 400 kg ha-1 N fertilizer (48.73 and 30.39%, respectively) (Table 2). It can be due to higher influence of N fertilizer on biological yield compared with grain yield. The increase in straw yield with application of nitrogen has also been reported (Akhtar 2001, Naeem 2001, Jatoi 2003).
Comparison means showed that consumption 300 kg ha-1 N fertilizer had maximum seed yield (3,155 kg ha-1). On the other hand, minimum seed yield was belonged to 200 kg ha-1 N fertilizer (2,615 kg ha-1) (Table 2). These results were in close agreement with findings of other researchers (Bellido et al. 2000, Turk et al. 2003, Abd Alla 2004, Khedr and Nemeat Alla 2006, El-Sheref et al. 2007, Blackshaw and Brandt 2008, Nassar 2008). Decreasing in wheat yield loss by adding N was reported by another researcher (Pourreza et al. 2010). They also reported that N supply increased wheat yield when it compete to wild oat.
The highest and lowest number of wild oat was related to 200 and 300 kg ha-1 N Fertilizer treatment (5.00 and 3.25, respectively) (Table 2). In one research showed that excess of N increased green foxtail biomass, while wheat biomass was constant (Peterson and Nalewaja 1992). Our results were also in agreement with the work of researcher who demonstrated that with increasing height and leaf area growth, velvetleaf (Abutilon theophrasti) aboveground biomass was more increased by nitrogen addition (Barker et al. 2006).
The treatments 400 and 200 kg ha-1 N fertilizer were the highest and lowest wild oat dry matter weight (0.86 and 0.52 g m-2, respectively), indicating that herbicides reduced weeds biomass (Table 2). One researcher reported that N supply directly correlates with weed competition and their competitive ability in wheat (Iqbal and Wright 1997). Another researcher accounted that addition of N increased the competitive ability of corn against weeds and resulted in higher grain yield (Najafi and Ghadiri 2012).
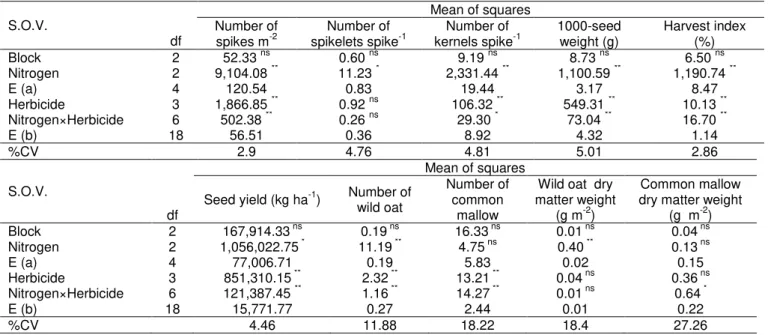
Table 1. Mean of squares of studied traits in wheat.
S.O.V.
df
Mean of squares Number of
spikes m-2
Number of spikelets spike-1
Number of kernels spike-1
1000-seed weight (g)
Harvest index (%)
Block 2 52.33 ns 0.60 ns 9.19 ns 8.73 ns 6.50 ns
Nitrogen 2 9,104.08 ** 11.23 * 2,331.44 ** 1,100.59 ** 1,190.74 **
E (a) 4 120.54 0.83 19.44 3.17 8.47
Herbicide 3 1,866.85 ** 0.92 ns 106.32 ** 549.31 ** 10.13 **
Nitrogen×Herbicide 6 502.38 ** 0.26 ns 29.30 * 73.04 ** 16.70 **
E (b) 18 56.51 0.36 8.92 4.32 1.14
%CV 2.9 4.76 4.81 5.01 2.86
S.O.V.
Mean of squares
df
Seed yield (kg ha-1) Number of wild oat
Number of common
mallow
Wild oat dry matter weight
(g m-2)
Common mallow dry matter weight
(g m-2)
Block 2 167,914.33 ns 0.19 ns 16.33 ns 0.01 ns 0.04 ns
Nitrogen 2 1,056,022.75 * 11.19 ** 4.75 ns 0.40 ** 0.13 ns
E (a) 4 77,006.71 0.19 5.83 0.02 0.15
Herbicide 3 851,310.15 ** 2.32 ** 13.21 ** 0.04 ns 0.36 ns
Nitrogen×Herbicide 6 121,387.45 ** 1.16 ** 14.27 ** 0.01 ns 0.64 *
E (b) 18 15,771.77 0.27 2.44 0.01 0.22
%CV 4.46 11.88 18.22 18.4 27.26
OBS.: ns, * and **: Not significant, significant at the 5% and 1% levels of probability, respectively.
Use of urea as adjuvant resulted in lower densities of both the weeds. This might have been due to increased retention of herbicide on the leaves (Zadorozhny 2004). The results were in line with another researcher who reported increase in herbicide efficiency due to use of urea (Bunting et al. 2004). Similar results on the significant interaction between the competitive ability of wheat cultivar and controlling weeds by tribenuron-methyl was reported (Christensen 1995).
Results of comparison means illustrated that maximum and minimum number of kernels spike-1 was belonged to 97 and 68 g ha-1 herbicide treatments (66.44 and 58.67, respectively) (Table 2). These results were corroborated with the results of researchers who concluded that herbicidal applications produce more grains spike-1 than the untreated control (Khan et al. 2002, Khan et al. 2003).
The treatments 97 and 53 g ha-1 herbicide had the highest and lowest 1000-seed weight (49.43 and 32.46 g, respectively) (Table 2). The positive effect of weeded practices on wheat yields and its components have been reported (Metwally et al. 2000, Turk et al. 2003, El-Metwally and El-Rokiek 2007).
The treatments 97 and 53 g ha-1 herbicide treatments also had the maximum and minimum harvest index (38.84 and 36.38%, respectively) (Table 2). Herbicides can affect the nitrate accumulation by perhaps altering the cyclic to non-cyclic photophosphorylation ratio and increasing translocation of nitrogen into the grain (Group C herbicides) or by possibly affecting the enzyme nitrate reductase (Pandey and Srivastava 1985).
Comparison means indicated that maximum and minimum seed yield was reported while there were 97
and 53 g ha-1 herbicide (3096 and 2439 kg ha-1, respectively) (Table 2). In this concern, a researcher mentioned that weeds compete very effectively with the crop for available nitrogen to the point that the reduction in yields from weed competition are generally accompanied by reduction in protein content as well (Friesen et al. 1960).
Results showed that the maximum and minimum number of wild oat was belonged to 53 and 97 g ha-1 herbicide treatment (4.89 and 3.67, respectively) (Table 2). These results are supported by other researchers, who reported that herbicide treatments significantly decreased the weed population over weedy control (Hashim et al. 2002, Cheema and Akhtar 2005).
Application of 53 and 83 g ha-1 herbicide treatment had maximum and minimum number of common mallow (10.11 and 7.56, respectively). These results were in accordance with those recorded by other researchers (Turk et al. 2003, Blackshaw and Brandt 2008, Nassar 2008).
One research showed chemical control as a highly effective and economical weed control approach (Hassan et al. 2003). The results were also similar to those of another researchers who reported that Puma Super 75EW (1250 ml ha-1) as a chemical weed control caused 86.5 percent weed mortality in wheat crop (Jarwar et al. 2005).
Table 2. Effect of nitrogen, herbicide and nitrogen×herbicide interaction effects on studied traits in wheat.
Mean
Treatment Number of
spikes m-2
Number of spikelets spike-1
Number of kernels spike-1
1000-seed weight (g)
Harvest index (%)
Nitrogen level (kg ha-1)
200 228.1 c 11.45 b 46.75 c 31.06 c 48.73 a
300 279.5 a 12.86 a 65.75 b 43.54 b 32.83 b
400 270.9 b 13.30 a 73.92 a 49.88 a 30.39 c
Herbicide level (g ha-1)
53 241.8 c 12.14 a 60.22 c 32.46 d 36.38 b
68 253.9 b 12.40 a 58.67 c 37.68 c 36.97 b
83 269.7 a 12.79 a 63.22 b 46.40 b 37.08 b
97 272.7 a 12.80 a 66.44 a 49.43 a 38.84 a
Interaction
N1×H1 194.0 f 11.38 a 42.33 h 21.24 h 50.48 a
N1×H2 213.7 e 11.44 a 41.00 h 32.02 g 49.60 ab
N1×H3 251.3 d 11.33 a 48.33 g 35.45 fg 46.96 c
N1×H4 253.3 d 11.63 a 55.33 f 35.52 fg 47.89 bc
N2×H1 268.0 bc 12.17 a 67.33 cde 38.03 ef 29.12 ef
N2×H2 278.7 ab 12.55 a 62.67 e 40.99 e 33.25 d
N2×H3 284.3 a 13.37 a 66.00 de 45.49 d 33.77 d
N2×H4 287.0 a 13.33 a 67.00 cde 49.64 c 35.19 d
N3×H1 263.3 cd 12.88 a 71.00 bcd 38.13 ef 29.54 ef
N3×H2 269.3 bc 13.22 a 72.33 abc 40.02 e 28.07 f
N3×H3 273.3 abc 13.67 a 75.33 ab 58.27 b 30.50 e
N3×H4 277.7 ab 13.43 a 77.00 a 63.11 a 33.45 d
Mean
Treatment Seed yield
(kg ha-1)
Number of wild oat
Number of common mallow
Wild oat dry matter weight
(g m-2)
Common mallow dry matter weight
(g m-2)
Nitrogen level (kg ha-1)
200 2,615 b 4.83 a 8.50 a 0.52 b 1.66 a
300 3,155 a 3.25 b 8.00 a 0.58 b 1.67 a
400 2,673 b 5.00 a 9.25 a 0.86 a 1.84 a
Herbicide level (g ha-1)
53 2,439 c 4.89 a 10.11 a 0.67 a 1.75 a
68 2,690 b 4.44 a 9.00 ab 0.75 a 1.99 a
83 3,033 a 4.44 a 7.56 b 0.61 a 1.54 a
97 3,096 a 3.67 b 7.67 b 0.59 a 1.60 a
Interaction
N1×H1 2,495 cd 5.67 ab 10.67 abc 0.49 a 1.78 ab
N1×H2 2,607 cd 5.33 abc 8.33 b-e 0.64 a 1.60 ab
N1×H3 2,665 c 4.67 cde 8.00 cde 0.49 a 1.67 ab
N1×H4 2,693 c 3.67 fg 7.00 de 0.44 a 1.58 ab
N2×H1 2,579 cd 3.00 g 7.00 de 0.68 a 1.29 b
N2×H2 3,036 b 3.00 g 7.67 de 0.60 a 1.15 b
N2×H3 3,480 a 4.00 ef 7.33 de 0.49 a 1.93 ab
N2×H4 3,526 a 3.00 g 10.00 a-d 0.56 a 1.65 ab
N3×H1 2,242 e 6.00 a 12.67 a 0.82 a 2.33 a
N3×H2 2,427 de 5.00 bcd 11.00 ab 0.99 a 2.45 a
N3×H3 2,955 b 4.67 cde 7.33 de 0.85 a 1.29 b
N3×H4 3,068 b 4.33 def 6.00 e 0.78 a 1.29 b
OBS.: ns, * and **: Not significant, significant at the 5% and 1% levels of probability, respectively.
Means in each column, followed by similar letter(s) are not significantly different at 5% probability level, using Duncan's Multiple Range Test.
spike m-2 (194) (Table 2). In other researches, application of the tank mixed herbicides reduced broad and narrow leaf weeds to a varying degree sometimes approaching 100% (Khan et al. 2002, Khan et al. 2003).
The highest number of kernels spike-1 was 400 kg ha-1 N fertilizer with 97 g ha-1 herbicide treatment and the lowest number of kernels spike-1 was 200 kg ha-1 N fertilizer with 68 g ha-1 herbicide treatment (77 and 41, respectively) (Table 2). This finding corroborated the researcher who reported that based on weed species and densities, adding N can increase the competitive ability of weed more than that of the crop (Peterson and Nalewaja 1992).
increase in wheat dry matter accumulation and grain yield which reduced competition effects of wild oat. In fact, nitrogen changes the competitiveness of plants (Henson and Jordan 1982).
The number of spikes per unit area is the most important trait contributing to the grain yield in wheat. The increase in wheat yield with increasing N-levels might due to promotes tillering in cereals and encourages the formation of more spikes plant-1 and increasing grain yield plant-1 could be attributed to its simulative effect of the vegetative growth which increased the photosynthetic rate, spikes number plant-1, number of spikletes spike-1, spike length and grains number spike-1 may account for the superiority of grain yield (El-Metwally et al. 2010).
Interaction effect of N fertilizer×herbicide levels on seed yield was significant (P = 0.01) (Table 1). It should be pointed out that maximum seed yield to 300 kg ha-1 N fertilizer with 97 g ha-1 herbicide treatment (3,526 kg ha-1) and minimum seed yield to 400 kg ha-1 N fertilizer with 53 g ha-1 herbicide treatment was recorded (Table 2). These findings were in a close conformity with one researcher who reported a differential response of various herbicides on the grain yield of wheat (Azad et al. 1997). Another researcher demonstrated that wheat yield loss resulting from wild oat competition increased with enhancement of nitrogen supply (Carlson and Hill 1985). The increasing at crop loss resulted from weed competition at high fertility may be due to the greater plasticity of weeds in responding to available resources (Barker et al. 2006).
Means comparison showed that application of 400 kg ha-1 N fertilizer level with 53 g ha-1 herbicide treatment had maximum number of wild oat (6). Also application of 53, 68 and 97 g ha-1 herbicide treatment in additional 300 kg ha-1 N fertilizer treatment had minimum number of wild oat (3) (Table 2). In one research showed that nitrogen levels caused a significant effect on number and dry weight of broadleaved, grasses and total weeds (El-Metwally et al. 2010).
The maximum number of common mallow was related to 400 kg ha-1 N fertilizer treatment in additional 53 g ha-1 herbicide treatment (12.67) and minimum number of common mallow was belonged to 400 kg ha-1 N fertilizer treatment in additional 97 g ha-1 herbicide treatment (6) (Table 2). Similar results were obtained by another research (Turk et al. 2003).
Maximum common mallow dry matter weight was related to 68 g ha-1 herbicide treatment in additional 400 N fertilizer kg ha-1 (2.45 g m-2) (Table 2). Confirming results in this respect were cited by El-Metwally and El-Rokiek (2007).
CONCLUSION
The overall results indicated that application of nitrogen can increase competitive ability in winter wheat under wild oat infestation. Increasing plant density reduces the biomass production of wild oat. Wild oat through reducing the number of fertile tillers and that of the spikes per unit area also reduces the economic yield of wheat. We can reduce harmful effects of wild oat (if not controlled) by using high plant density or adequate utilization of nitrogen.
A tactical approach to nitrogen application as part of an IWM strategy will reduce the production of excessive weed biomass and limit replenishment of the weed. This has repercussions for herbicide use and delaying the onset of herbicide resistance. If a pre-sowing soil test shows high levels of nitrogen, then delaying the application of nitrogenous fertilizer will be beneficial to wheat yield if weeds are a problem. When dealing with herbicide resistant weeds, fertilizer application can play a role in reducing weed vigor and seed production. This provides farmers with another option in managing problem weeds. Further studies are required over a wider range of environments to fully understand the relationship between nitrogen placements in an IWM strategy.
References
Abd Alla MM. 2004. Influence of nitrogen level and its application time on yield and quality of some new hull - less barley. J Agric Sci 29: 2201–2216.
Agladze GDD, Chabukiani M. 2003. Effect of herbicide and mineral fertilizers on yield and quality of fodder maize. Kormoproizovodstvo 10: 23–25.
Akhtar MM. 2001. Effect of varying levels of nitrogen on growth and yield performance of two new wheat cultivars. M.Sc Thesis SKUAST-K pp.84–86.
Azad BS, Harbans S, Singh H. 1997. Effect of time, methods of application of herbicide and nitrogen on weed-control in wheat. Annals Agric Res 18: 174–177.
Barker DC, Knezevic SZ, Martin AR, Walters DT, Lindquist JL. 2006. Effect of nitrogen addition on the comparative productivity of corn and velvetleaf (Abutilon theophrasti). Weed Sci 54: 354–363. Bellido LP, Bellido RJL, Castillo JE, Bellido FJL. 2000. Effect of
tillage, crop rotation and nitrogen fertilization on wheat under rainfed Mediterranean conditions. Agron J 92: 1054–1063. Bilalis D, Karkanis A, Efthimiadou A. 2009. Effects of two legume
crops, for organic green manure - on weed flora, under Mediterranean conditions: Competitive ability of five winter season weed species. Afr J Agr Res 4: 1431–1441.
Blackshaw RE, Brandt RN, Janzen HH, Ents T, Grant CA, Derksen DA. 2003. Differential response of weed species to added nitrogen. Weed Sci 51: 532–539.
Blackshaw RE, Brandt RN. 2008. Nitrogen fertilizer rate effects on weedcompetitivenessisspeciesdependent.WeedSci56:74–747. Bunting JA, Sprague CL, Riechers DE. 2004. Prope adjuvant
selection for foramusulfuron activity. Crop Prot 23: 361–366. Camara KM, Payne WA, Rasmussen PE. 2003. Long-term effects of
Carlson HL, Hill JE. 1985. Wild oat (Avena fatua) competition with spring wheat: effects of nitrogen fertilization. Weed Sci 34: 29–33. Cheema MS, Akhtar M. 2005. Efficacy of different post emergence
herbicides and their application methods in controlling weeds in wheat. Pak J Weed Sci Res 11: 23–29.
Christensen S. 1995. Weed suppression ability of spring barley varieties. Weed Res 35: 241–247.
E-Kivi MP, E-Somarin SJ. 2011. The Comparison Lentil Varieties in Competition with Weeds. Adv Environ Biol 5: 1976–1978.
El-Bawab AMO, Kholousy AO. 2003. Effect of seeding rate and method of weed control on the productivity of Giza 2000, a promising barley line, under new lands condition. Egypt J Agric Res 8: 1085–1098.
El-Metwally IM, El-Rokiek KG. 2007. Response of wheat plants and accompanied weeds to some new herbicides alone or combined in sequence. J Agric Sci 15: 513–525.
El-Metwally IM, Abd El-Salam MS, Tagour RMH. 2010. Nitrogen fertilizer levels and some weed control treatments effects on barley and associated weeds. Agr Biol J N Am 1: 992–1000.
El-Sheref EEM, Omar AM, El-Hag AA, Shahen AM. 2007. Effect of some agricultural treatments on barley yield and some technological characters. J Agric Sci 32: 1671–1690.
Enan MR. 2009. Genotoxicity of the herbicide 2, 4-dichlorophenoxyacetic acid (2,4-D): Higher plants as monitoring systems. Am-Eurasian J Sustain Agric 3: 452–459.
Friesen G, Shebeski LH, Robinson AD. 1960. Economic losses caused by weed competition in Manitoba grain fields II. Effect of weed competition on the protein content of cereal crops. Can J Plant Sci 40: 652–658.
Gundapur M, AK, Bhatti A. 1993. Effect of N and P levels on the yield of wheat cultivars. Pakistan J Agri Res 4: 41–43.
Hans SR, Johnson WG. 2002. Influence of Shattercane (Sorghum bicolor L.) Interference on Corn (Zea mays L.) Yield and Nitrogen Accumulation. Weed Tech 16: 787–791.
Hashim S, Marwat KB, Hassan G. 2002. Response of wheat varieties to substituted herbicides. Pak J Weed Sci Res 8: 49–56. Hassan G, Faiz B, Marwat K. B, Khan M. 2003. Effect of planting
methods and tank mixed herbicides on controlling grassy and broad leaf weeds and their effect on wheat cv. Fakhr-e -Sarhad. Pak J Weed Sci Res 9: 1–11.
Henson JF, Jordan LS. 1982. Wild oat (Avena fatua) competition with wheat (Triticum aestivum and Triticum turgidum durum) for nitrate. Weed Sci 30: 297–300.
Iqbal J, Wright D. 1997. Effects of nitrogen supply on competition between wheat and three weed species. Weed Res 37: 391–400. Jarwar AD, Arain MA, Rajput LS. 2005. Chemical weed control in
wheat. Pak J Weed Sci Res 11: 11–15.
Jatoi SA. 2003. Effect of different nitrogen levels and placement on yield and yield attributes of wheat. Thesis, M.Sc, (Hons.) SKUAST-K.
Khan MA, Marwat KB, Gul H, Naeem K. 2002. Impact of weed management on maize (Zea mays L) planted at night. Pak J Weed Sci Res 8: 57–62.
Khan N, Hassan G, Marwat, KB, Khan MA. 2003. Efficacy of different herbicides for controlling weeds in wheat crop at different times of application – II. Asian J Plant Sci 2: 310–313.
Khan GA, Amanullah MS. 2007. Response of Dhalia (Dhalia pinnata) to Different Levels of nitrogen alone and in combinaiton with constant doses of phosphorus and potassium. Am-Eurasian J Sustain Agric 1: 25–31.
Khedr AH, Nemeat Alla EAE. 2006. Response of barley to intercropping with sugar beet under different nitrogen fertilization levels. J Agric Sci 31: 4957–4968.
Kruidhof HM, Bastiaans L, Kropff MJ. 2009. Cover crop residue management for optimizing weed control. Plant Soil 318: 169–184. Metwally GM, Hassan AAA, Ahmed SA. 2000. Influence of some herbicides on barley yield and yield components and the common associated weeds. J Agric Sci 25: 6009–6019.
Mohajeri F, Ghadiri H. 2003. Competition of different densities of wild mustard (Brassica kaber) with winter wheat (Triticum aestivum) under different levels of nitrogen fertilizer application. Iran J Agric Sci 34: 527–537.
Naeem M. 2001. Growth, radiation use efficiency and yield of new cultivars of wheat under variable nitrogen rates. Summary, Thesis or, Dissertation, Non – Conventional, Bibliography. pp.128. Najafi B, Ghadiri H. 2012. Weed control and grain yield response to
nitrogen management and herbicides. J Biol Environ Sci 6:39–47. Nassar ANM. 2008. Response of two barley varieties to mineral and
biological nitrogenous fertilizer and weed control treatments. J Agric Sci 33: 29–51.
Pandey M, Srivastava GP. 1985. Nitrate reductase activity in wheat leaves as influenced by herbicide application and its relationship with grain protein content. Ind J Agric Chem 18: 239–245. Petersen J. 2003. Weed: spring barley competition for applied
nitrogen in pig slury. Weed Res 43: 33–39.
Peterson DA, Nalewaja JD. 1992. Environment influences green foxtail competition with wheat. Weed Tech 6: 607–610.
Pourreza J, Bahrani A, Karami S. 2010. Effect of nitrogen fertilization application on simulating wheat (Triticum aestivum) yield loss caused by wild oat (Avena fatua) interference. American- Eurasian J Agric Environ Sci 9: 55–61.
Raun WR, Johnson GV.1999. Improving nitrogen use efficiency for cereal production. Agron J 9: 357–363.
SAS Institute. 2001. SAS user’s guide. Version 8. SAS Institute Inc
Cary, NC.
Sweeney AE, Renner KA, Laboski C, Davis A. 2008. Effect of Fertilizer Nitrogen on Weed Emergence and Growth. Weed Sci 56: 714–721.
Turk MA, Tawaha AM, Samarah N, Allataifeh N. 2003. The response of awnless six row barley (Hordeum vulgare L.) to nitrogen fertilizer application and weed control methods in the absence of moisture stress. Pak J Agron 2: 101–108.
Zadorozhny V. 2004. Herbicide based strategies for maize to prevent development of resistance in weeds in Ukraine. Weed Management Proceedings of 14th Australian weed conference, Waggza Wagga, New south Wales Australia. 6-9 September, pp. 290-293.
Zahedi SM, Alemzadeh Ansari N. 2011. Allelopathic Potential of Common Mallow (Malva sylvestris) on the Germination and the Initial Growth of Tomato, Cucumber and Cress. Asian J Agric Sci 3: 235–241.