(Annals of the Brazilian Academy of Sciences) ISSN 0001-3765
www.scielo.br/aabc
The
15N isotope to evaluate fertilizer nitrogen absorption efficiency
by the coffee plant
TATIELE A.B. FENILLI1, KLAUS REICHARDT2, OSNY O.S. BACCHI2, PAULO C.O. TRIVELIN2 and DURVAL DOURADO-NETO3
1Universidade Regional de Blumenau, FURB/Campus II, Rua São Paulo, 3250, Itoupava Seca
89030-000 Blumenau, SC, Brasil
2Centro de Energia Nuclear na Agricultura, CENA-USP, Av. Centenário 303, São Dimas, Caixa Postal 96
13400-970 Piracicaba, SP, Brasil
3Escola Superior de Agricultura “Luiz de Queiroz”, ESALQ-USP, Av. Pádua Dias 11, Agronomia, Caixa Postal 9
13400-970 Piracicaba, SP, Brasil
Manuscript received on January 23, 2007; accepted for publication on September 9, 2007; contributed byKLAUSREICHARDT*
ABSTRACT
The use of the15N label for agronomic research involving nitrogen (N) cycling and the fate of fertilizer-N is well established, however, in the case of long term experimentation with perennial crops like citrus, coffee and rubber tree, there are still shortcomings mainly due to large plant size, sampling procedures, detection levels and interferences on the system. This report tries to contribute methodologically to the design and development of15N labeled fertilizer experiments, using as an example a coffee crop fertilized with15N labeled ammonium sulfate, which was followed for two years. The N of the plant derived from the fertilizer was studied in the different parts of the coffee plant in order to evaluate its distribution within the plant and the agronomic efficiency of the fertilizer application practice. An enrichment of the fertilizer-N of the order of 2%15N abundance was sufficient to study N absorption rates and to establish fertilizer-N balances after one and two years of coffee cropping. The main source of errors in the estimated values lies in the inherent variability among field replicates and not in the measurements of N contents and 15N enrichments of plant material by mass-spectrometry.
Key words:experimental design, replicate variability, stable isotope methodology, perennial crop.
INTRODUCTION
The study of soil-plant relationships in agricultural crops through the use of radioactive or stable isotopes as tracers is well established and successfully achieved in a variety of situations (Reichardt and Bacchi 2004). In the case of experimentation over long periods of time the employ-ment of radioactive isotopes becomes limited in many cases due to the inexistence of a specific isotope of a suf-ficiently long half life that would be compatible with the experimental period, allowing its detection up to the end
*Member Academia Brasileira de Ciências Correspondence to: Klaus Reichardt E-mail: [email protected]
of the evaluations. In these cases, when a specific and suitable stable isotope is available for the study, its use is more advantageous in relation to the radioisotopes.
For studies on nitrogen (N) cycling involving both environmental and agronomic aspects, the isotope 15N
has been extensively used as a label of natural changes of the15N/14N ratio throughδ◦/◦◦ values or as a label of imposed changes of15N abundances, employing
nitroge-nous materials enriched to levels much above the natural
15N abundance. Hardarson (1990) thoroughly explained
the methodological aspects of the use of the15N tracer
In the agronomic literature the number of studies that employ15N as a tracer is high for annual crops, crop
sequences and management practices, either planted in the field or cultivated in controlled environments. For perennial crops, however, such studies are published in a much lower volume, mainly due to the larger stature of the plants and longer life cycle, which lead to spe-cific problems related to the15N tracer use. As examples
we cite the reports of Wallace et al. (1954), Legaz et al. (1982), Feigenbaum et al. (1987), Legaz et al. (1995), Boaretto et al. (1999a, b), Lea-Cox et al. (2001), Lima Filho and Malavolta (2003), and Fenilli et al. (2004) who worked with the genus Citrus, and Bustamante et al. (1997), Snoeck et al. (1998) and Snoeck and Dome-nach (1999) with the genus Coffea.
The main difficulties that arise with the use of the
15N tracer in perennial crops are related to the large plant
size, which requires the use of great quantities of the la-bel, and leads to a high experimental cost in terms of ma-terials and isotope detection through mass-spectrometry. Representative sampling becomes more difficult due to the sizes of the samples to be collected, in general be-ing whole plans of large size and age, which implies in representative sub-sampling. Based on an experiment carried out on a coffee crop fertilized with15N labeled
ammonium sulfate, with the aim of studying the absorp-tion rates of the fertilizer-N by the coffee plant (Fenilli et al. 2007) and the fate of the fertilizer-N in the soil-plant-atmosphere system (T.A.B. Fenilli et al., unpublished data), this study discusses aspects of enrichment levels, analytical isotopic errors in comparison to the inherent field variability, and15N enrichment variability among
the different plant parts.
MATERIALS AND METHODS
STUDYAREA ANDEXPERIMENTALDESIGN
Field studies were conducted from 2003 to 2005, at the Agricultural Campus of the University of São Paulo, Research Station of Piracicaba, SP, Brazil (22◦42′S, 47◦38′W, 580 m above sea level) on a Typic Rhodudalfs according to US Soil Taxonomy, named Nitossolo Ver-melho Eutroférrico according to Brazilian classification system (Embrapa 2006). Details on the study area and its climate are described elsewhere (Fenilli et al. 2007, Silva et al. 2006).
Coffee seedlings (Coffea arabicaL.) of the variety “Catuaí vermelho IAC-144” were planted in rows along contour lines in May 2001, with a row spacing of 1.75 m and 0.75 m between plants, with a population of 7.620 plants per ha. Coffee is a perennial crop which starts pro-ducing beans in the third year. In Brazil the crop cycle be-gins with flowering at the end of the cold and dry season, as a consequence of the first significant rain, which occurs in the Piracicaba region during August-September. Fruit setting, grain filling and maturation take 9-10 months so that harvest is made between May and June. Therefore this fertilizer trial started on September 1, 2003 when plants started blooming and were 1.2 m tall, and con-tinued during two years, until August 30, 2005. Time was measured as days after Beginning (DAB), 0 DAB corresponding to Sept. 1, 2003, 8:00 a.m.
To carry out the experiment five plots of about 120 plants each were randomly selected in an area of about 0.2 ha of the established coffee crop, to receive N fertil-izer at the rates of: 280 kg ha-1of N in 2003/2004 and
350 kg ha-1of N in 2004/2005, supplied as ammonium
sulfate, split into four applications: September 1 and 60, 45 and 45 days after, for the two years. Within each of these five plots (replicates), sub-plots of sequences of three plants of one row were chosen for the N labeled fertilizer study. The ammonium sulfate was enriched at 2.072±0.00115N atom percent for both years’ appli-cations. The labeled fertilizer was carefully and homo-geneously broadcast below plant canopy, over the dead leaf mulch, according to the most commonly adopted practice.
PLANTSAMPLING ANDANALYSIS
For total shoot dry matter one whole plant per replicate was harvested outside the isotope row at each sampling time. The chosen plant was very similar to the central one of the three labeled plants, so that it could be assumed to represent the labeled one in terms of growth and yield. They were dissected into parts called compartments (C) as follows: C1– central stem or orthotropic branch (OB);
C2– productive plagiotropic branches (PB); C3– leaves
of productive branches (LPB); C4 – Vegetative
plagio-tropic branches (VB); C5– leaves of vegetative branches
each replicate were separated in the laboratory, then oven dried at 65◦C and weighed.
Since the central plant of the three labeled plants could not be sacrificed, it was only used for N total and N abundance evaluations collecting one full branch (out of more than 50 branches at the beginning) at each sampling time. One mature branch has samples of compartments C2to C6and to represent the orthotropic branch C1, that
obviously could not be harvested, we took the first cen-timeter of C2 that is in close connection with C1. This
first cm is hardwooden and was assumed to represent the central stem. The sampling of only one full branch per replicate was adopted to minimize interference on the growth and development of the labeled plant. At the end of the experiment plants had already more than 100 branches, so that we assumed that the harvest of nine branches (total number of samplings) for analysis during the two years did not affect significantly plant growth and development. These samples were also oven dried at 65◦C and finely ground. Representative sub-samples of 5µg were used for total N and15N abundance evalua-tions by mass spectrometry in an automated continuous flow Mass Spectrometer, Model ANCA-SL (Europa Sci-entific) as described by Mulvaney (1993) and Barrie and Prosser (1996).
CALCULATIONS
Based on data of dry matter (DM, g plant-1), total
ni-trogen concentration (CN, %), and15N enrichment (AN,
atom % in excess of 0.366) for each of the above de-scribed compartments, it was possible to calculate the accumulated nitrogen (Nacc, g plant-1) in each
compart-ment and the fraction of this nitrogen that is derived from the fertilizer (Ndff, %) (Hardarson 1990):
Nacc =
D M·CN
100 (1)
and
N d f f = ANof the compartment
ANof the fertilizer ×
100 (2)
and also the quantity of nitrogen in each compartment that is derived from the fertilizer (QNdff, g plant-1):
Q N d f f = Nacc·N d f f
100 (3)
Since CNand ANvary considerably among the six
compartments, their weighted average (WA) was calcu-lated according to:
W A =
6
i=1
CN×m M S
6
i=1
m M S
(4)
in which CNis exchanged by ANin order to obtain the
WA for15N enrichment. These averages are also
com-pared with CNand ANdata of each compartment in
or-der to find out which of them would better represent the whole plant. This would reduce the number of samples for analysis and the experimental cost in future experi-ments using the15N label in coffee.
Data were statistically analyzed using the descrip-tive concepts of the mean of n (five) replicates and its standard error sm= sd /√n, where sd is the standard
devi-ation. Relations between variables were quantified using linear regression.
RESULTS AND DISCUSSION
The evolution of plant shoot DM (Table I) during the 636 days of this study, obtained by harvesting at each date five whole plants (one per replicate) shows more than half of the standard errors sm above 10% of the
respective means. Although the plants were chosen based on a similarity criterium, the DM of each compart-ment varied considerably, indicating a large number n of replicates being necessary. However, harvesting more than five large perennial plants at each sampling time would determine a great impact on the plant stand, in-terfering in the growth and development of the crop as a whole. The total shoot DM, however, presented a smaller variability, always below 10%.
The total-N concentration CN (Table II) varied
strongly among compartments and time, as a function of the application of the readily available fertilizer-N and depending on the N redistribution within the plant, including roots. The standard errors shown in brackets include the measurement error of CN performed
dur-ing the mass-spectrometry procedure, and the variabil-ity of the five replicates. The evaluation of CNby the
se-TABLE I
Means and standard errors (sm) of dry matter yield of the different compartments of the coffee plant shoot as a function of time (DAB = days after beginning, starting Sept 1, 2003).
C o m p a r t m e n t
DAB OB PB LPB VB LVB F Total
g plant-1
63 304.9 64.5 63.1 55.8 201.9 3.1 693.4
(±40.4) (±13.0) (±17.8) (±10.3) (±16.2) (±0.8) (±69.2)
126 371.1 109.2 153.0 64.8 369.3 39.3 1106.7
(±33.7) (±13.3) (±33.0) (±10.5) (±47.1) (±15.1) (±104.1)
182 413.7 180.1 306.7 98.4 509.0 153.2 1661.2
(±41.1) (±14.9) (±46.2) (±9.2) (±50.3) (±41.2) (±125.5)
243 578.0 198.7 222.0 193.0 849.4 182.4 2223.5
(±42.6) (±9.4) (±8.6) (±24.4) (±110.5) (±56.4) (±161.7)
366 741.5 220.3 43.04 99.6 249.9 40.2 1394.4
(±73.8) (±14.1) (±8.6) (±9.5) (±26.2) (±6.3) (±90.3)
430 796.2 427.4 84.0 71.7 308.3 80.0 1767.5
(±63.6) (±51.5) (±13.9) (±5.6) (±24.6) (±12.7) (±109.7)
491 763.5 308.4 38.0 65.9 408.3 577.7 2161.9
(±54.7) (±8.4) (±4.7) (±3.3) (±20.3) (±45.2) (±103.5)
548 917.8 328.7 29.3 112.6 729.2 895.5 3013.0
(±115.9) (±42.6) (±8.2) (±9.3) (±73.5) (±120.8) (±225.2)
636 1080.9 339.6 21.5 146.6 756.3 1598.5 3943.3
(±73.5) (±1 3.8) (±5.5) (±16.3) (±24.2) (±258.3) (±243.8)
OB – orthotropic branch; PB – productive plagiotropic branches; LPB – leaves of productive branches; VB – vegetative plagiotropic branches; LVB – leaves of vegetative branches; F – fruits.
quence after every 10 samples. This standard error is in the order of 1%. The smpresented in Table II are in
the order of 4% of the mean, some however above this value, the highest of them corresponding to vegetative branches at 491 DAB, with a value of 15.9% of the mean. In view of the small mass-spectrometry error, these high standard errors are certainly mostly due to the inherent variability among replicates of an agronomic field experiment.
The 15N enrichment A
N (Table III) also varied
among compartments and in time, depending on how much 15N fertilizer was applied before each sampling
time. Values increase from 63 to 243 DAB with a re-duction at 366 DAB due to leaf fall, translocation of N among compartments including the root system, and fruit export at harvest (Fenilli et al. 2007). The same pattern was observed for the second year (366 to 636 DAB). The sm also include the measurement error by
mass-spectrometry (of the order of 0.1%) and the agro-nomic variability of the five replicates. This last variabil-ity depends on the homogenevariabil-ity of the fertilizer broad-casting procedure, of the flow of the fertilizer into the soil, of the root distribution and its activity, and on the translocation to the shoot. The sm values presented in
Table III are of the order of 6% of the mean, with high-est values at 430 DAB (10.2%) for LPB, and at 491 DAB (10.1%) for VB, also certainly due to the variabil-ity among field replicates. Evaluations of An in fruit (F), made in 2006 (1,001 DAB) and in 2007 (1,366 DAB), were 0.250 and 0.236 atom % in excess, respectively, showing that the label was still at easy detectable levels two years after the end of the experiment.
TABLE II
Means and standard errors (sm) of total-N concentration (CN) as a function of time (DAB = days after beginning, starting Sept 1, 2003) for the different aerial compartments of the coffee plant,
measured during mass-spectrometry.
C o m p a r t m e n t
DAB OB PB LPB VB LVB F
%
63 1.45 (±0.07) 1.71 (±0.14) 3.50 (±0.21) 2.48 (±0.11) 4.26 (±0.11) 4.70 (±0.14)
126 1.51 (±0.12) 1.91 (±0.15) 3.87 (±0.16) 2.51 (±0.09) 4.05 (±0.15) 2.93 (±0.39)
182 1.53 (±0.09) 2.04 (±0.12) 4.01 (±0.13) 2.36 (±0.12) 3.96 (±0.15) 3.18 (±0.16) 243 1.49 (±0.11) 1.77 (±0.13) 3.23 (±0.11) 2.07 (±0.09) 3.54 (±0.13) 2.74 (±0.19)
366 0.94 (±0.08) 1.42 (±0.16) 2.31 (±0.22) 2.02 (±0.22) 2.58 (±0.27) 3.05 (±0.28)
430 1.04 (±0.07) 1.65 (±0.10) 3.01 (±0.06) 2.15 (±0.07) 3.68 (±0.06) 4.05 (±0.08) 491 0.98 (±0.08) 1.28 (±0.11) 2.78 (±0.05) 1.68 (±0.26) 3.21 (±0.16) 2.69 (±0.20)
548 0.96 (±0.04) 1.19 (±0.05) 2.56 (±0.07) 1.88 (±0.10) 3.05 (±0.06) 2.00 (±0.09)
636 1.07 (±0.12) 1.53 (±0.14) 2.33 (±0.07) 1.74 (±0.13) 2.72 (±0.11) 2.31 (±0.15)
OB – orthotropic branch; PB – productive plagiotropic branches; LPB – leaves of productive branches; VB – vegetative plagiotropic branches; LVB – leaves of vegetative branches; F – fruits.
TABLE III
Means and standard errors (sm) ofl5N enrichment as a function of time (DAB = days after beginning, starting Sept 1, 2003) for the different aerial compartments of the coffee plant,
measured by mass spectrometry.
C o m p a r t m e n t
DAB OB PB LPB VB LVB F
15N atom % in excess to 0.366
63 0.187 (±0.01) 0.229 (±0.01) 0.392 (±0.02) 0.403 (±0.02) 0.505 (±0.02) 0.387 (±0.02) 126 0.509 (±0.03) 0.523 (±0.03) 0.734 (±0.06) 0.741 (±0.04) 0.844 (±0.07) 0.774 (±0.05)
182 0.721 (±0.04) 0.883 (±0.04) 0.953 (±0.03) 0.939 (±0.05) 0.928 (±0.05) 0.878 (±0.06)
243 0.843 (±0.06) 1.029 (±0.05) 1.041 (±0.06) 1.017 (±0.07) 1.027 (±0.05) 0.963 (±0.06) 366 0.576 (±0.03) 0,647 (±0.04) 0.766 (±0.06) 0.621 (±0.05) 0.651 (±0.06) 0.600 (±0.04)
430 0.682 (±0.05) 0.715 (±0.06) 0.785 (±0.08) 0.781 (±0.06) 0.801 (±0.07) 0.744 (±0.07) 491 0.811 (±0.05) 0.815 (±0.05) 0.741 (±0.03) 0.787 (±0.08) 0.819 (±0.06) 0.831 (±0.08)
548 0.804 (±0.04) 0.843 (±0.04) 0.866 (±0.06) 0.954 (±0.05) 0.946 (±0.05) 0.932 (±0.06)
636 0.735 (±0.04) 0.781 (±0.04) 0.847 (±0.05) 0.814 (±0.05) 0.866 (±0.05) 0.887 (±0.04)
OB – orthotropic branch; PB – productive plagiotropic branches; LPB – leaves of productive branches; VB – vegetative plagiotropic branches; LVB – leaves of vegetative branches; F – fruits.
fruit at 126 DAB (45.2%). These errors are large, how-ever acceptable for show-everal types of agronomic exper-imentation (Pimentel Gomes 1970). The high values correspond to early stages of the experiment, when the
represent the whole plant and are the sums of the QNdff of the compartments presented in Table IV, and there it can be seen the standard errors in the order of 10% of the respective means, are small with the highest value for 243 DAB (15.6%).
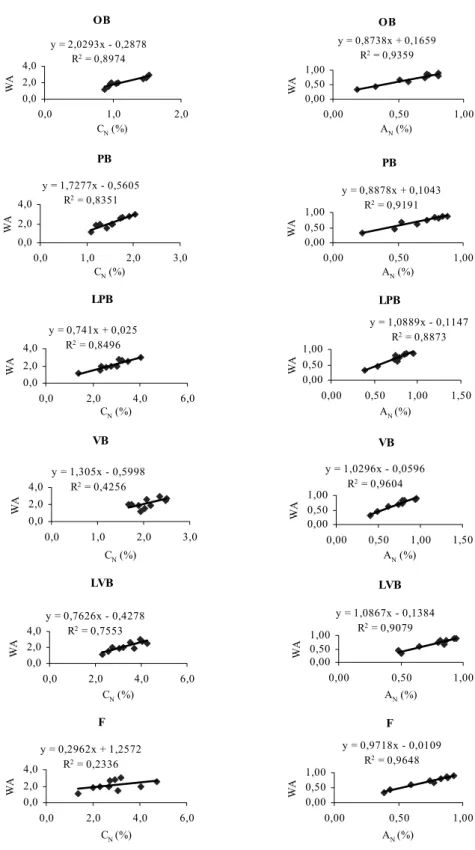
In order to verify which compartment best repre-sents the whole plant in terms of CNand AN, linear
re-gressions were made between WA and CNor AN, for each
compartment, using data of the nine samplings made during the two years of the experiment. These regres-sions are presented in Figure 1, all with significant values of R2, with exception to fruit for C
N. From the
theoret-ical point of view, the best regressions would be those with slope closest to the 1, intercept closest to 0 and with high R2. For C
Nthe closest would be for LPB and LVB,
and for AN PB, LPB, LVB, and F. However, from the
practical point of view, LVB are always present, easy to be sampled with minimal interference on the growth and development of the plant, and could therefore be chosen as the compartment that best represents the whole plant, for both CN and ANsimultaneously. Their regressions
have also high and significant R2and are:
W AC=0.7626CN(L V B)−0.4278; R2=0.7553 (5)
W AA=1.0867AN(L V B)−0.1384; R2=0.9079 (6)
In Table V we compare QNdff data calculated in three ways: QNdff1as already described; QNdff2using
the WA for CNand AN; and QNdff3 using regressions
(5) and (6) to find out the WA using CNand ANfor LVB.
The statistical analysis shows that there is no difference between the data for all dates, showing that the LPB can be used in this kind of experimentation, significantly reducing sampling procedures and costs.
FINAL CONSIDERATIONS
As discussed above, the precision and accuracy involved in the use of15N fertilizer in studies of N recovery and
balance can be separated in two sources of error: i) those involving the analytic measurement of the nitrogen concentration CNand the15N enrichment ANby
mass-spectrometry, and ii) those coming from agronomic, sampling and design problems during the execution of the experiment. The evolution of mass-spectrometry was enormous in the last decades, so that natural variations
in15N abundance can easily and safely be detected,
mak-ing studies withδ◦/◦◦ very viable. As already said, for enriched materials the standard errors can be as low as 0.1% for AN. The same is also valid for total N
concen-tration, measured simultaneously in the mass-spectro-meter, also with errors of less than 1%. Therefore, the analytic measurement errors are overwhelmed by the agronomic errors which depend on the way by which the experimental field work is carried out.
In our case, the data presented here belong only to one treatment which used the15N label, of a larger
ex-periment. The number of five replicates used here is the result of a randomized block design including three treatments: To (no N fertilizer); T1 (half N rate); and
T2(full N rate as described in Materials and Methods).
In order to have the residual number of degrees of free-dom greater than 10 (Pimentel Gomes 1970) the mini-mum number of replicates should be five. This number of replicates was also used in the labeled experiment, carried out only on T2in order to reduce experimental
costs. The variability among these replicates included management practices, plant growth and development variation, homogeneity of label application, sampling, among others. As a result, data on QNdff presented in Table V exhibited standard errors of the order of 15% and, if these values should be reduced, say to half, one could estimate the number (n) of replicates necessary using the approach presented by Warrick and Nielsen (1980):
n = [x(α)]2·(sd)
2
d2 (7)
in which x(α) is the normalized deviation which can be found tabulated (student’s t), which is 1.96 at the 0.05 confidence value for infinite degrees of freedom; and d is the desired deviation from the mean. For our average standard deviation sd = 2.5, with a desire of having d = 1/2 sd, the result would be n = 15. In most cases such a high number of replicates would be pro-hibitive. Therefore we conclude that the standard errors presented in Table V were acceptable, and that in this way the enrichment of 2% of the15N fertilizer was
TABLE IV
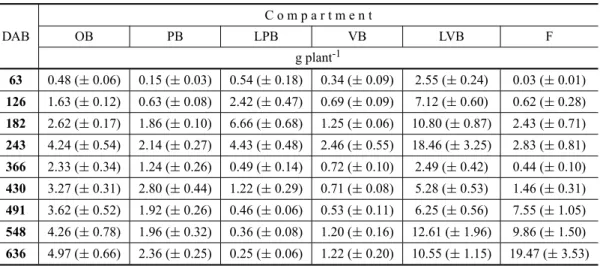
Quantities of N derived from the fertilizer and accumulated in each compartment of the coffee plant (QNdff) as a function of time (DAB = days after beginning, starting Sept 1, 2003).
C o m p a r t m e n t
DAB OB PB LPB VB LVB F
g plant-1
63 0.48 (±0.06) 0.15 (±0.03) 0.54 (±0.18) 0.34 (±0.09) 2.55 (±0.24) 0.03 (±0.01)
126 1.63 (±0.12) 0.63 (±0.08) 2.42 (±0.47) 0.69 (±0.09) 7.12 (±0.60) 0.62 (±0.28)
182 2.62 (±0.17) 1.86 (±0.10) 6.66 (±0.68) 1.25 (±0.06) 10.80 (±0.87) 2.43 (±0.71) 243 4.24 (±0.54) 2.14 (±0.27) 4.43 (±0.48) 2.46 (±0.55) 18.46 (±3.25) 2.83 (±0.81)
366 2.33 (±0.34) 1.24 (±0.26) 0.49 (±0.14) 0.72 (±0.10) 2.49 (±0.42) 0.44 (±0.10)
430 3.27 (±0.31) 2.80 (±0.44) 1.22 (±0.29) 0.71 (±0.08) 5.28 (±0.53) 1.46 (±0.31) 491 3.62 (±0.52) 1.92 (±0.26) 0.46 (±0.06) 0.53 (±0.11) 6.25 (±0.56) 7.55 (±1.05)
548 4.26 (±0.78) 1.96 (±0.32) 0.36 (±0.08) 1.20 (±0.16) 12.61 (±1.96) 9.86 (±1.50)
636 4.97 (±0.66) 2.36 (±0.25) 0.25 (±0.06) 1.22 (±0.20) 10.55 (±1.15) 19.47 (±3.53)
OB – orthotropic branch; PB – productive plagiotropic branches; LPB – leaves of productive branches; VB – vegetative plagiotropic branches; LVB – leaves of vegetative branches; F – fruits.
TABLE V
Different ways of calculating QNdff: QNdff1 = sum of in-dividual compartments; QNdff2 = use of equation (3) with weighted averages of CNand AN; QNdff3= use of equation (3) with data of CNand ANfrom leaves of productive branches.
(DAB = days after beginning, starting Sept 1, 2003).
DAB QNdff1 QNdff2 QNdff3
day g plant-1
63 4.09 (±0.42) 3.28 (±0.33) 4.77 (±0.48) 126 13.11 (±0.78) 12.05 (±1.13) 13.38 (±1.26)
182 25.62 (±0.96) 25.34 (±1.92) 22.03 (±1.66)
243 15.97 (±2.49) 15.09 (±1.10) 11.35 (±0.83) 366 7.72 (±1.10) 7.43 (±0.48) 7.15 (±0.46)
430 14.74 (±1.51) 14.45 (±0.90) 18.03 (±1.12)
491 20.32 (±2.16) 20.27 (±0.97) 19.28 (±0.92) 548 30.24 (±3.30) 30.95 (±1.62) 32.52 (±1.82)
636 38.82 (±3.23) 37.63 (±2.33) 30.73 (±1.90)
OB
y = 2,0293x - 0,2878 R2 = 0,8974
0,0 2,0 4,0
0,0 1,0 2,0
CN (%)
W
A
OB
y = 0,8738x + 0,1659 R2 = 0,9359
0,00 0,50 1,00
0,00 0,50 1,00
AN (%)
W
A
PB
y = 1,7277x - 0,5605 R2 = 0,8351
0,0 2,0 4,0
0,0 1,0 2,0 3,0
CN (%)
W
A
PB
y = 0,8878x + 0,1043 R2 = 0,9191
0,00 0,50 1,00
0,00 0,50 1,00
AN (%)
W
A
LPB
y = 0,741x + 0,025 R2 = 0,8496
0,0 2,0 4,0
0,0 2,0 4,0 6,0
CN (%)
W
A
LPB
y = 1,0889x - 0,1147 R2 = 0,8873
0,00 0,50 1,00
0,00 0,50 1,00 1,50
AN(%)
W
A
VB
y = 1,305x - 0,5998 R2 = 0,4256
0,0 2,0 4,0
0,0 1,0 2,0 3,0
CN (%)
W
A
VB
y = 1,0296x - 0,0596 R2 = 0,9604
0,00 0,50 1,00
0,00 0,50 1,00 1,50
AN (%)
W
A
LVB
y = 0,7626x - 0,4278 R2 = 0,7553
0,0 2,0 4,0
0,0 2,0 4,0 6,0
CN (%)
W
A
LVB
y = 1,0867x - 0,1384 R2 = 0,9079
0,00 0,50 1,00
0,00 0,50 1,00
AN (%)
W
A
F
y = 0,2962x + 1,2572 R2 = 0,2336
0,0 2,0 4,0
0,0 2,0 4,0 6,0
CN(%)
W
A
F
y = 0,9718x - 0,0109 R2 = 0,9648
0,00 0,50 1,00
0,00 0,50 1,00
AN(%)
W
A
Fig. 1 – Linear regressions between weighted averages (WA of equation 4) and individual values of CNand ANfor the different compartments,
ACKNOWLEDGMENTS
To Fundação de Amparo à Pesquisa do Estado de São Paulo (FAPESP) and to Conselho Nacional de Desen-volvimento Científico e Tecnológico (CNPq) for finan-cial support.
RESUMO
O uso do traçador15N em pesquisas agronômicas que envol-vem o ciclo do nitrogênio (N) e o destino do N do fertilizante está bem estabelecido, entretanto, para o caso de experimen-tação com plantas perenes como citrus, café e seringueira, ainda existem limitações devidas ao porte das plantas, à amostragem, aos níveis de detecção e à interferência no sistema. Este estudo procura contribuir metodologicamente no delineamento expe-rimental e no desenvolvimento desse tipo de experimentação, em condições de campo, fazendo uso, por dois anos, do experi-mento de uma cultura de café adubada com fertilizante marcado com15N. O N da planta derivado do fertilizante foi estudado nas diferentes partes da planta de café para determinar sua dis-tribuição dentro dela e a eficiência agronômica da prática de adubação. Um enriquecimento do N do fertilizante da ordem de 2% em abundância de15N foi suficiente para estudar taxas de absorção de N e estabelecer balanços do N do fertilizante depois de um e dois anos de cultivo. A principal fonte de er-ros dos valores estimados está na variabilidade agronômica das repetições e não na precisão das medidas de conteúdo de N e de enriquecimento em15N por espectrometria de massa.
Palavras-chave:delineamento experimental, variabilidade de repetições, metodologia de isótopos estáveis, cultura perene.
REFERENCES
BARRIEAANDPROSSERSJ. 1996. Automated analysis of light-element stable isotope ratio mass spectrometry. In: BOUTTON TW AND YAMASAKI S (Eds), Mass spec-trometry of soils. New York: Marcel Dekker, p. 1–46. BOARETTO AE, SCHIAVINATTO-NETO P, MURAOKA T,
TRIVELINPCO ANDBISSANICA. 1999a. Eficiência da aplicação de15N -uréia no solo e nas folhas de laranjei-ras jovens. Laranja 20: 477–498.
BOARETTO AE, SHIAVINATTO-NETO P, MURAOKA T, OLIVEIRA MW ANDTRIVELIN PCO. 1999b. Fertili-zação foliar de nitrogênio para laranjeira em estágio de formação. Sci Agr 56: 621–626.
BUSTAMANTEC, OCHOAMANDRODRIGUEZMI. 1997. Balance of three nitrogen15N fertilizers in a Cuban Oxisol
cultivated withCoffea arabicaL. Tropicultura 15: 169– 172.
EMPRESA BRASILEIRA DE PESQUISA AGROPECUÁRIA. 2006. Brazilian Soil Classification System. Embrapa – Centro Nacional de Pesquisa do Solo. Rio de Janeiro, RJ, Brasil, 412 p.
FEIGENBAUMS, BIELORAIH, ERNERYANDDASBERGS. 1987. The fate of15N labeled nitrogen applied to mature citrus trees. Plant and Soil 97: 179–187.
FENILLI TAB, BOARETTO AE, BENDASSOLLI JA, TRI -VELINPCOANDMURAOKAT. 2004. Dinâmica do ni-trogênio em laranjeiras jovens cultivadas em solução nutritiva. Laranja 25: 461–472.
FENILLITAB, REICHARDT K, DOURADO-NETOD, TRI -VELIN PCO, FAVARIN JL, PEREIRA DA COSTA FM ANDBACCHIOOS. 2007. Growth, development and fer-tilizer N recovery for a coffee crop growing in Brazil. Sci Agr 64: 541–547.
HARDARSONG. 1990. Use of nuclear techniques in stud-ies of soil-plant relationships. (Training Course Serstud-ies 2) Vienna, IAEA, 223 p.
LEA-COX JD, SYVERTSEN JP AND GRAETZ DA. 2001. Springtime15nitrogen uptake, partitioning, and leaching losses from young bearing citrus trees of differing nitro-gen status. J Am Soc Hortic Sci 126: 242–251.
LEGAZF, PRIMO-MILLOE, PRIMO-YUFERAE, GILCAND RUBIOJL. 1982. Nitrogen fertilization in citrus. I. Ab-sorption and distribution of nitrogen in calamondin trees (Citrus mitisBl.) during flowering, fruit set and initial fruit development periods. Plant and Soil 66: 339–351. LEGAZF, SERNAMD ANDPRIMO-MILLO E. 1995.
Mo-bilization of the reserve N in citrus. Plant and Soil 173: 205–210.
LIMAFILHOOFANDMALAVOLTAE. 2003. Studies on min-eral nutrition of the coffee plant (Coffea arabicaL. cv.
Catuaí Vermelho). LXIV Remobilization and reutiliza-tion of nitrogen and potassium by normal and deficient plants. Braz J Biol 63: 481–490.
MULVANEY RL. 1993. Mass spectrometry. In: KNOWLES RANDBLACKBURN TH (Eds), Nitrogen isotope tech-niques, San Diego, Academic Press, p. 11–57.
PIMENTELGOMESF. 1970. Curso de Estatística Experimen-tal. Nobel: Piracicaba, SP, Brazil, 430 p.
REICHARDTKANDBACCHIOOS. 2004. Isotopes in soil and plant investigations. In: ENCYCLOPEDIA OFSOILS AND THEENVIRONMENT. Elsevier, Amsterdam 1: 280–284. SILVAAL, ROVERATTIR, REICHARDTK, BACCHIOOS,
-DO-NETOD. 2006. Variability of water balance compo-nents in a coffee crop in Brazil. Sci Agric 63: 105–114. SNOECKDANDDOMENACHAM. 1999. Demonstrating
ni-trogen transfer from legumes to coffee using isotope tech-niques. Proceedings of the Eighteenth Colloque Scien-tifique International Sur Le Café, Helsinki, Finland. Paris, Association Scientifique Internationale du Café (ASIC), p. 430–437.
SNOECK D, GANRY F, JADIN P, BEUNARD P, DOMEN -ACHAM, MPEPEREKISMANDMAKONESEFT. 1998. Study of nitrogen fixing capacities of leguminous plants in coffee plantations in Burundi and their transfer possi-bilities. Harnessing biological nitrogen fixation in African agriculture: challenges and opportunities; selected papers. Harare, Zimbabwe, University of Zimbabwe, p. 232–239.
WALLACE A, ZIDANZI, MUELLER RTANDNORTHCP. 1954. Translocation of nitrogen in citrus trees. P Am Soc Hortic Sci 64: 87–104.