In Vivo
Study of Dynamics and Stability of
Dendritic Spines on Olfactory Bulb
Interneurons in
Xenopus laevis
Tadpoles
Yu-Bin Huang, Chun-Rui Hu, Li Zhang, Wu Yin, Bing Hu*
Chinese Academy of Sciences Key Laboratory of Brain Function and Disease, and School of Life Sciences, University of Science and Technology of China, Hefei, Anhui Province, P. R. China
Abstract
Dendritic spines undergo continuous remodeling during development of the nervous sys-tem. Their stability is essential for maintaining a functional neuronal circuit. Spine dynamics and stability of cortical excitatory pyramidal neurons have been explored extensively in mammalian animal models. However, little is known about spiny interneurons in non-mam-malian vertebrate models. In the present study, neuronal morphology was visualized by sin-gle-cell electroporation. Spiny neurons were surveyed in theXenopustadpole brain and observed to be widely distributed in the olfactory bulb and telencephalon. DsRed- or PSD95-GFP-expressing spiny interneurons in the olfactory bulb were selected forin vivo
time-lapse imaging. Dendritic protrusions were classified as filopodia, thin, stubby, or mush-room spines based on morphology. Dendritic spines on the interneurons were highly dynamic, especially the filopodia and thin spines. The stubby and mushroom spines were relatively more stable, although their stability significantly decreased with longer observa-tion intervals. The 4 spine types exhibited diverse preferences during morphological transi-tions from one spine type to others. Sensory deprivation induced by severing the olfactory nerve to block the input of mitral/tufted cells had no significant effects on interneuron spine stability. Hence, a new model was established inXenopus laevistadpoles to explore den-dritic spine dynamicsin vivo.
Introduction
The dendritic spine, a small membranous protrusion from a neuron’s dendrite, is a postsynap-tic structure that stores synappostsynap-tic strength and transmits electrical signals within neural circuits. Dendritic spines are dynamic, and their turnover and stability are vital for development, mem-ory, and learning [1–14]. To decipher complex brain functions and disorders, non-mammalian vertebrates such as zebrafish andXenopusoffer unique advantages and simplified but signifi-cant structural and functional homology to the human central nervous system and have been used to study synaptogenesis and dendrite development [15–25]. However, few studies on den-dritic spine plasticity, spinogenesis, or spine pruning have been conducted in such model a11111
OPEN ACCESS
Citation:Huang Y-B, Hu C-R, Zhang L, Yin W, Hu B (2015)In VivoStudy of Dynamics and Stability of Dendritic Spines on Olfactory Bulb Interneurons in
Xenopus laevisTadpoles. PLoS ONE 10(10): e0140752. doi:10.1371/journal.pone.0140752
Editor:Xiangming Zha, University of South Alabama, UNITED STATES
Received:April 11, 2015
Accepted:September 30, 2015
Published:October 20, 2015
Copyright:© 2015 Huang et al. This is an open access article distributed under the terms of the Creative Commons Attribution License, which permits unrestricted use, distribution, and reproduction in any medium, provided the original author and source are credited.
Data Availability Statement:All relevant data are within the paper and its Supporting Information files.
Funding:The work was supported by the National Natural Science Foundation of China, grant numbers: 91132724, 30870833, and U1332136,http://www. nsfc.gov.cn/. BH received the funding. The funders supported the study design, data collection, analysis, and decision to publish.
systems. Most knowledge about spine morphology and dynamic features has been gained from studies on mammalian brains in barrel, visual, and motor cortices [4,5,10,26].
With the exception of some spine-like structures, dendritic spines are not found in zebrafish
[16,27]. TheXenopusvisual system has been widely used forin vivostudies [28–33]; however,
tectal neurons are not spiny neurons. Granule cells in the olfactory bulb (OB) ofXenopusare the only reported spiny neurons according to morphology in slices [31,34]. Is this the only spiny neuron with typical morphology inXenopus? What are the dynamic features of this model? In this study, we examined the distribution of spiny neurons in theXenopusbrain, as well as dynamic changes and stability of spiny neurons in the OB during development and after odor deprivation.
Materials and Methods
Animals
AdultX.laevisfemales (Nasco, Fort Atkinson, WI) were primed with human chorionic gonad-otropin (Sigma-Aldrich, St Louis, MO) to induce egg laying. Oocytes were fertilizedin vitro. Tadpoles were maintained in a modified rearing solution (60 mM NaCl, 0.67 mM KCl, 0.34 mM Ca(NO3)2, 0.83 mM MgSO4, 10 mM HEPES adjusted to pH 7.4, and 40 mg/L gentamycin)
with 0.001% phenylthiocarbamide (PTU) added to prevent melanocyte pigmentation under fil-tered illumination in 12 h dark/light cycles.
During labeling and imaging, tadpoles were anesthetized with 0.02% MS-222 (Tricaine methanesulfonate, Finquel, Argent Laboratories, Reymond, WA). Staging was performed according to Nieuwkoop and Faber [35]. All animal manipulations were conducted in strict accordance with the guidelines and regulations set forth by the University of Science and Tech-nology of China (USTC). Furthermore, the protocol was approved by the Committee on the Ethics of Animal Experiments of the USTC (Permit No.: USTCACUC1102012).
Electroporation for single-neuron labeling
Morphologies of spiny and non-spiny neurons were distinguished by single-cell electropora-tion of dye as previously described [36,37]. Borosilicate pipettes (tip diameter 1μm, 6–10 MO
resistance) were filled with plasmid (0.8–1.2μg/μL) and Alexa Fluor 594 (Molecular Probes, USA) in extracellular solution. For dye labeling, pipettes were filled with Fluor 568-conjugated dextran (MW 10,000, Molecular Probes, USA) dissolved in extracellular solution. Patch pipettes were mounted to an electrode holder attached to a micromanipulator (Siskiyou, USA). The electrode was inserted through the skin of the tadpole, which was embedded in low melt-ing point agarose, and the electrode tip was placed near the soma of interest. Dye was electro-porated into neurons using 50 negative (positive for dextran-conjugated dye) square 10–12 V pulses of 0.5 ms duration at a frequency of 100 Hz generated by an Axoporator 800A (Axon Instruments, USA).
Neurons located in the OB, telencephalon, and tectum were randomly labeled. For clear imaging, the depth of the labeled neurons was 0–100μm under the skin. Only well-labeled neu-rons with clear processes were selected as samples for imaging. To confirm the positions of labeled neurons in the brain and detailed dendrite morphology, images were scanned with 10× and 60× objectives, respectively.
In vivo
expression of PSD95-GFP and dendritic spine labeling
PSD95-GFP was constructed and provided by Dr. D. Bredt (University of California, San Fran-cisco, CA) [38]. The full sequence of PSD95 was generated via PCR and subcloned into the HindIII and EcoRI sites of the GW1 expression vector with a cytomegalo virus (CMV) pro-moter (British Biotechnology, UK). GFP was subcloned in-frame at the C terminus of PSD95 at the EcoRI site [38]. DsRed2 is a plasmid with a CMV promoter that drives the expression of a variant ofDiscosoma sp. red fluorescent protein (Clontech, Cat. No. 632430, USA).
Plasmids of PSD95-GFP and DsRed2 (0.8–1.2μg/μL) were mixed for co-electroporation when the tadpoles reached stage 45/46. After 48 h, tadpoles with distinct neurons expressing DsRed2 throughout their dendritic arbor and those with punctuate PSD95-GFP labeling were selected for imaging. Approximately 80–90% of the transfected neurons expressed both plas-mids [19]. Given that expression of PSD95-GFP might promote synaptic maturation [39], only DsRed2- or GFP-transfected neurons were used for analyses of spine dynamics and stability. The PSD95-GFP and DsRed2 double-labeled neurons were selected only for colocalization analysis of PSD95-GFP and classification of the different types of spine morphology.
Neural input deprivation
X.laevistadpoles (stage 46/47) were anesthetized with 0.02% MS-222. A small fissure on the
skin over the OB was made using iridectomy scissors under a binocular stereo microscope. Using a fine #5 forceps (FST, Switzerland), the olfactory nerve was completely severed to block sensory input to the OB. The surgically treated individuals were reared in a modified rearing solution for recovery. To confirm that the olfactory nerves were severed, a small amount of 0.1% DiI (N22880, Invitrogen, USA) was pressure-injected into the OB using a microinjector (PicoSpitzer III, USA). After 24 h, both fully retrograde-labeled olfactory nerves were severed and immediately imaged using a fluorescence stereo microscope (Olympus SZX16, Japan).
In vivo
time-lapse imaging
Tadpoles with single labeled spiny neurons located in the posterior part of the OB were selected
forin vivoimaging. The imaging procedure was similar to previously used protocols [30,40–
43]. An imaging chamber was constructed of 2% agar with wells in a petri dish. The anesthe-tized tadpole was placed in a well and further immobilized by low melting point agarose (1% in rearing solution). The petri dish was then filled with dilute anesthetic solution perfused with air. After imaging, the tadpole was removed from the chamber and returned to normal rearing solution to recover. Viability of the animals was ensured through heart rate and recovery time. Imaging was performed under a 60× water immersion objective lens on Olympus FV1000 con-focal microscope (Olympus, Japan) equipped with Argon and He-Ne lasers. Thin (1.0μm) overlapping optical sections encompassing the entire dendritic arbor were collected below satu-ration levels, with minimal gain and contrast enhancements. For time-lapse imaging, stacks were collected every 15 min over a 60-min period to evaluate short-term dynamics, and every 2 h over a 6-h period and at 24 h for dynamic analysis. After surgery to block neural input, con-focal images were obtained at 0 h, 2 h, and 24 h.
Image processing and analysis
diameter. Stubby spines have no obvious constrictions between the head and the dendritic shaft. The diameter of its neck is nearly equal to the total length. Mushroom spines have large heads and narrow necks. Branched spines have more than one head. Filopodia and thin spines are classified as small spines, whereas stubby and mushroom spines are considered large spines [13].
Three-dimensional (3D) reconstruction of the confocal image stacks was performed and a median filter (3 × 3 × 1) was applied using Imaris 7.0 (Bitplane, Switzerland). The 3D object could be magnified and rotated in all directions. Traces of spines and synapses were detected using 3D images. Under these conditions, we were able to obtain larval spine data on the Z-axis or behind the overlap region by carefully rotating the images.
The Imaris Filament module was used to define and classify the 4 different types of dendritic spines. All dendritic arbors of a single neuron were traced using the AutoPath mode of the Fila-ment module. The dendritic spines were traced based on the dendritic framework using the Manual option. Each spine type was assigned a unique color. Branched spines were not included in the final statistical data due to the limited number of cases.
The digital 3D reconstruction images contained two color channels. DsRed2 labeled the olfactory spiny neurons and dendritic arbors, whereas PSD95-GFP labeled the postsynaptic spine specializations. The overlaps of these two channels were analyzed to determine the iden-tity and position of PSD95-GFP along the dendritic arbor. PSD95-GFP-labeled puncta with areas between 0.5 and 1.0μm2and green channel pixel intensity values between 50 and 255 were considered single synapses. Discrete PSD95-GFP-labeled puncta exhibited median pixel values 2 to 3 times greater than the median pixel values of the background non-puncta GFP within the same dendritic arbor. In the data analysis, similar ratios were maintained for every dendritic arbor analyzed throughout the observation period. Spines were automatically detected using the Spots module, and spots that were not exactly located inside the spines were manually deleted.
Data analysis
transformed into the other 3 types, were calculated. The percentages of PSD95-GFP puncta present in the 4 types of spines were also calculated. Data are presented as percent increases from the initial observation interval to each subsequent interval or as percent increases for each 2-h observation interval.
Two-sample unpairedt-tests and one-way ANOVA with Tukey’s multiple comparison tests (GraphPad Prizm 4.0) were used for statistical analysis of the data atP<0.05,P<0.01, and
P<0.001 significance levels. Data are presented as mean ± standard error of the mean
(SEM).
Results
Distribution of spiny neurons in the
Xenopus
brain
Currently, the granule cell is the only reported spiny neuron based on morphology inXenopus
OB slice [31,34], and little is known about other types of spiny neuron. To survey the distribu-tion of spiny neurons in theXenopusbrain,in vivosingle-cell electroporation was used to label neurons randomly with fluorescent dye in the OB, telencephalon, and tectum (Fig 1). Neurons with or without spines could be distinguished (Fig 1A2, 1B2, 1C2 and 1D2). All randomly labeled spiny neurons are summarized in a diagram, in which spiny neurons (red) were mainly distributed in the OB and telencephalon, while none was detected in the tectum (Fig 1D). Spiny neurons located in the posterior aspect of the OB were in the granule cell layer, adjacent to mitral cells that are projection neurons without spines distributed in the mitral cell layer. Layering of granule cells and mitral cells in the diagram is coincident with previous reports [45, 46].
DsRed2 and PSD95-GFP double-labeled spiny neurons in the OB
It has been reported that granule cells in the OB are spiny neuron [31,34], however, detailed information such as spine morphology, spine type, and dynamic features, is rare known. To examine spine morphology and categories, plasmids PDS95-GFP and DsRed2 were electropo-rated into olfactory spiny neurons, andin vivotime-lapse confocal imaging was performed to visualize dendritic arbors and postsynaptic sites on dendritic spines (Fig 2A). PSD95-GFP is a postsynaptic marker containing a chimeric gene encoding GFP and PSD95 [47,48] and has been widely used to visualize postsynaptic specializations [41,49]. DsRed2 was well expressed in spiny neurons of the OB (Fig 2A) and provided clear morphological details of dendritic branches and spines. After overlaying with DsRed2, PSD95-GFP appeared as small yellow puncta distributed over the soma, dendritic trunks, and dendritic spines (Fig 2B and 2C).Dendritic spines have several different morphological types. The size of the spine head is proportional to the area of postsynaptic density (PSD), the number of postsynaptic receptors, and the number of presynaptic docked vesicles [11]. PSD95-GFP colocalization differed with spine morphology. Confocal images showed that most of the yellow puncta were present on the majority of stubby spines (83.9 ± 7.8%, n = 348) and mushroom spines (84.5 ± 8.9%, n = 388), whereas only a fraction of the small spines contained the PSD95-GFP label
(6.3 ± 6.3%, n = 39 for filopodia; 44.2 ± 12%, n = 120 for thin spines;Fig 2D). Statistical analysis showed that the percentage of stubby and mushroom spines with PSD95-GFP puncta was sig-nificantly higher than that of filopodia and thin spines (P<0.001;Fig 2D). No significant
classic spine morphology, PSD95 colocalization confirmed that spiny neurons in theXenopus
OB exhibit different spine categories.
To explore the stability and dynamics of each type of dendritic protrusion, images of the olfactory interneurons under short-term observation at 15-min and 2-h intervals were Fig 1. Distribution of spiny neurons in theXenopustadpole brain.Fluorescent dye was electroporated into neurons located in different brain regions. (A1, A2) Spiny neuron in the OB. (A1) Electrode filled with fluorescent dye inserted into the OB, pointing to a labeled neuron. (A2) High magnification of the neuron in A1. Inset shows spines on a dendrite. (B1, B2) Mitral cell in the anterior OB. (C1, C2) Spiny neuron in the telencephalon (Tel). (D1, D2) Non-spiny neuron in the tectum (Tec). (E) Diagram summarizing all labeled spiny (red) and non-spiny (blue) neurons in different brain areas in the left hemisphere. Twenty neurons randomly labeled in the optic tectum were non-spiny neurons; 69 neurons in the OB and telencephalon were spiny neurons except for 11 neurons.
doi:10.1371/journal.pone.0140752.g001
Fig 2.In vivoimages of DsRed2 and PSD95-GFP double-labeled spiny neurons inX.laevistadpoles.(A) A spiny neuron was labeled by DsRed2 and PSD95-GFP. The postsynaptic specializations on spines are shown as yellow puncta. Green dots are developing melanocyte pigmentation not fully inhibited by phenylthiocarbamide (PTU). (B, C) High magnification views showing the different types of dendritic spines of the spiny neuron in (A). F: filopodia; T: thin spine; S: stubby spine; M: mushroom spine. The yellow puncta represent synaptic contacts, most of which were on stubby and mushroom spines. (D) Statistical analysis of the percentage of PSD95-GFP on different types of dendritic spines. Stubby and mushroom spines exhibited a higher number of PSD95-GFP puncta than filopodia and thin spines. Bars indicate mean±SEM. N = 4 neurons with 9 dendrites were used for colocalization analysis of PSD95-GFP. The significance levels were*P<0.05,**P<0.01, and***P<0.001.
obtained. The stability and dynamics of the 4 different types of spines over these two different time scales were calculated.
Short-term spine stability and dynamics
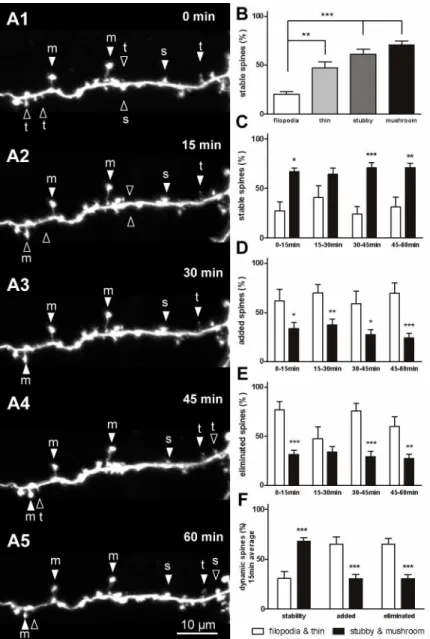
Many spines remained stable during the short-interval observations (Fig 3Aserial). The stabil-ity and dynamics of each type of spine were calculated. Filopodia were the most unstable pro-trusions among the 4 types of dendritic spine, with stability only at 20.2 ± 2.8% (n = 39), which was markedly lower than that of the stubby (61.1 ± 5.1%, n = 328,P<0.001) and mushroom
spines (71 ± 3.9%, n = 356,P<0.001;Fig 3B). The stability of the thin spines was higher than
filopodia (47.1 ± 6.3%, n = 178,P<0.01), which was also significantly lower than that of the
mushroom spines (P<0.05;Fig 3B). A detailed analysis of stability was conducted at each
time point. Data show that stability of the large spines was significantly higher than that of the small spines (Fig 3C). The filopodia and thin spines were more dynamic than the stubby and mushroom spines. A higher number of small spines tended to be added or eliminated com-pared with the large spines (Fig 3D and 3E). A significant difference in addition was observed during the 15–30-min, 30–45-min, and 45–60-min periods (P<0.05;Fig 3D), and a significant
difference in elimination was observed during observation intervals (Fig 3E). On average, the percentage of small spine additions or eliminations at each 15-min interval observation was markedly higher than that of the large spines (P<0.001;Fig 3F).
Long-term spine stability and dynamics
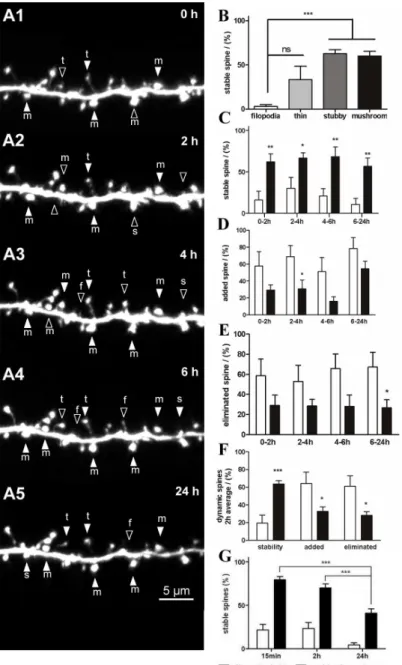
Long-term stability of up to 24 h at 2-h intervals was observed (Fig 4Aserial). The results were similar to those of the 15-min interval imaging. The stability of the filopodia (3.1 ± 2.1%, n = 45) was lower than that of the thin spines (33.4 ± 15.2%, n = 124;Fig 4B) and significantly lower than that of the stubby and mushroom spines (62.7 ± 4.7%, n = 167 and 60 ± 5.4%, n = 176, respectively,P<0.001;Fig 4B). The stability of the thin spines was also lower than
that of the mushroom spines (P<0.05;Fig 4B). Detailed analysis at each observation point
shows that the stability of the large spines was significantly greater than that of the small spines (0–2 h, 4–6 h, 6–24 h:P<0.01; 2–4 h:P<0.05;Fig 4C). In general, dynamic changes in the
filopodia and thin spines were higher than in the stubby and mushroom spines (Fig 4D and
4E). The addition of small spines was higher than that of the large spines during the 0–2-h,
2–4-h, and 6–24-h periods (Fig 4D). The elimination of small spines was also significantly higher than that of large spines during 6–24-h (P<0.05) period (Fig 4E). The average data
obtained from 2-h observations showed that small spines were more frequently added or elimi-nated compared with large spines (P<0.05;Fig 4F). These data indicated that stubby and
mushroom spines were more stable and less dynamic than filopodia and thin spines both in the short- and long-term observations. Furthermore, the stability of large spines gradually decreased with longer observation intervals, with significant differences observed at 24-h inter-vals compared with 15-min and 2-h interinter-vals (P<0.001;Fig 4G).
Morphological transitions during spine development
(Fig 5B2) and remained so at 6 h (Fig 5B4) before becoming a thin spine at 24 h (Fig 5B5). The frequency with which spines disappeared or transformed into other types was subsequently determined. We found that small spines were more likely to disappear entirely, whereas large spines were more likely to change shape rather than disappear. Pooled data from the 15 min and 2 h time courses show that only 24.2 ± 8.9% (n = 56) of filopodia transformed into thin spines, and 26.4 ± 8.3% (n = 67) of thin spines changed their morphology (Fig 5C). These val-ues were both significantly lower than the percentages for the stubby (64.3 ± 4.5%, n = 376) Fig 3. Stability and dynamics of dendritic spines during short-term observation.(A) Serial time-lapse images of a single neuron showing stable spines (filled arrowheads) and dynamic spines (open arrowheads) at 15-min intervals. (B) Stability of the 4 types of dendritic spines was observed at 15-min intervals. The stubby and mushroom spines were more stable than the filopodia and thin spines. (C) Detailed analysis of the stability of filopodia and thin spines versus stubby and mushroom spines at each 15-min interval observation. (D, E) Detailed analysis of filopodia and thin spines versus stubby and mushroom spines that were added (D) or eliminated (E) during each 15-min interval observation. (F) Average dendritic spine stability and dynamics at each 15-min observation. Bars indicate means±SEM. N = 4 neurons with 9 dendrites were used for the
15-min short-term observation. Significance was set at*P<0.05,**P<0.01, and***P<0.001.
and mushroom (87.9 ± 9.1%, n = 333) spines (P<0.01;Fig 5C). The percentage of specific
spine types that transformed into other types was then obtained. Results showed that all changed filopodia transformed into thin spines compared with large spines (P<0.05;Fig 5D).
However, no significant difference between thin spines that transformed into filopodia and Fig 4. Stability and dynamics of dendritic spines during long-term observation.(A) Serial time-lapse images of a dendritic branch showing stable spines (filled arrowheads) and dynamic spines (open
arrowheads) at 2-h intervals. (B) Stability of the 4 types of dendritic spines was observed at 2-h intervals. (C) Detailed analysis of stability of filopodia and thin spines versus stubby and mushroom spines during each 2-h interval observation. (D, E) Detailed analysis of filopodia and thin spines versus stubby and mushroom spines that were added (D) or eliminated (E) during each 2-h interval observation. (F) Average data of dendritic spine stability and dynamics at each 2-h observation. (G) Stability of the dendritic spines at different time interval observations. Bars indicate means±SEM. N = 4 neurons with 7 dendrites were used for the 2-h and 24-h
long-term observations. Significance was set at*P<0.05,**P<0.01, and***P<0.001.
those that became large spines (15.7% and 10.8%, respectively) was observed (Fig 5E). A few large spines transformed into small spines (Fig 5F and 5G). Most of the changed stubby spines transformed into mushroom spines (58.7%) rather than small spines (5.6%, P<0.001;Fig 5F).
Similarly, most of the changed mushroom spines transformed into stubby spines (66.3%) rather than into small spines (26.6%, P<0.05;Fig 5G). These results indicate that spines have
diverse preferences during morphological transitions. Large spines are more likely to preserve their synaptic connections within stubby and mushroom spines rather than disappearing entirely as small spines. In the small spine category, almost all unstable filopodia transform into thin spines, whereas only a small number of changed thin spines develop into large spines, indicating that some of the large spines originate from small spines during development.
Spine stability after olfactory nerve severance
Maturation of the nervous system is experience-dependent, and the patterns of neuronal con-nectivity are affected by activity [3]. Experimental evidence indicates that experience and neu-ronal activity are key to spine dynamics and cortical plasticity [1,2,9,50,51]. To observe spine dynamics of OB interneurons after activity blockade, olfactory nerves were severed to prevent olfactory sensory input. To confirm severing of the olfactory nerves, 1% DiI was injected into the OB for retrograde tracing of the olfactory nerves. After severance, disconnection of the DiI-labeled olfactory nerve was clearly demonstrated (S1 Fig). Stage 46/47 tadpoles with single labeled olfactory interneurons were randomly divided into sham cut and cut groups. In each group, the surgical procedure was the same except that olfactory nerves were not severed in the sham cut group. After nerve severance, tadpoles were imaged at 0 h (Fig 6A1 and 6B1), 2 h (Fig Fig 5. Transformation of dendritic protrusions into other spine types.(A) A mushroom spine (indicated by an arrow in A1) transformed into a thin spine at 30 min (A3), and reverted to a mushroom spine at 60 min (A5). Another thin spine (indicated by an arrowhead) transformed into a mushroom spine at 30 min (A3). (B) A stubby spine (indicated by an arrow in B1) transformed into a mushroom spine at 2 h (B2), remained in that shape up to 6 h (B4), and became a thin spine at 24 h (B5).“+”indicates newly added spines, and“-”indicates eliminated spines. (C) The percentage of spines that transformed into other forms during the pooled data of 15-min and 2-h interval observations. (D–G) Percentage of each spine type that transformed into other types. (D) All filopodia transformed into thin spines, and a few transformed into large spines (P<0.05). (E) Some changed thin spines transformed into filopodia, and some
transformed into large spines; no significant difference was observed between these two forms. (F) Most of the stubby spines transformed into mushroom spines, and only a few transformed into small spines (P<0.001). (G) Most of the mushroom spines transformed into stubby spines, and only a few transformed into small spines (P<0.05). Figure labels: trans. = transformation, fil. = filopodia, stu. = stubby, and mus. = mushroom. Neurons used for transformation analysis were from the 15-min short-term and 2-h middle-term observations. Bars indicate means±SEM. Significance was set at*P<0.05, **P<0.01, and***P<0.001.
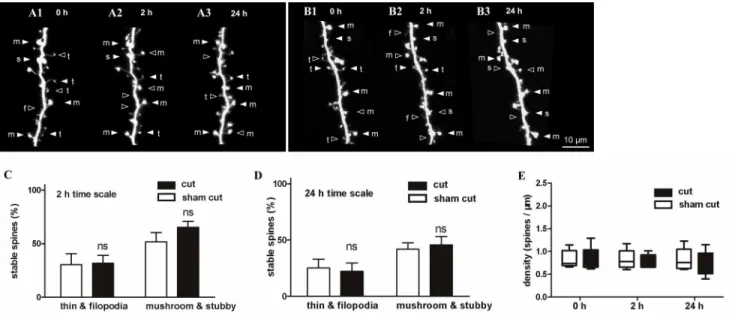
6A2 and 6B2), and 24 h (Fig 6A3 and 6B3). Stability of the small and large spines observed at the 2-h interval was similar to the spines in the control group (Fig 6C). The 24 h interval obser-vation also showed no significant difference between the two groups (Fig 6D). In addition, data showed that spine density did not change within 2 h and 24 h (Fig 6E) after olfactory nerve sev-erance compared with the control group.
Discussion
The
X.
laevis
tadpole as an
in vivo
model for studying spine dynamics
Spiny neurons are rarely found in non-vertebrates such asDrosophila melanogaster,Caenor-habditis elegans[52], and even in non-mammalian vertebrate models such as zebrafish and
Xenopus. According to studies on olfactory bulb slices, granule cells are the only spiny neurons
inXenopus[31,34], while in zebrafish, a lower vertebrate, spiny neurons have been scarcely
reported except for spine-like or knob-like protrusions on Mauthner axons [16,27]. This implies that spines may have evolved as complex structures to execute higher-level functions in more advanced nervous systems.
In the present study, a distribution map of spiny neurons was drawn based on random fluo-rescent dye labeling in the OB, telencephalon, and tectum. Spiny neurons were widely found in the OB and extensively distributed in the telencephalon (Fig 1), but were not detected in the optic tectum, which is consistent with previous studies of tectal neurons [41]. However due to technical limitation of single-cell electroporation and imaging depth, it was difficult to label neurons in all brain areas. Thus, only a subset of neurons was surveyed.
Granule and mitral cells are the primary neurons in theXenopusOB. Mitral and periglo-merular cells are located in the anterior and granule cells in the posterior area of the OB. Our characterization of spiny and non-spiny neurons in the OB is consistent with previous studies
[34,45,46,53]. Spiny neurons labeled forin vivoimaging were granule cells as they were found
Fig 6. Stability of dendritic spines after olfactory nerve severance.(A, B) Serial time-lapse images showing the morphology of dendritic spines in the sham group (A) and olfactory nerve severance group (B) imaged at 0 h, 4 h, and 24 h, respectively, after surgery. (C, D) Stability of small and large spines after sensory deprivation compared with normal spines during the 2-h and 24-h observation periods. (E) Density of the spines after surgery. Bars indicate means±SEM. N = 10 neurons with 16 dendrites were used for the sensory deprivation analysis. Significance was set at*P<0.05,**P<0.01, and ***P<0.001.
mainly in the granule cell layer (Fig 1D), and they were rarely labeled in the mitral cell layer. Furthermore, mitral and granule cells differ in morphology. Mitral cells are projection neurons without spines, and their terminals form tufts, a characteristic branching structure, while gran-ule cell dendrites have a typical appearance of spines [34]. In rodents, grangran-ule cells are located in the deepest layer of the OB (~350μm below the dorsal surface of the OB in mouse). This makes it difficult to label and image them and only apical dendrites have been visualized with limited optical resolution [54]. Thus,Xenopustadpole provides unique advantages for studying granule cells in the OB. In addition to the OB, spiny neurons were extensively distributed in the telencephalon, possibly providing anotherin vivomodel for studying spines; however, stud-ies on the telencephalon are currently limited inXenopus.
In the OB of theXenopustadpole, all layers of the developing OB are present at stage 44. The mature laminar structure of the OB appears at stage 48/49 and remains constant through-out larval life even into adulthood, and increases in size [55]. Our preliminary experiments showed that interneurons have a few spines at stage 44/45, becoming more abundant at stage 46/47. Thus, tadpoles at stage 46/47 were selected for spine dynamics and stability analysis. After stage 50/51, tadpoles gradually lose their optical transparency. Hence, we could not visu-alize spines in the more mature brain.
Spine categories and structural plasticity
Morphological transitions during spine development
In vivoobservations have shown that dendritic spines were highly motile [1,14,63], and spines
were classified into only two types, spine and filopodia, rather than 4 types (mushroom, stubby, thin, and filopodia). Therefore, details of morphological transitions are limited in previous reports. We observed morphological transitions among all spine categories and found that dif-ferent spines have diverse preferences during morphological transitions from one spine type to others. Large spines are more likely to preserve synaptic connections between mushroom and stubby spines. Most small spines disappear directly or transform between filopodia and thin spines, and only a small number of thin spines develop into large spines. The morphological transitions are thought to be directly controlled by actin, which is a highly dynamic and con-centrated component in the spine and regulates spine protrusion and retraction bidirectionally. Spine dynamic changes are tightly correlated with synaptic architectures [64,65]. In addition to subcellular factors of neurons, spine motility is also developmentally regulated, as fewer transitions occur in mature neurons than in developing neurons [11].
Dendritic spine stability after olfactory nerve severance
After blocking the input from mitral/tufted cells, dendritic spine stability was not affected and the 4 spine types showed little change, which suggests that sensory input has limited effects on interneuron dendritic spines in the developing tadpole. Similar data were obtained from adult-born interneurons in the mouse OB after odor deprivation [54]. Anotherin vivostudy indi-cated that in the barrel cortex, spine motility was sensitive to input deprivation during a critical period, but had no effect in younger or older animals [1]. Although we observed that, olfactory nerve severance had limited effects on interneuron dendritic spines, it is possible that spines are regulated by development rather than sensory experiences as shown in previous reports [7,
11]. Our data support a model in which dendritic dynamics ofXenopusOB neurons are
com-parable to those of mammalian cortical neurons.
In the present study, instead of using a pharmacological method to block activity, an olfac-tory nerve severance was performed to block input from mitral/tufted cells. For the aquatic
Xenopustadpoles with extremely small brains, it is difficult to achieve specific blocking effects
using pharmacological manipulations such as TTX delivery due to diffusion to other tissues. This study inXenopusestablished a classic but new animal model for spine studies. It could be widely applied in spine research, such as spinogenesis, spine pruning, spine plasticity, and spine pathology in brain disorders.
Supporting Information
S1 Fig. Olfactory nerve severance.A small amount of 1% DiI was injected into the olfactory bulb for retrograde tracing of the olfactory nerves. Severance was performed under bright field and confirmed under a fluorescence microscope (A, C). Intact olfactory nerves and completely disconnected olfactory nerves (C, D).
(TIF)
Acknowledgments
Author Contributions
Conceived and designed the experiments: YBH CRH LZ WY BH. Performed the experiments: YBH CRH BH. Analyzed the data: YBH CRH. Contributed reagents/materials/analysis tools: YBH CRH LZ WY BH. Wrote the paper: YBH CRH BH.
References
1. Lendvai B, Stern EA, Chen B, Svoboda K. Experience-dependent plasticity of dendritic spines in the developing rat barrel cortex in vivo. Nature. 2000 Apr 20; 404(6780):876–81. PMID:10786794 2. Trachtenberg JT, Chen BE, Knott GW, Feng GP, Sanes JR, Welker E, et al. Long-term in vivo imaging
of experience-dependent synaptic plasticity in adult cortex. Nature. 2002 Dec 26; 420(6917):788–94. PMID:12490942
3. Holtmaat A, Svoboda K. Experience-dependent structural synaptic plasticity in the mammalian brain. Nat Rev Neurosci. 2009 Sep; 10(9):647–58. doi:10.1038/nrn2699PMID:19693029
4. Hofer SB, Bonhoeffer T. Dendritic spines: the stuff that memories are made of? Curr Biol. 2010 Feb 23; 20(4):R157–9. doi:10.1016/j.cub.2009.12.040PMID:20178760
5. Kasai H, Fukuda M, Watanabe S, Hayashi-Takagi A, Noguchi J. Structural dynamics of dendritic spines in memory and cognition. Trends Neurosci. 2010 Mar; 33(3):121–9. doi:10.1016/j.tins.2010.01.001
PMID:20138375
6. Fu M, Zuo Y. Experience-dependent structural plasticity in the cortex. Trends Neurosci. 2011 Apr; 34 (4):177–87. doi:10.1016/j.tins.2011.02.001PMID:21397343
7. Dunaevsky A, Tashiro A, Majewska A, Mason C, Yuste R. Developmental regulation of spine motility in the mammalian central nervous system. P Natl Acad Sci USA. 1999 Nov 9; 96(23):13438–43.
8. Harris KM. Structure, development, and plasticity of dendritic spines. Curr Opin Neurobiol. 1999 Jun; 9 (3):343–8. PMID:10395574
9. Majewska A, Sur M. Motility of dendritic spines in visual cortex in vivo: changes during the critical period and effects of visual deprivation. Proc Natl Acad Sci U S A. 2003 Dec 23; 100(26):16024–9. PMID:
14663137
10. Zuo Y, Lin A, Chang P, Gan WB. Development of long-term dendritic spine stability in diverse regions of cerebral cortex. Neuron. 2005 Apr 21; 46(2):181–9. PMID:15848798
11. Hering H, Sheng M. Dendritic spines: structure, dynamics and regulation. Nat Rev Neurosci. 2001 Dec; 2(12):880–8. PMID:11733795
12. Nimchinsky EA, Sabatini BL, Svoboda K. Structure and function of dendritic spines. Annual Review Of Physiology. 2002; 64:313–53. PMID:11826272
13. Kasai H, Matsuzaki M, Noguchi J, Yasumatsu N, Nakahara H. Structure-stability-function relationships of dendritic spines. Trends Neurosci. 2003 Jul; 26(7):360–8. PMID:12850432
14. Bhatt DH, Zhang S, Gan WB. Dendritic spine dynamics. Annual review of physiology. 2009; 71:261– 82. doi:10.1146/annurev.physiol.010908.163140PMID:19575680
15. Hutson LD, Chien CB. Wiring the zebrafish: axon guidance and synaptogenesis. Curr Opin Neurobiol. 2002 Feb; 12(1):87–92. PMID:11861169
16. Jontes JD, Buchanan J, Smith SJ. Growth cone and dendrite dynamics in zebrafish embryos: early events in synaptogenesis imaged in vivo. Nat Neurosci. 2000 Mar; 3(3):231–7. PMID:10700254 17. Meyer MP, Smith SJ. Evidence from in vivo imaging that synaptogenesis guides the growth and
branching of axonal arbors by two distinct mechanisms. J Neurosci. 2006 Mar 29; 26(13):3604–14. PMID:16571769
18. McFarlane S, Lom B. The Xenopus retinal ganglion cell as a model neuron to study the establishment of neuronal connectivity. Dev Neurobiol. 2012 Apr; 72(4):520–36. doi:10.1002/dneu.20928PMID:
21634016
19. Alsina B, Vu T, Cohen-Cory S. Visualizing synapse formation in arborizing optic axons in vivo: dynam-ics and modulation by BDNF. Nat Neurosci. 2001 Nov; 4(11):1093–101. PMID:11593233
20. Kimmel CB, Hatta K, Metcalfe WK. Early Axonal Contacts during Development Of an Identified Den-drite In the Brain Of the Zebrafish. Neuron. 1990 Apr; 4(4):535–45. PMID:2322459
21. Cline HT. Dendritic arbor development and synaptogenesis. Curr Opin Neurobiol. 2001 Feb; 11 (1):118–26. PMID:11179881
23. Sin WC, Haas K, Ruthazer ES, Cline HT. Dendrite growth increased by visual activity requires NMDA receptor and Rho GTPases. Nature. 2002 Oct 3; 419(6906):475–80. PMID:12368855
24. Kalueff AV, Stewart AM, Gerlai R. Zebrafish as an emerging model for studying complex brain disor-ders. Trends In Pharmacological Sciences. 2014 Feb; 35(2):63–75. doi:10.1016/j.tips.2013.12.002
PMID:24412421
25. Pratt KG, Khakhalin AS. Modeling human neurodevelopmental disorders in the Xenopus tadpole: from mechanisms to therapeutic targets. Dis Model Mech. 2013 Sep; 6(5):1057–65. doi:10.1242/dmm. 012138PMID:23929939
26. Yu X, Zuo Y. Spine plasticity in the motor cortex. Curr Opin Neurobiol. 2011 Feb; 21(1):169–74. doi:10. 1016/j.conb.2010.07.010PMID:20728341
27. Gahtan E, O'Malley DM. Visually guided injection of identified reticulospinal neurons in zebrafish: A sur-vey of spinal arborization patterns. J Comp Neurol. 2003 Apr 28; 459(2):186–200. PMID:12640669 28. Chien CB, Rosenthal DE, Harris WA, Holt CE. Navigational Errors Made by Growth Cones without
Filo-podia In the Embryonic Xenopus Brain. Neuron. 1993 Aug; 11(2):237–51. PMID:8352941
29. Cohencory S, Fraser SE. Effects Of Brain-Derived Neurotrophic Factor on Optic Axon Branching And Remodeling In-Vivo. Nature. 1995 Nov 9; 378(6553):192–6. PMID:7477323
30. Hu B, Nikolakopoulou AM, Cohen-Cory S. BDNF stabilizes synapses and maintains the structural com-plexity of optic axons in vivo. Development. 2005 Oct; 132(19):4285–98. PMID:16141221
31. Lin BJ, Chen TW, Schild D. Cell type-specific relationships between spiking and [Ca2+](i) in neurons of the Xenopus tadpole olfactory bulb. J Physiol-London. 2007 Jul 1; 582(1):163–75.
32. Schwartz N, Schohl A, Ruthazer ES. Neural Activity Regulates Synaptic Properties and Dendritic Struc-ture In Vivo through Calcineurin/NFAT Signaling. Neuron. 2009 Jun 11; 62(5):655–69. doi:10.1016/j. neuron.2009.05.007PMID:19524525
33. Haas K, Li J, Cline HT. AMPA receptors regulate experience-dependent dendritic arbor growth in vivo. Proc Natl Acad Sci U S A. 2006 Aug 8; 103(32):12127–31. PMID:16882725
34. Scheidweiler U, Nezlin L, Rabba J, Muller B, Schild D. Slice culture of the olfactory bulb of Xenopus lae-vis tadpoles. Chem Senses. 2001 May; 26(4):399–407. PMID:11369674
35. Nieuwkoop PD, Faber J. Normal table of Xenopus laevis (DAUDIN): A systematical and chronological survey of the development from the fertilized egg till the end. Amsterdam: North Holland Publishing Co.; 1956.
36. Nevian T, Helmchen F. Calcium indicator loading of neurons using single-cell electroporation. Pflugers Arch. 2007 Jul; 454(4):675–88. PMID:17334778
37. Bestman JE, Ewald RC, Chiu SL, Cline HT. In vivo single-cell electroporation for transfer of DNA and macromolecules. Nat Protoc. 2006; 1(3):1267–72. PMID:17406410
38. Craven SE, El-Husseini AE, Bredt DS. Synaptic targeting of the postsynaptic density protein PSD-95 mediated by lipid and protein motifs. Neuron. 1999 Mar; 22(3):497–509. PMID:10197530
39. El-Hussein AE, Schnell E, Chetkovich DM, Nicoll RA, Bredt DS. PSD-95 involvement in maturation of excitatory synapses. Science. 2000 Nov 17; 290(5495):1364–8. PMID:11082065
40. Wu GY, Cline HT. Time-lapse in vivo imaging of the morphological development of Xenopus optic tectal interneurons. J Comp Neurol. 2003 May 12; 459(4):392–406. PMID:12687706
41. Sanchez AL, Matthews BJ, Meynard MM, Hu B, Javed S, Cory SC. BDNF increases synapse density in dendrites of developing tectal neurons in vivo. Development. 2006 Jul 1; 133(13):2477–86. PMID:
16728478
42. Ruthazer ES, Schohl A, Schwartz N, Tavakoli A, Tremblay M, Cline HT. In vivo time-lapse imaging of neuronal development in Xenopus. Cold Spring Harb Protoc. 2013 Sep; 2013(9):804–9. doi:10.1101/ pdb.top077156PMID:24003201
43. Cohen-Cory S. Imaging retinotectal synaptic connectivity. CSH Protoc. 2007; 2007:pdb prot4782. doi:
10.1101/pdb.prot4782PMID:21357121
44. Harris KM, Jensen FE, Tsao B. Three-dimensional structure of dendritic spines and synapses in rat hip-pocampus (CA1) at postnatal day 15 and adult ages: implications for the maturation of synaptic physiol-ogy and long-term potentiation. J Neurosci. 1992 Jul; 12(7):2685–705. PMID:1613552
45. Nezlin LP, Schild D. Structure of the olfactory bulb in tadpoles of Xenopus laevis. Cell Tissue Res. 2000 Oct; 302(1):21–9. PMID:11079712
46. Manzini I, Schild D. cAMP-independent olfactory transduction of amino acids in Xenopus laevis tad-poles. J Physiol-London. 2003 Aug; 551(1):115–23.
48. Okabe S, Miwa A, Okado H. Spine formation and correlated assembly of presynaptic and postsynaptic molecules. J Neurosci. 2001 Aug 15; 21(16):6105–14. PMID:11487634
49. Niell CM, Meyer MP, Smith SJ. In vivo imaging of synapse formation on a growing dendritic arbor. Nat Neurosci. 2004 Mar; 7(3):254–60. PMID:14758365
50. Hofer SB, Mrsic-Flogel TD, Bonhoeffer T, Hubener M. Experience leaves a lasting structural trace in cortical circuits. Nature. 2009 Jan 15; 457(7227):313–U4. doi:10.1038/nature07487PMID:19005470 51. Tropea D, Majewska AK, Garcia R, Sur M. Structural Dynamics of Synapses in Vivo Correlate with
Functional Changes during Experience-Dependent Plasticity in Visual Cortex. J Neurosci. 2010 Aug 18; 30(33):11086–95. doi:10.1523/JNEUROSCI.1661-10.2010PMID:20720116
52. Hering H, Sheng M. Dentritic spines: structure, dynamics and regulation. Nat Rev Neurosci. 2001 12// print; 2(12):880–8. PMID:11733795
53. Nezlin LP, Heermann S, Schild D, Rossler W. Organization of glomeruli in the main olfactory bulb of Xenopus laevis tadpoles. J Comp Neurol. 2003 Sep 22; 464(3):257–68. PMID:12900923
54. Mizrahi A. Dendritic development and plasticity of adult-born neurons in the mouse olfactory bulb. Nat Neurosci. 2007 Apr; 10(4):444–52. PMID:17369823
55. Byrd CA, Burd GD. Development Of the Olfactory-Bulb In the Clawed Frog, Xenopus-Laevis—a Mor-phological And Quantitative-Analysis. J Comp Neurol. 1991 Dec 1; 314(1):79–90. PMID:1797876 56. Kornau HC, Schenker LT, Kennedy MB, Seeburg PH. Domain interaction between NMDA receptor
subunits and the postsynaptic density protein PSD-95. Science. 1995 Sep 22; 269(5231):1737–40. PMID:7569905
57. Niethammer M, Kim E, Sheng M. Interaction between the C terminus of NMDA receptor subunits and multiple members of the PSD-95 family of membrane-associated guanylate kinases. J Neurosci. 1996 Apr 1; 16(7):2157–63. PMID:8601796
58. Ebihara T, Kawabata I, Usui S, Sobue K, Okabe S. Synchronized formation and remodeling of postsyn-aptic densities: Long-term visualization of hippocampal neurons expressing postsynpostsyn-aptic density pro-teins tagged with green fluorescent protein. J Neurosci. 2003 Mar 15; 23(6):2170–81. PMID:12657676 59. Livneh Y, Feinstein N, Klein M, Mizrahi A. Sensory input enhances synaptogenesis of adult-born
neu-rons. J Neurosci. 2009 Jan 7; 29(1):86–97. doi:10.1523/JNEUROSCI.4105-08.2009PMID:19129387 60. Fiala JC, Feinberg M, Popov V, Harris KM. Synaptogenesis via dendritic filopodia in developing
hippo-campal area CA1. J Neurosci. 1998 Nov 1; 18(21):8900–11. PMID:9786995
61. Harris KM, Stevens JK. Dendritic spines of CA 1 pyramidal cells in the rat hippocampus: serial electron microscopy with reference to their biophysical characteristics. J Neurosci. 1989 Aug; 9(8):2982–97. PMID:2769375
62. Bourne JN, Harris KM. Balancing structure and function at hippocampal dendritic spines. Annual Review Of Neuroscience. 2008; 31:47–67. doi:10.1146/annurev.neuro.31.060407.125646PMID:
18284372
63. Holtmaat AJGD, Trachtenberg JT, Wilbrecht L, Shepherd GM, Zhang XQ, Knott GW, et al. Transient and persistent dendritic spines in the neocortex in vivo. Neuron. 2005 Jan 20; 45(2):279–91. PMID:
15664179
64. Korobova F, Svitkina T. Molecular architecture of synaptic actin cytoskeleton in hippocampal neurons reveals a mechanism of dendritic spine morphogenesis. Mol Biol Cell. 2010 Jan 1; 21(1):165–76. doi:
10.1091/mbc.E09-07-0596PMID:19889835