Conserved Essential Genes and Diversity of the
Pan-Genome
Wei Liu1, Liurong Fang1, Mao Li1, Sha Li1, Shaohua Guo1, Rui Luo1, Zhixin Feng2, Bin Li2, Zhemin Zhou3, Guoqing Shao2, Huanchun Chen1, Shaobo Xiao1*
1Division of Animal Infectious Diseases, State Key Laboratory of Agricultural Microbiology, College of Veterinary Medicine, Huazhong Agricultural University, Wuhan, People’s Republic of China,2Institute of Veterinary Medicine, Jiangsu Academy of Agricultural Sciences, Nanjing, People’s Republic of China,3Environmental Research Institute, University College Cork, Cork, Ireland
Abstract
Mycoplasma, the smallest self-replicating organism with a minimal metabolism and little genomic redundancy, is expected to be a close approximation to the minimal set of genes needed to sustain bacterial life. This study employs comparative evolutionary analysis of twentyMycoplasmagenomes to gain an improved understanding of essential genes. By analyzing the core genome of mycoplasmas, we finally revealed the conserved essential genes set for mycoplasma survival. Further analysis showed that the core genome set has many characteristics in common with experimentally identified essential genes. Several key genes, which are related to DNA replication and repair and can be disrupted in transposon mutagenesis studies, may be critical for bacteria survival especially over long period natural selection. Phylogenomic reconstructions based on 3,355 homologous groups allowed robust estimation of phylogenetic relatedness among mycoplasma strains. To obtain deeper insight into the relative roles of molecular evolution in pathogen adaptation to their hosts, we also analyzed the positive selection pressures on particular sites and lineages. There appears to be an approximate correlation between the divergence of species and the level of positive selection detected in corresponding lineages.
Citation:Liu W, Fang L, Li M, Li S, Guo S, et al. (2012) Comparative Genomics of Mycoplasma: Analysis of Conserved Essential Genes and Diversity of the Pan-Genome. PLoS ONE 7(4): e35698. doi:10.1371/journal.pone.0035698
Editor:Cecile Fairhead, Institut de Genetique et Microbiologie, France
ReceivedOctober 11, 2011;AcceptedMarch 20, 2012;PublishedApril 20, 2012
Copyright:ß2012 Liu et al. This is an open-access article distributed under the terms of the Creative Commons Attribution License, which permits unrestricted use, distribution, and reproduction in any medium, provided the original author and source are credited.
Funding:This work was supported by the National Natural Sciences Foundation of China (31170160, 31001080 and 31001066). The funders had no role in study design, data collection and analysis, decision to publish, or preparation of the manuscript.
Competing Interests:The authors have declared that no competing interests exist.
* E-mail: [email protected]
Introduction
Mycoplasmas are widespread in nature as parasites of humans, mammals, reptiles, fish, arthropods, and plants [1]. As a conditional pathogenic organism, it associates with various diseases, including pneumonia, arthritis, meningitis and chronic urogenital tract disease [2]. Although they are the smallest self-replicating organisms, both commensal forms and pathogenic forms are diverse. With a minimal metabolism and little genomic redundancy, the genome ofMycoplasmais expected to be a close approximation to the minimal set of genes needed to sustain bacterial life [3]. An early projection proposed a minimal gene set composed of 206 genes based on the analysis of eight free-living and endosymbiotic bacterial genomes [4]. More recently, Glasset al. [5] performed a global transposon mutagenesis study and identified 100 putatively nonessential genes in M. genitalium. Logically, the remaining 387 genes presumably constitute the set of essential genes. However, these data greatly exceed theoretical projections of how many genes comprise a minimal genome, as proposed by Gilet al.[4].
Natural selection leads to the fixation of essential genes and can delete nonessential genes in a wide range of species [6,7]. This process is similar, but more robust than manual mutagenesis studies. Through long term evolution form a more conventional
progenitor in theFirmicutestaxon [8],Mycoplasmashave undergone a process of massive genome reduction [1]. These wall-less bacteria are obligate parasites that live in relatively unchanging niches requiring little adaptive capability.M. genitalium, a human urogenital pathogen, is the extreme manifestation of this genomic parsimony, having only 482 protein-coding genes and the smallest genome of any known free-living organism capable of being grown in axenic culture [9]. Thus, with little genomic redundancy and contingencies for different environmental conditions,Mycoplasmas
are regarded as optimal microbes to perform genes essentiality studies [5]. Along with the burgeoning increase in Mycoplasma
genome sequence data, this would appear to be the right time to explore gene essentiality from a comparative genomics perspec-tive.
infect laboratory cell lines, implying that it can thrive among different species of cell lines [11]. A strong link between M. hyorhinisand human cancer was reported recently by Huanget al.
[12], who used a monoclonal antibody against the unique M. hyorhinis–specific protein p37 to detect mycoplasma in over 600 carcinoma tissues from a variety of organs. The study indicated that up to 56% of gastric carcinoma and 55% of colon carcinoma biopsies were positive forM. hyorhinis[12]. With a similar genome size, M. hyorhinis and M. hyopneumoniae exhibit high levels of functional diversity. Interest has therefore shifted to questions of whyM. hyorhiniscan thrive among different species of cell lines.
This paper communicates the results of three major analyses. In the first analysis, we present the details of a comparative analysis of twentyMycoplasmastrains and investigate the conserved essential genes set for mycoplasma survival. For the second analysis, phylogenomic reconstructions based on 3,355 homologous groups allows robust estimation of phylogenetic relatedness among mycoplasma strains. The third analysis employs the branch-site method to assess positive selection pressures on particular sites and lineages. There appears to be an approximate correlation between the divergence of species and the level of positive selection detected in corresponding lineages.
Results
Diversity ofMycoplasmataceaefamily: core genomevs. flexible gene pool
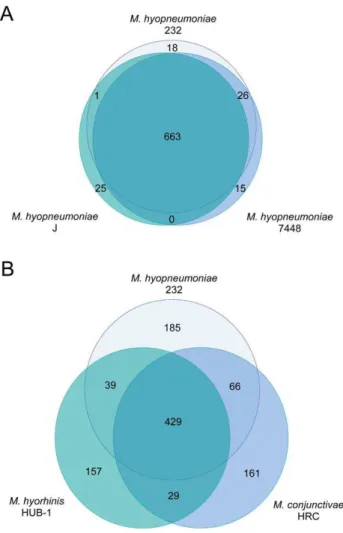
The number of protein coding genes per genome within the various strains and species of mycoplasmas is relatively similar (ranging from 475 to 1,037; Table 1), but the gene composition of these genomes is much more variable. Based on the gene content table (obtained as described in Materials and Methods; Table S1), threeM. hyopneumoniaestrains share about 95% of their genes, and
three different species of mycoplasmas share only around 71% of their genes (Figure 1). This latter result appears to be independent of the particular strains or species involved in the comparison. Even with the inclusion of 20 genomes, the pan-genome size of
Mycoplasmasappears not to be determined, and we estimate that the size probably surpasses 8,000 genes. This huge pan-genome size may be a reflection of their different lifestyles in distinct ecological niches. Within species, the pan-genome size also remains uncertain, although our estimates suggest that the pan-genome size ofM. hyopneumoniaeis smaller.
The extent of the pan-genome is opposed to the core. Genes that are in common between the different species within the family
Mycoplasmataceae comprised our core genome - the set of orthologous genes determined the common properties of this family. In this work, the tribeMCL program was used to cluster orthologous genes, and a total of 13,654 predicted proteins were grouped into 3,355 clusters, each cluster representing a group of putative orthologs. The 1,481 genes that are present in single genomes (Figure 2) represent lineage specific genes. In addition, the 196 genes shared by all the 20 strains comprised our core genome (Figure 3).
Functional Characterization of the Core Genome
The use of the core genome concept has led to important insights into the evolution of bacterial species and identification of potentially important novel genes [13]. In terms of functional assignments according to COGs, almost half (42.3%) of the proteins observed from the core genome are devoted to translation, ribosomal structure, and biogenesis (Figure S1). Our results support the analysis of Ouzounis and Kyrpides [14], who demonstrated that genetic processes such as translation are conserved and close to the original form. Strikingly, 10.6% of the observed core genes have resisted functional assignments
Table 1.Bacterial Strains Used in This Study.
Mollicute strains Host CDS Genome size (bp) Accession Citation
U. urealyticumserovar 10 str. ATCC 33699 Human 646 874478 CP001184
-U. parvumserovar 3 str. ATCC 700970 Human 611 751719 AF222894 [45]
U. parvumserovar 3 str. ATCC 27815 Human 609 751679 CP000942
-M. synoviae53 Bird 659 799476 NC_007294 [46]
M. pulmonisUAB CTIP Rodent - 963879 AL445566 [47]
M. pneumoniaeM129 Human 688 816394 U00089 [48]
M. penetransHF-2 Human 1037 1358633 BA000026 [49]
M. mycoidessubsp. mycoides SC str. PG1 Ruminant 1016 1211703 BX293980 [50]
M. mobile163K Fish 635 777079 AE017308 [51]
M. hyorhinisHUB-1 Swine 658 839615 NC_014448 [52]
M. hyopneumoniaeJ Swine 657 897405 NC_007295 [46]
M. hyopneumoniae7448 Swine 657 920079 NC_007332 [46]
M. hyopneumoniae232 Swine 691 892758 NC_006360 [53]
M. genitaliumG37 Human 475 580076 NC_000908 [5]
M. gallisepticumstr. R(low) Bird 763 1012800 AE015450 [54]
M. crocodyliMP145 Crocodile 689 934379 CP001991
-M. conjunctivaeHRC Sheep and goats 696 846214 FM864216 [55]
M. capricolumsubsp. ATCC 27343 Ruminant 812 1010023 CP000123
-M. arthritidis158L3-1 Rats and mice 631 820453 NC_011025 [56]
M. agalactiaePG2 Sheep and goats 759 877438 CU179680
according to COGs classification (Table S2), which highlights the need for better functional characterization of these genes. Furthermore, by comparing functional categories of the core
genome with the categories of the genome ofM. hyorhinisHUB-1, we noticed that a large array of proteins devoted to amino acid, carbohydrate transport and metabolism, as well as defense mechanisms, were sharply reduced. Our results support the analysis of Fraser et al. [9] and Himmelreich et al. [15], who demonstrated that bothM. genitaliumandM. pneumoniaelost all the genes involved in amino acid synthesis, and their survival is totally dependent on an exogenous supply of the complete spectrum of amino acids. Beyond this, the pronounced reduction of those functional categories observed in the core genome might be the further genetic evidence for gene loss in M. genitalium and M. pneumonia[9,15].
Persistent Nonessential Genesvs.Essential Genes
Identification of the core genome has important implications for a broad range of microbiological applications, such as determining the essentiality of genes derived from the core genome and deriving traits that correspond to a common ancestor (orthology) [4]. In this work, we classified the core genome into two classes according to persistence and essentiality: persistent nonessential genes and conserved essential genes (Figure 3). Glass et al. [5] performed a global transposon mutagenesis study and identified 100 putatively nonessential genes in M. genitalium. We mapped those nonessential genes onto theM. hyorhinisHUB-1 genome and 24 of them were persistent amongMycoplasmagenomes.
Focusing on gene persistence, the essentiality of a gene is relative to a set of experimental conditions. It is quite different for a cell to survive in a laboratory setting, with plenty of supplied metabolites, compared to thriving in the wild, where it competes with other organisms for limited resources. Starvation or stresses are omnipresent, and the fitness effect of persistent genes may be essential for survival under transition from one environmental condition to another [16]. After transposon mutagenesis, disrupted genes may not be essential for growth in rich media, but their loss may lead to such a low fitness that its deletion will never be fixed in natural populations [16]. For example, Glasset al.[5] isolated six mutants involved in recombination and DNA repair:recA, recU, Holliday junction DNA helicases uvrA and uvrB, formamidopyr-imidine-DNA glycosylase mutM, which excises oxidized urines from DNA, and a likely DNA damage inducible protein gene. Interestingly, we noticed that these six disrupted genes occur in the core genome set, which suggests that these disrupted persistent
Figure 2. Frequency of genes within the 20 genomes included in this analysis.Genes present in a single genome represent lineage specific genes, while at the opposite end of the scale, genes found in all 20 genomes represent theMycoplasmacore genome.
doi:10.1371/journal.pone.0035698.g002
genes might be critical for growth in variable environments over long periods. The survival of these mutants is probably due to their tolerances of IS element within a relatively short period. According to Glasset al., these six mutants grew more poorly after repeated passage, which indicates that those genes are also critical for bacterial survival [5]. Our results in this regard generally agree with the analysis by Glass et al. This analysis prompted us to explore gene essentiality by combining both the experimental approaches and comparative genomics analysis.
Genome-Based Reconstruction ofMycoplasmataceae Phylogeny
We constructed robust phylogenies for the family Mycoplasma-taceaebased on whole genome analysis. The supertree contains five major, distinct clades (Figure 4). In clade I, threeUreaplasmastrains with a common host are clustered on a single branch. In clade II, six mycoplasma species (M. pulmonis etc.) with various lifestyles formed the cluster. In clade III, the strain HRC appears adjacent to strain HUB-1 and three isolates ofM. hyopneumoniaestrains are clustered closely, indicative of a recent common ancestry. In clade IV,M. capricolumandM. mycoidesare clustered closely on a single branch and both of them are the agents of ruminant mycoplas-mosis. In clade V, M. genitalium and M. pneumoniae are closely related, together withM. penetransandM. gallisepticum, forming the cluster.
Although single gene trees have been used extensively to estimate the species tree, evidence has shown that single gene trees may have particular difficulty in representing prokaryotic species phylogeny, because lateral gene transfer (LGT) occurs among prokaryotic genomes, and LGT may obscure the phylogenetic signal [17]. In this work, the 16S rRNA-based phylogeny has also been reconstructed for the family Mycoplasmataceae (Figure 5), which shows almost the same topology as the supertree. However, these two trees differ in the placement ofM. penetransHF-2 andM. mobile163.
A recent study proposed that the ‘‘Tree of Life’’ may be resolved by concatenation of 31 orthologs occurring in 191 species [18], and an analogous approach has been applied to inferMycoplasmas
phylogeny by random concatenation of 91 protein sequences shared by 16mollicutes[19]. The placement ofM. penetransin the concatenation-based phylogeny is consistent with the supertree (Figure 4).
Positive Selection Analysis
We employed the branch-site test of Yang and Nielsen [20,21] implemented in the program HY-PHY (http://www.datam0nk3y. org/hyphy/doku.php) to assess positive selection [22,23] at particular sites in particular lineages. This method compares synonymous and nonsynonymous substitution rates in protein coding genes and regards a nonsynonymous rate elevated above the synonymous rate as evidence for positive selection. For the Figure 3. Viable core and pan genes distribution in the M. hyorhinisHUB-1 map.TheM. hyorhinisHUB-1 genome is shown at a scale of 100 kb per line. Colored arrows above the line indicate annotated genes. Genes are colored according to their functional category, as indicated in the key. rRNAs and tRNAs are denoted by red and purple rectangles, respectively. Red triangles above the line represent the core genes ofMycoplasmataceae. Blue triangles above the line represent the genes shared by all the species in clade III, but which are absent from other lineages. Black triangles below the line represent the disrupted genes documented in M. genitalium G37, mapped onto theM. hyorhinisHUB-1 genome [5].
Mycoplasma data set, both swine-infecting and human-infecting lineages were tested. The branches we tested are highlighted in red on Figure 4.
In the four swine-infected lineages (HUB-1 lineage, MC lineage, MH lineage, and the common ancestor of clade III), 661 orthologous groups shared by all species in clade III were tested. A total of 23 genes were identified to be under positive selection (Table 2). These genes were assigned to functional categories according to the COG database. We found that a large fraction of the genes subject to positive selection were connected to DNA replication, recombination, and repair. Successful genome repli-cation is essential for growth and survival of an organism, and polymerase complexes often fail to complete this task [24]. Also, replication is thought to contribute to proliferation and efficiency of the colonization of hostile environments [25]. Interestingly, we detected that positive selection occurs in the both of thednaAand
dnaNgenes, which comprise theoriCregion inM. hyorhinis, and in several copies of proteins connected to replication, recombination and repair in both MC lineage and the common ancestor of clade III. Selection pressure on these genes could reflect constraints on efficient genome replication during colonization and proliferation in the hostile environment of the host [25].
In the case of human-infecting lineages, the lineage that stood out from the rest with regard to host specificity wasM. gallisepticum, which is significantly associated with chronic respiratory disease in chickens [26]. Not surprisingly, this lineage was identified to be under the strongest selection pressure in clade V (Table S3). However, we failed to notice any selection pressure on thednaA
and dnaN genes in the MG lineage. A large number of genes related to DNA repair, RNA processing, Amino acid transport and metabolism were found under positive selection. Selection pressure on these genes may facilitate evolutionary flexibility in the MG lineage, hence its ability to adapt to new environments.
Discussion
Numerous global transposon mutagenesis studies of minimal genomes have been performed to identify essential genes [5,27]. Long-term natural selection can also delete nonessential genes in a wide range of species [6,7], which is similar to, but more robust than, manual mutagenesis studied. With a minimal metabolism and little genomic redundancy, mycoplasmas are regarded as optimal microbes for the identification of essential genes [1]. It is believed that theMycoplasmasevolved from a more conventional progenitor in theFirmicutestaxon by a process of massive genome Figure 4. Phylogenetic tree ofMycoplasmataceae.The phylogenetic relationship was estimated and tested in one thousand bootstrap samples using TREE-PUZZLE version 5.2 with a BIONJ model (see Materials and Methods). This supertree shows five major distinct clades. The four lineages that were used as foreground in the branch-site model positive selection test are highlighted in red.
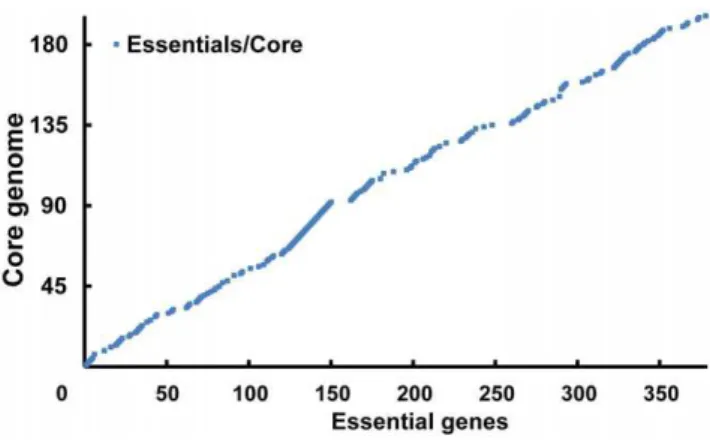
reduction [16]. We found that each of the species in Mycoplasma-taceae has undergone a similar process. These species have undergone various natural selection pressures in different environments. Most of the core genes remaining for such a long time should be considered as the essential genes needed by all the species within this family. Generally speaking, our comparative analysis was highly consistent with the studies by Glass et al.
(Figure 6); however, we identified more genes that may have been deleted due to natural selection. The six genes differing between the two studies are all key genes of DNA replication and DNA repair:recA,recU, Holliday junction DNA helicasesuvrAanduvrB,
mutM and a likely DNA damage inducible protein gene. Those genes are core genes, but were disrupted in transposon mutagenesis studies [5]. Interestingly, Glasset al.stated that these six mutants grew more poorly after repeated passage, probably due to an accumulation of cell damage over time. This indicates that these six disrupted core genes may be critical for bacterial survival, especially over long periods. Therefore, we classified these genes as truly essential genes.
Although transposon mutagenesis has proven to be a useful method and has been used extensively to determine the essentiality of genes [27], this method is highly dependent on environmental conditions. For the most part, mutagenesis studies performed under nutrient-rich conditions provide a substantial underestimate of the number of genes that are essential under host environmental
conditions [28]. In reality, it is quite different for a cell to survive in a laboratory setting and to thrive in the wild. Transposon mutagenesis might misclassify nonessential genes that slow growth without arresting it but can also miss essential genes that tolerate transposon insertions [4]. However, comparative genomics analysis has also limitations, since it is likely to underestimate the core genome because it takes into account only the genes that have remained similar enough during the course of evolution to be recognized as true orthologues. Therefore, it will not include genes with a high rate of evolution, which may not show their relationship in comparisons of distant taxons [4]. Taken together, both the experimental approaches and comparative genomics analysis should be taken into account when addressing questions of essentiality. Besides, the core genes set proposed in the current study are only essential for most species within this family. We failed to estimate the conserved genes needed for single species. Each member of a particular species was maintained in a distinct ecological niche, in which some of the genes that were not present in core genome may also be important for the mycoplasma survival. These genes may be termed ‘‘lineage specific’’ essential genes. As more genome sequence becomes available in the future, there will be an opportunity to explore more properties of species special core genes set using comparative genomic tools.
To date, most mycoplasma phylogenies have been derived from single gene comparisons, or from concatenated alignments of a Figure 5. 16S rRNA tree ofMycoplasmataceae.This consensus tree of 100 bootstrap replications was constructed based on 16S rRNA sequences using the Neighbor Joining (NJ) method implemented in MEGA 4.1. The bootstrap values are marked at the root of each branch.
small number of genes. The increasing availability of mycoplasma genomes presents an opportunity to reconstruct evolutionary events using entire genomes [29,30]. As a tool for future comparative phylogenetic studies, we used both supertrees and single gene alignments to infer relationships between 20 strains of the family Mycoplasmataceae. Our supertree and 16S rRNA phylogenies are consistent in most of their branches. However, there are conflicts regarding whetherM. penetransis clustered with theUreaplasmalineage or with Clade V, as well as the placement of
M. mobile163. We also compared our trees with a recent study, in which the phylogeny of the Mycoplasmas was reconstructed by random concatenation of 91 protein sequences shared by 16
mollicutes[19]. The placement ofM. penetransin the concatenation-based phylogeny is consistent with the supertree, while the bootstrap value ( = 62) of the branch ofM. penetransandUreaplasma
in the 16S rRNA tree is low. Therefore, we placedM. penetransinto clade V. The location ofM. mobile163 is different among all three trees, which indicates a complicated phylogenic history for this
strain, which may have involved recombination or other LGT events.
Phylogenetic reconstruction based upon concatenation of multiple orthologous genes can generate a more accurate tree than that done with a single gene [31,32]. The supertree is even better than the concatenation-based tree, because it is immune to long-branch attraction artifacts [33,34]. Thus, a robust supertree was constructed in this study to present the phylogeny of the family
Mycoplasmataceae. The supertree was then used as a foreground for further analysis. Based on the supertree of Mycoplasmataceae, we classified these twenty strains into five different clades, between which the host specificity varies. All three strains in Clade I and three of the four strains in Clade V (exceptM. gallisepticum) were identified to be agents of human infection; therefore, these two clades form the human-infecting lineage. Both of the two sequenced strains in clade IV are the agent of ruminant infection, and thus represent the ruminant-infecting lineage. Four of the five strains in Clade III (exceptM. conjunctivae) are associated with swine mycoplasmosis and form the swine-infecting lineage. Briefly, most
Table 2.Genes under Positive Selection in Swine-infecting Lineages.
Lineage Gene dN/dSa Sequence % COG(s) Product
MH Lineage mhp623 543.871 16.60% COG1744R ABC transporter
mhp388 306.029 5.00% COG3037S ascorbate-specific PTS system enzyme IIC
mhp603 4.42 0.00% COG0195K transcription elongation factor NusA
mhp368 4.773 9.70% COG0531E putative membrane lipoprotein
mhp595 515.577 13.40% COG0266L formamidopyrimidine-DNA glycosylase
mhp480 1913.82 15.20% - hypothetical protein
MC Lineage MCJ_005740 525.955 9.30% COG1196D putative ABC transporter ATP-binding protein P
MCJ_003040 547.097 7.90% COG0013J alanyl-tRNA synthetase
MCJ_007160 227.357 8.10% COG2176L DNA polymerase III PolC
MCJ_002410 488.408 7.20% COG4608E oligopeptide ABC transporter ATP-binding protein
MCJ_000340 316.719 5.10% COG0556L excinuclease ABC subunit B
HUB-1 Lineage MHR_0001 2.122 7.10% COG0593L Chromosomal replication initiator protein dnaA
MHR_0002 786.654 25.60% COG0592L DNA polymerase III beta subunit
MHR_0009 8.155 5.50% COG0525J Valyl tRNA synthetase
MHR_0132 306.624 7.30% COG0060J Isoleucyl tRNA synthetase
MHR_0148 732.204 14.30% COG0006E Xaa-pro aminopeptidase
MHR_0248 2.637 3.60% COG0187L DNA gyrase subunit B
MHR_0318 180.115 16.40% - ABC transporter permease protein
MHR_0377 6.345 9.70% COG0202K DNA-directed RNA polymerase subunit alpha
MHR_0443 33.397 7.70% COG0178L Excinuclease ATPase subunit-like protein
MHR_0609 14.416 16.70% COG0544O Trigger factor
Common AncesterbMHR_0128 133.038 23.40% COG0322L Excinuclease ABC subunit C
MHR_0131 33.679 13.50% COG0188L Topoisomerase IV subunit A
MHR_0310 754.512 15.80% COG2274V ABC transporter ATP-binding and permease protein
MHR_0486 58.164 12.90% COG0587L DNA polymerase III alpha subunit
MHR_0489 3.669 29.10% COG0532J Translation initiation factor IF-2
MHR_0639 8298.46 31.60% - Lipoprotein
MHR_0363 6343.51 14.00% COG1164E Oligoendopeptidase F
MHR_0356 6343.51 14.00% COG1164E Oligoendopeptidase F
aRatio of the nonsynonymous to the synonomous mutation rate (dN/dS) measures the strength of selection, where values
.1 indicate positive selection, and larger values indicate stronger selection.
bIn the common ancestor lineage: a single gene ofM. hyorhinisHUB-1 was used to represent each ortholog group (Table S1). Genes ofM. conjunctivaeHRC and threeM.
species with the same host specificity clustered together, forming a separate clade. There appears to be an approximate correlation between the divergence of species and the level of positive selection detected in different lineages. We suspect that host specificity was determined after the emergence ofMycoplasmaspecies. Subsequent host jumping events may have been caused by a series of natural selection events during evolution.
To gain deeper insights into the molecular evolution events underlying natural selection, we employed the branch-site method to assess positive selection in swine-infecting and human-infect lineages. According to Petersenet al.[35], two categories of genes, immune-related and environmental adaptation related genes, are expected to show strong evidence for positive selection. Our analysis revealed that a number of genes related to DNA replication and repair (dnaA, dnaN, gyrB, uvrA, polC, uvrB, uvrC,
parC, dnaE), show remarkably strong evidence for positive selection. These genes were unevenly distributed across HUB-1, the MC lineage and the common ancestor of clade III. Notably, both the dnaAand dnaN genes, which compose the oriC region, were identified to be under positive selection in the HUB-1 lineage. Previous studies have already demonstrated that replica-tion may contribute to proliferareplica-tion and efficiency of the colonization of hostile environments [25]. Therefore, we suspected that selection pressure onoriCmay be one of the reasons whyM. hyorhiniscan thrive among different species of cell lines.
This research provides a better insight into, and understanding of, persistent nonessential genes, and encourages exploration of essential genes by combining both the experimental approaches and comparative genomics analysis. This study also provides a comparative genomics method for addressing questions of essentiality. With the increasing number of genome sequences available for the same species in the future, this method will be useful for exploring species-specific essential genes.
Materials and Methods
Bacterial Strains and Genome Sequences
M. hyorhinisstrain HUB-1 was isolated from the respiratory tract of swine in China and confirmed to be an M. hyorhinisstrain by verifying the 16S rRNA region. The main characteristics of 20
Mycoplasmasstrains with freely available genomes at the time of the study are presented in Table 1. These genomes were used for comparative analysis.
Assignment of Orthologs and Phylogenetic Analysis
We analyzedM. hyorhinisHUB-1 and 19 otherMycoplasmataceae
genomes from the NCBI databases. To ensure consistency, the annotations of all genomes were verified based on the similarity withM. hyorhinisHUB-1, using the tBLASTn algorithm [36]. The sets of orthologous protein-coding genes were defined as mutual fully transitive reciprocal BLASTP [37] hits (with E-value,1024
) [38]. Co-ortholog groups were identified by the method similar to Inparanoid [39] and ortholog gene clusters were obtained using the tribeMCL program [40]. The nucleic acid sequence of each ortholog group was aligned using the CLUSTALW program version 1.83 [41]. For each data set, the phylogenetic relationship was estimated and tested in one thousand bootstrap samples using TREE-PUZZLE version 5.2 (general time reversible (GTR) +C4+I model of evolution with a BIONJ starting tree) [42]. The bi-partitions with at least 70% support from the bootstrap test in each data set were recorded as ‘‘0/1’’ status and used to reconstruct the consensus sequence. The phylogenetic relationship of the consensus sequence was built using the SplitsTREE 4 with the BioNJ model.
Positive selection analysis
We employed the branch-site test of Yang and Nielsen [20], implemented in the program HY-PHY, to assess positive selection at particular sites and lineages. Briefly, the likelihood of a model that does not allow positive selection is compared to one allowing positive selection on some specified lineages. The model allowing positive selection is tested using a likelihood ratio test (LRT) [43] that is compared to ax2 statistic with two degrees of freedom. Likelihoods were estimated on the genes or species trees. For the
Mycoplasma data set, both swine-infecting and human-infecting lineages were tested (Figure 4). To avoid the interference of recombination, only genes that support all four lineages in their gene trees (with.70% bootstrap support) were used. In total, 661 genes were tested. Finally, p values were corrected for multiple hypotheses testing using the Bonferroni method [44].
Supporting Information
Figure S1 Comparison of COG Distribution in the Core Genome and inM. hyorhinisHUB-1.
(TIF)
Table S1 Gene Content Table: Composition of Each Gene Cluster per Genome.
(XLS)
Table S2 Characteristics of the Core Genome Identified in the FamilyMycoplasmataceae.
(XLS)
Table S3 Genes under Positive Selection in the Human-infecting Lineage.
(XLS)
Acknowledgments
We thank Dr. Maojun Liu (Jiangsu Academy of Agricultural Sciences, Nanjing, China), Dr. Lei Wang (Nankai University, Tianjin, China), Mr. Feng Li (Huazhong agricultural university, Wuhan, China) assistance with sequencing and analysis.
Figure 6. Similarity relationship between core and essential genes.Genes on x-axis represent the essential genes documented in
Author Contributions
Conceived and designed the experiments: WL SX LF HC. Performed the experiments: WL ML SL SG ZF. Analyzed the data: WL ZZ GS RL BL.
Contributed reagents/materials/analysis tools: WL GS RL BL. Wrote the paper: WL LF SX.
References
1. Razin S, Yogev D, Naot Y (1998) Molecular biology and pathogenicity of mycoplasmas. Microbiol Mol Biol Rev 62: 1094–1156.
2. Waites KB, Katz B, Schelonka RL (2005) Mycoplasmas and ureaplasmas as neonatal pathogens. Clin Microbiol Rev 18: 757–89.
3. Morowitz HJ, Tourtellotte ME (1962) The smallest living cells. Sci Am 206: 117–126.
4. Gil R, Silva FJ, Pereto J, Moya A (2004) Determination of the core of a minimal bacterial gene set. Microbiol Mol Biol Rev 68: 518–537.
5. Glass JI, Assad-Garcia N, Alperovich N, Yooseph S, Lewis MR, et al. (2006) Essential genes of a minimal bacterium. Proc Natl Acad Sci U S A 103: 425–430.
6. Parkhill J, Sebaihia M, Preston A, Murphy LD, Thomson N, et al. (2003) Comparative analysis of the genome sequences ofBordetella pertussis,Bordetella parapertussisandBordetella bronchiseptica. Nat Genet 35: 32–40.
7. Jin Q, Yuan ZH, Xu JG, Wang Y, Shen Y, et al. (2002) Genome sequence of Shigella flexneri2a: insights into pathogenicity through comparison with genomes ofEscherichia coliK12 and O157. Nucleic Acids Res 30: 4432–4441. 8. Wolf M, Muller T, Dandekar T, Pollack JD (2004) Phylogeny of Firmicutes with
special reference to Mycoplasma (Mollicutes) as inferred from phosphoglycerate kinase amino acid sequence data. Int J Syst Evol Micr 54: 871–875. 9. Fraser CM, Gocayne JD, White O, Adams MD, Clayton RA, et al. (1995) The
minimal gene complement ofMycoplasma genitalium. Science 270: 397–403. 10. DeBey MC, Ross RF (1994) Ciliostasis and loss of cilia induced byMycoplasma
hyopneumoniaein porcine tracheal organ cultures. Infect Immun 62: 5312–5318. 11. Kotani H, Butler GH, Tallarida D, Cody C, McGarrity GJ (1990) Microbiological cultivation ofMycoplasma hyorhinisfrom cell cultures. In Vitro Cell Dev Biol 26: 91–96.
12. Huang S, Li JY, Wu J, Meng L, Shou CC (2001) Mycoplasma infections and different human carcinomas. World J Gastroenterol 7: 266–269.
13. Lefebure T, Stanhope MJ (2007) Evolution of the core and pan-genome of Streptococcus: positive selection, recombination, and genome composition. Genome Biol 8: R71.
14. Ouzounis C, Kyrpides N (1996) The emergence of major cellular processes in evolution. FEBS Lett 390: 119–123.
15. Himmelreich R, Hilbert H, Plagens H, Pirkl E, Li BC, et al. (1996) Complete sequence analysis of the genome of the bacteriumMycoplasma pneumoniae. Nucleic Acids Res 24: 4420–4449.
16. Fang G, Rocha E, Danchin A (2005) How essential are nonessential genes? Mol Biol Evol 22: 2147–2156.
17. Bapteste E, Boucher Y, Leigh J, Doolittle WF (2004) Phylogenetic reconstruction and lateral gene transfer. Trends Microbiol 12: 406–411.
18. Ciccarelli FD, Doerks T, von Mering C, Creevey CJ, Snel B, et al. (2006) Toward automatic reconstruction of a highly resolved tree of life. Science 311: 1283–1287.
19. Sirand-Pugnet P, Citti C, Barre A, Blanchard A (2007) Evolution of mollicutes: down a bumpy road with twists and turns. Res Microbiol 158: 754–766. 20. Zhang J, Nielsen R, Yang Z (2005) Evaluation of an improved branch-site
likelihood method for detecting positive selection at the molecular level. Mol Biol Evol 22: 2472–2479.
21. Yang Z, Nielsen R (2002) Codon-substitution models for detecting molecular adaptation at individual sites along specific lineages. Mol Biol Evol 19: 908–917. 22. Kosiol C, Vinar T, da Fonseca RR, Hubisz MJ, Bustamante CD, et al. (2008) Patterns of positive selection in six Mammalian genomes. PLoS Genet 4: e1000144.
23. Shapiro BJ, Alm EJ (2008) Comparing patterns of natural selection across species using selective signatures. PLoS Genet 4: e23.
24. McGlynn P, Lloyd RG (2001) Rescue of stalled replication forks by RecG: simultaneous translocation on the leading and lagging strand templates supports an active DNA unwinding model of fork reversal and Holliday junction formation. Proc Natl Acad Sci U S A 98: 8227–8234.
25. Anisimova M, Bielawski J, Dunn K, Yang Z (2007) Phylogenomic analysis of natural selection pressure inStreptococcusgenomes. BMC Evol Biol 7: 154. 26. Szczepanek SM, Tulman ER, Gorton TS, Liao X, Lu Z, et al. (2010)
Comparative genomic analyses of attenuated strains ofMycoplasma gallisepticum. Infect Immun 78: 1760–1771.
27. Hutchison CA, Peterson SN, Gill SR, Cline RT, White O, et al. (1999) Global transposon mutagenesis and a minimal Mycoplasma genome. Science 286: 2165–2169.
28. Papp B, Pal C, Hurst LD (2004) Metabolic network analysis of the causes and evolution of enzyme dispensability in yeast. Nature 429: 661–664.
29. Snel B, Bork P, Huynen MA (1999) Genome phylogeny based on gene content. Nat Genet 21: 108–110.
30. Kunin V, Ahren D, Goldovsky L, Janssen P, Ouzounis CA (2005) Measuring genome conservation across taxa: divided strains and united kingdoms. Nucleic Acids Res 33: 616–621.
31. Daubin V, Gouy M, Perriere G (2002) A phylogenomic approach to bacterial phylogeny: evidence of a core of genes sharing a common history. Genome Res 12: 1080–1090.
32. Rokas A, Williams BL, King N, Carroll SB (2003) Genome-scale approaches to resolving incongruence in molecular phylogenies. Nature 425: 798–804. 33. Fitzpatrick DA, Logue ME, Stajich JE, Butler G (2006) A fungal phylogeny
based on 42 complete genomes derived from supertree and combined gene analysis. BMC Evol Biol 6: 99.
34. Gadagkar SR, Rosenberg MS, Kumar S (2005) Inferring species phylogenies from multiple genes: concatenated sequence tree versus consensus gene tree. J Exp Zool B Mol Dev Evol 304: 64–74.
35. Petersen L, Bollback JP, Dimmic M, Hubisz M, Nielsen R (2007) Genes under positive selection inEscherichia coli. Genome Res 17: 1336–1343.
36. Iguchi A, Thomson NR, Ogura Y, Saunders D, Ooka T, et al. (2009) Complete genome sequence and comparative genome analysis of enteropathogenic Escherichia coliO127:H6 strain E2348/69. J Bacteriol 191: 347–354. 37. Altschul SF, Madden TL, Schaffer AA, Zhang J, Zhang Z, et al. (1997) Gapped
BLAST and PSI-BLAST: a new generation of protein database search programs. Nucleic Acids Res 25: 3389–3402.
38. Zhaxybayeva O, Gogarten JP (2002) Bootstrap, Bayesian probability and maximum likelihood mapping: exploring new tools for comparative genome analyses. BMC Genomics 3: 4.
39. O’Brien KP, Remm M, Sonnhammer EL (2005) Inparanoid: a comprehensive database of eukaryotic orthologs. Nucleic Acids Res 33: D476–480. 40. Enright AJ, Van Dongen S, Ouzounis CA (2002) An efficient algorithm for
large-scale detection of protein families. Nucleic Acids Res 30: 1575–1584. 41. Thompson JD, Higgins DG, Gibson TJ (1994) CLUSTAL W: improving the
sensitivity of progressive multiple sequence alignment through sequence weighting, position-specific gap penalties and weight matrix choice. Nucleic Acids Res 22: 4673–4680.
42. Schmidt HA, Strimmer K, Vingron M, von Haeseler A (2002) TREE-PUZZLE: maximum likelihood phylogenetic analysis using quartets and parallel comput-ing. Bioinformatics 18: 502–504.
43. Yang Z (1998) Likelihood ratio tests for detecting positive selection and application to primate lysozyme evolution. Mol Biol Evol 15: 568–573. 44. Guilbaud O (2007) Bonferroni parallel Gatekeeping - Transparent
generaliza-tions, adjusted P-values, and short direct proofs. Biometrical J 49: 917–927. 45. Glass JI, Lefkowitz EJ, Glass JS, Heiner CR, Chen EY, et al. (2000) The
complete sequence of the mucosal pathogenUreaplasma urealyticum. Nature 407: 757–762.
46. Vasconcelos ATR (2005) Swine and poultry pathogens: the complete genome sequences of two strains ofMycoplasma hyopneumoniaeand a strain ofMycoplasma synoviae(vol 187, pg 5568, 2005). J Bacteriol 187: 7548–7548.
47. Chambaud I, Heilig R, Ferris S, Barbe V, Samson D, et al. (2001) The complete genome sequence of the murine respiratory pathogen Mycoplasma pulmonis. Nucleic Acids Res 29: 2145–2153.
48. Dandekar T, Huynen M, Regula JT, Ueberle B, Zimmermann CU, et al. (2000) Re-annotating the Mycoplasma pneumoniae genome sequence: adding value, function and reading frames. Nucleic Acids Res 28: 3278–3288.
49. Sasaki Y, Ishikawa J, Yamashita A, Oshima K, Kenri T, et al. (2002) The complete genomic sequence ofMycoplasma penetrans, an intracellular bacterial pathogen in humans. Nucleic Acids Res 30: 5293–5300.
50. Westberg J, Persson A, Holmberg A, Goesmann A, Lundeberg J, et al. (2004) The genome sequence ofMycoplasma mycoidessubsp. mycoides SC type strain PG1T, the causative agent of contagious bovine pleuropneumonia (CBPP). Genome Res 14: 221–227.
51. Jaffe JD, Stange-Thomann N, Smith C, DeCaprio D, Fisher S, et al. (2004) The complete genome and proteome of Mycoplasma mobile. Genome Res 14: 1447–1461.
52. Liu W, Fang L, Li S, Li Q, Zhou Z, et al. (2010) Complete genome sequence of Mycoplasma hyorhinisstrain HUB-1. J Bacteriol 192: 5844–5845.
53. Minion FC, Lefkowitz EJ, Madsen ML, Cleary BJ, Swartzell SM, et al. (2004) The genome sequence ofMycoplasma hyopneumoniaestrain 232, the agent of swine mycoplasmosis. J Bacteriol 186: 7123–7133.
54. Papazisi L, Gorton TS, Kutish G, Markham PF, Browning GF, et al. (2003) The complete genome sequence of the avian pathogenMycoplasma gallisepticumstrain R(low). Microbiology 149: 2307–2316.
55. Calderon-Copete SP, Wigger G, Wunderlin C, Schmidheini T, Frey J, et al. (2009) TheMycoplasma conjunctivaegenome sequencing, annotation and analysis. BMC Bioinformatics 10 Suppl 6: S7.