JSCS–4776 Original scientific paper
Multicenter Wiener indices and their applications
IVAN GUTMAN1,2*#, BORIS FURTULA1# and XUELIANG LI31Faculty of Science, University of Kragujevac, P. O. Box 60, 34000 Kragujevac, Serbia, 2State University of Novi Pazar, Novi Pazar, Serbia and 3Center for Combinatorics,
Nankai University, Tianjin, 300071, China
(Received 26 January, revised 12 February, accepted 13 February 2015)
Abstract: The Wiener index W could be viewed as a molecular structure des-criptor composed of increments representing interactions between pairs of atoms. A generalization of the W are the Steiner–Wiener indices Wk, k = 3, 4,… In the quantity Wk, interactions between k-tuples of atoms play a role, based on the concept of the Steiner distance. It is shown that the term W+λWk provides an approximation for the boiling points of alkanes better than W itself. The best such approximation is obtained for k=7.
Keywords: Wiener index; multicenter Wiener index; Steiner distance; Steiner– –Wiener index; molecular graph.
INTRODUCTION
The Wiener index (
W
) is one of the oldest and most examined graph-based
molecular structure descriptors. Details on its mathematical properties and
che-mical applications are given in reviews,
1–5recent research papers,
6–9and the
references cited therein. On the occasion of the fiftieth anniversary of the Wiener
index, three special journal issues were published.
10–12Additional historical data
on
W
can be found in a survey.
13The Wiener index is defined in the following manner. Let
G
be a molecular
graph and
v v
1 2, , ,
v
nbe its vertices. The distance between the vertices
v
iand
jv
, denoted by
d v v
( , )
i j, is the number of edges in (= the length of) the shortest
path that connects
v
iand
v
j. Then:
( )
( , )
i j i jW
W G
d v v
<
=
=
(1)
with the summation embracing all pairs of vertices (
v
i,
v
j) of the molecular graph
G.
* Corresponding author. E-mail: [email protected] # Serbian Chemical Society member.
Bearing in mind that each vertex of the molecular graph represents an atom
of the underlying molecule,
14the quantity
W
, defined by means of Eq. (1), may
be viewed as a sum of structural increments representing pairs
of atoms,
i.e
., two-
-center interatomic interactions.
From this point of view, one could think of three-center, four-center,
etc
.
interactions that would lead to the following evident multicenter extension of the
Wiener-index concept:
3 3
( )
( , , )
i j k i j kW
W G
d v v v
< <
=
=
(2)
4 4
( )
( , , , )
i j k l i j k lW
W G
d v v v v
< < <
=
=
(3)
5 5
( )
( , , , ,
i j k l m)
i j k l mW
W G
d v v v v v
< < < <
=
=
(4)
etc
. In formulas (2)–(4), the meaning of the three-, four-, five-vertex distances
requires clarification. In fact, a long time ago, Chartrand
et al
. introduced such a
multi-vertex distance into graph theory,
15which was eventually much studied
under the name “Steiner distance”.
16Its definition is given in the subsequent
section.
The multicenter Wiener-type indices based on the Steiner distance will be
referred to as “Steiner–Wiener indices” and are defined in the subsequent section.
The present work is aimed at establishing their chemical applicability.
STEINER DISTANCE AND STEINER–WIENER INDEX
Let G be a connected graph with n vertices. Let S={ , , , }v vi1 i2 vik be a set of k distinct vertices of G. Then the Steiner tree, T S( ), is a tree (= connected acyclic graph) that is a subgraph of G, containing all vertices of S, and possessing a minimal number of edges. The number of edges of ( )T S is the Steiner distance of the vertices v vi1, , ,i2vik . For details on the Steiner-distance concept, see elsewhere.17,18
For k=2,3, ,n, the k-th Steiner–Wiener index of the (molecular) graph G is defined as:
1 2
( ) ( , , , k)
k k i i i
S
W =W G =
d v v v (5)where the summation goes over all k-element subsets S={ , , , }v vi1 i2vik of the vertex set of G. Steiner–Wiener indices, Wk, were recently considered,19 and their basic mathematical properties determined. Some of these are the following:
1. W G2( ) coincides with the ordinary Wiener index ( )W G , Eq. (1).
2. Eqs. (2), (3), and (4) are special cases of Eq. (5), for k=3,k=4 and k=5,
res-pectively.
3. For a graph G with n vertices, if k=n, then W Gk( )=n−1.
4. For a graph G with n vertices, if k>n, then W Gk( ) 0= .
1
1 2
1
( ) ( ) ( )
k
k
e i
n e n e W T
i k i
−
=
= −
(6)where n e1( ) and n e2( ) are the number of vertices lying on the two sides of the edge e, and where the first summation goes over all edges of T. For all edges e of the tree T,
1( ) 2( ) n e +n e =n.
Note that for k=2, formula (6) reduces to the expression (7), discovered by Wiener himself as early as in 1947:7,14,20
1 2
( ) ( ) ( ) e
W T =
n e n e (7)STEINER–WIENER INDICES AND BOILING POINTS OF ALKANES
The first chemical application of the Wiener index was its usage for the
prediction of the normal boiling points of alkanes.
20Eventually, correlations with
boiling points became a standard test for the quality of topological indices.
21–24In view of this, this physico-chemical parameter is also used in these studies of
the Steiner–Wiener indices.
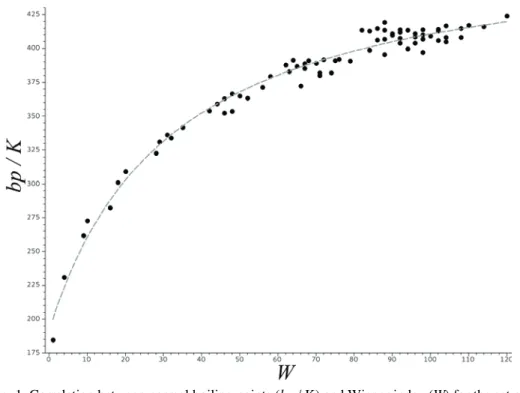
The well known
23plot of the normal boiling points
vs
. the Wiener index is
reproduced in Fig. 1. The curve passing through the data-points is of the form:
Fig. 1. Correlation between normal boiling points (bp / K) and Wiener index (W) for the set of all isomeric alkanes with 2 to 9 carbon atoms (74 compounds).25 The curve passing through the data-points is specified by Eq. (8). Statistical data pertaining to this correlation are found
* *
calc
(
)
*1
a
bW
bp
bp
W
cW
+
≈
=
+
(8)
where
W
*=
W
and where , and
a b
c
are fitting parameters. The correlation
between the experimental and calculated boiling points (
i.e
., between
bp
and
calc
bp
,
cf
. Eq. (8)), is shown in Fig. 2.
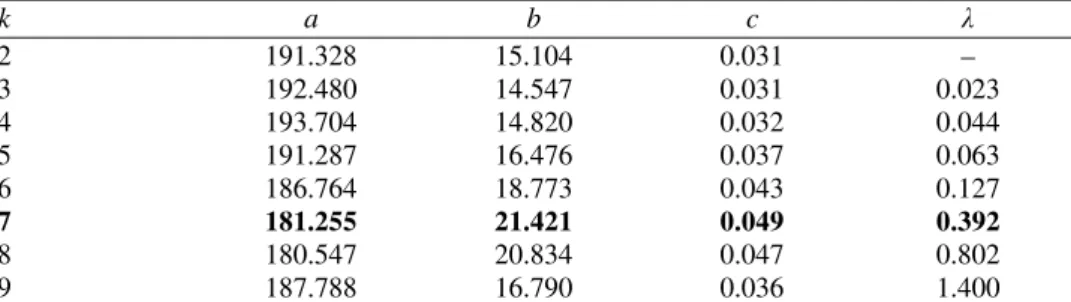
TABLE I. Fitting parameters in formulas (8) and (9), for k = 2,3,..., 9. The (a,b,c)-values were obtained by means of the scaled Levenberg–Marquardt algorithm.26 The λ-values are those for which the respective correlation coefficients are maximal, cf. Fig. 3. The parameters for the best approximation are indicated by boldface
k a b c λ
2 191.328 15.104 0.031 –
3 192.480 14.547 0.031 0.023
4 193.704 14.820 0.032 0.044
5 191.287 16.476 0.037 0.063
6 186.764 18.773 0.043 0.127
7 181.255 21.421 0.049 0.392
8 180.547 20.834 0.047 0.802
9 187.788 16.790 0.036 1.400
TABLE II. Statistical data for the correlations between boiling points and the topological indices W*=W+λWk, k =2,3,..., 9; R = correlation coefficient, ARE = average relative error (in %), MRE = maximal observed relative error (in %). The data for the best approximation are indicated by boldface. For details, see Eqs. (8) and (9) and the text
k R ARE MRE
2 0.98954 1.45 8.42
3 0.98957 1.45 8.83
4 0.99018 1.41 9.46
5 0.99135 1.33 8.58
6 0.99256 1.23 6.80
7 0.99323 1.18 4.63
8 0.99273 1.23 4.19
9 0.99149 1.33 6.98
The most obvious idea for testing the Steiner–Wiener indices would be to set
*k
W
=
W
into Eq. (8). This, however, did not yield any improvement, and thus
had to be abandoned. A better option was to modify the Wiener index as:
*k
W
=
W
+
λ
W
(9)
and use the variable
W
*in combination with Eq. (8) . For each fixed choice of
k
,
k
= 3,4,...8, the parameter
λ
was varied, and its value determined to maximize the
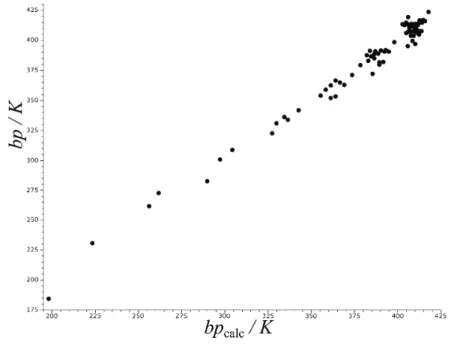
Fig. 2. Correlation between the calculated boiling points (bpcalc, according to Eq. (8), *=
W W) and the experimental boiling points (bp) for the same compounds as in Fig. 1. Statistical data pertaining to this correlation are found in Tables I and II, for k = 2.
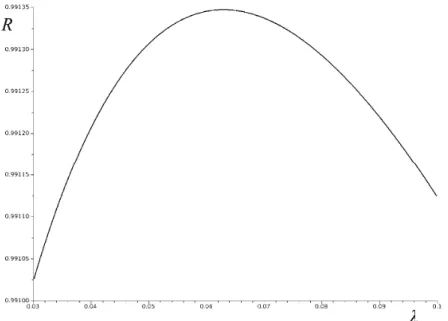
Fig. 3. The λ-dependence of the correlation coefficient R for the correlation between bp and calc
bp for the case k=5. The maximum is attained at λ=0.063, cf. Table I.
Fig. 4. Normal boiling points (bp / K) vs. W+λW7 for the same alkanes as in Fig. 1. As the data in Tables I and II show, the choice k=7 provides the best agreement between bp and
bpcalc, cf. Eqs. (8) and (9).
DISCUSSION AND CONCLUDING REMARKS
Viewing at the Wiener index as a structure descriptor based on two-center
interatomic interactions, it could be expected that the next-important structural
feature would be three-center interactions. In the case of Steiner–Wiener index
applied to alkanes, this certainly cannot be the case, since for trees the following
identity holds:
3
( )
2
( )
2
n
W T
=
−
W T
(10)
Therefore,
W
3contains the exactly same structural information as the
ordi-nary Wiener index,
W
.
Relation (10) is deduced from Eq. (6) as follows. For
k
=
3
, Eq. (6) has the
form:
1 2 1 2
3
( )
( )
( )
( )
( )
1
2
2
1
e
n e
n e
n e
n e
W T
=
+
which, bearing in mind that
n e
1( )
+
n e
2( )
=
n
, is transformed into:
2 2 1 1
3 1 2
1 2
1 2 1 2
( )[ ( ) 1]
( )[ ( ) 1]
( )
( )
( )
2
2
( )
( ) 2
2
( )
( )
( )
( )
2
2
e
e e
n e n e
n e n e
W T
n e
n e
n e
n e
n
n e n e
n e n e
−
−
=
+
+
−
−
=
=
Formula (10) is now obtained from Eq. (7).
The calculations fully agree with the above argument: The accuracies of the
models for
k
=
2
and
k
=
3
were the same, see Table I.
If
k
>
3
, because of the very large number of
k
-tuples of vertices, the
calculation of the Steiner–Wiener index
W
kbased on its definition (5) becomes
extremely cumbersome. In the case of acyclic systems (such as the molecular
graphs of alkanes), instead of Eq. (5), the calculations could be realized using Eq.
(6), which is significantly easier. In fact, by means of Eq. (6) any Steiner–Wiener
index
W
kcould be calculated just as easily as the ordinary Wiener index
W
.
The fact that the accuracy of the approximations based on the indices
*k
W
=
W
+
λ
W
increases with
k
, and reaches its maximum at
k
=
7
, is
some-what unexpected. It may be that this is a statistics-based artifact of the considered
models. Nevertheless, this phenomenon deserves further examination.
model (based on
W
+
λ
W
7) are, respectively, by 20 and 50 % smaller than those
of the starting model (based solely on
W
). In view of this, it may be concluded
that by adding multicenter distance-contributions to the Wiener index, its
appli-cability to model physicochemical properties of alkanes is improved, but only to
a limited extent.
И З В О Д
ВИШЕЦЕНТРИЧНИВИНЕРОВИИНДЕКСИИЊИХОВЕПРИМЕНЕ
ИВАНГУТМАН1,2, БОРИСФУРТУЛА1и XUELIANG LI3
1Природно–математичкифакултетУниверзитетауКрагујевцу, 2ДржавниуниверзитетуНовом Пазаруи3Center for Combinatorics, Nankai University, Tianjin, China
Винеровиндекс W семожепосматратикаомолекулскиструктурнидескрипторсас
-тављенодсабиракакојирепрезентујуинтеракцијеизмеђупароваатома. Једнагенерали
-зацијаВинеровогиндексасуШтајнер–ВинеровииндексиWk, k = 3,4,... УиндексуWkсе води рачуна о интеракцијама k атома, заснованих на појму Штајнеровог растојања.
Показано је да формулаW+λW
k омогућава апроксимативно израчунавање тачке кљу
-чањаалканабољенегосамВинеровиндекс. Најбољатакваапроксимацијејезаk = 7.
(Примљено 26. јануара, ревидирано 12. фебруара, прихваћено 13. фебруара 2015)
REFERENCES
1. I. Gutman, Y. N. Yeh, S. L. Lee, Y. L. Luo, Indian J. Chem.,A32 (1993) 651
2. S. Nikolić, N. Trinajstić, Z. Mihalić, Croat. Chim. Acta68 (1995) 105
3. D. H. Rouvray, in Topology in Chemistry – Discrete Mathematics of Molecules, D. H. Rouvray, R. B. King, Eds., Horwood, Chichester, 2002, p. 16
4. K. Xu, M. Liu, K. C. Das, I. Gutman, B. Furtula, MATCH Commun. Math. Comput. Chem.71 (2014) 461
5. M. Liu, B. Liu, MATCH Commun. Math. Comput. Chem. 69 (2013) 491
6. A. Hamzeh, S. Hossein-Zadeh, A. R. Ashrafi, MATCH Commun. Math. Comput. Chem.
69 (2013) 47
7. R. Škrekovski, I. Gutman, MATCH Commun. Math. Comput. Chem.72 (2014) 295
8. H. Lin, MATCH Commun. Math. Comput. Chem.72 (2014) 783
9. K. Hrinakova, M. Knor, R. Škrekovski, A. Tepeh, MATCH Commun. Math. Comput. Chem. 72 (2014) 791
10. 50th Anniversary of the Wiener Index, I. Gutman, S. Klavžar, B. Mohar, Eds., Discr. Appl.
Math.80 (1997), pp. 1–113
11. Fifty Years of the Wiener Index, I. Gutman, S. Klavžar, B. Mohar, Eds., MATCH Commun. Math. Comput. Chem. 35 (1997), pp. 1–259
12. Fifty Years of the Wiener Index, I. Gutman, Ed., J. Serb. Chem. Soc.62 (1997), pp. 185–
–294
13. D. H. Rouvray, in Topology in Chemistry – Discrete Mathematics of Molecules, D. H. Rouvray, R. B. King, Eds., Horwood, Chichester, 2002, p. 1
14. I. Gutman, O. E. Polansky, Mathematical Concepts in Organic Chemistry, Springer, Berlin, Germany, 1986
15. G. Chartrand, O. R. Oellermann, S. Tian, H. B. Zou, Časopis Pest. Mat.114 (1989) 399
17. F. K. Hwang, D. S. Richards, P. Winter, The Steiner Tree Problem, North-Holland, Amsterdam, 1992
18. W. Goddard, O. R. Oellermann, in: Structural Analysis of Complex Networks, M. Dehmer, Ed., Birkhäuser, Dordrecht, 2011, pp. 49–72
19. X. Li, Y. Mao, I. Gutman, Discuss. Math. Graph Theory, in press 20. H. Wiener, J. Am. Chem. Soc. 69 (1947) 17
21. D. H. Rouvray, J. Comput. Chem. 8 (1987) 470
22. P. G. Seybold, M. May, U. A. Bagal, J. Chem. Educ.64 (1987) 575
23. Z. Mihalić, N. Trinajstić, J. Chem. Educ. 69 (1992) 701
24. G. Rücker, C. Rücker, J. Chem. Inf. Comput. Sci.39 (1999) 788
25. R. L. Brown, S. E. Stein, in: NIST Standard Reference Database No. 69, P. J. Linstrom, W. G. Mallard, Eds., Gaithersburg, MD, 2014, http://webbook.nist.gov