Service Quality of Delivered Care from the Perception of Women
with Caesarean Section and Normal Delivery
* Jafar S. Tabrizi 1, Samira Askari 2, Zahra Fardiazar 3, Hossein Koshavar 4,Kamal Gholipour 2
1Health Services Management Research Centre, Tabriz Medical Sciences University, Tabriz Iran 2Department of Health Services Management, Tabriz Medical Sciences University, Tabriz Iran
3Department of Gynecology, Tabriz Medical Sciences University, Tabriz Iran 4Department of Statistics and Epidemiology, Tabriz Medical Sciences University, Tabriz Iran
ARTICLE INFO ABSTRACT
Article type:
Original Article Background: Our aim was to determine the service quality of delivered care for people with Caesarean Section and Normal Delivery.
Methods: A cross-sectional study was conducted among 200 people who had caesarean section and normal delivery in Al-Zahra Teaching Hospital in Tabriz, north western Iran. Service quality was calculated using: Service Quality = 10 – (Importance × Performance) based on importance and performance of service qual-ity aspects from the postpartum women‟s perspective.A hierarchical regression analysis was applied in two steps using the enter method to examine the associ-ations between demographics and SQ scores. Data were analysed using the SPSS-17 software.
Results: “Confidentiality”, “autonomy”, “choice of care provider” and “com -munication” achieved scores at the highest level of quality; and “support group”, “prompt attention”, “prevention and early detection”, “continuity of care”, “dignity”, “safety”, “accessibility and “basic amenities” got service quality score less than eight. Statistically significant relationship was found between service quality score and continuity of care (P=0.008).
Conclusion: A notable gap between the participants‟ expectations and what they have actually received in most aspects of provided care. So, there is an op-portunityto improve the quality of delivered care.
Article history:
Received: May 15 2014 Accepted: Aug 24 2014 e-published: Dec 30 2014
Keywords:
Service quality,
Patients’ perspective,
Caesarean section, Normal delivery
*Corresponding Author:
Jafar S. Tabrizi
Tel: +98 41 33340634; e-mail:[email protected]
Introduction
The majority of women have at least one experience of delivery through a Normal Delivery (ND) or Caesarean Section (CS) in their whole life. This process has important direct impact on the health of both mother and neonate, and the essential obstetric care should be considered through before, dur-ing, and after delivery.1 High quality of a
basic and comprehensive non-health and clinical care should be guaranteed by the health system to ensure customers.2
Preg-nant women increasingly expect higher qual-ity in their childbirth process reflecting changing socio economic status, trends in disease patterns and advances in medical and health procedures.3 Consequently, pregnant
women‟s needs and expectations should be measured as part of measuring the quality and responsiveness of health care systems. Or-ganizational and physical structures and care processes should be designed to respond
cus-tomer‟s needs by service providers.
Citation: Tabrizi JS, Askari S, Fardiazar Z, Koshavar H, Gholipour K. Service Quality of Delivered Carefrom the
Perception of Women with Caesarean Section and Normal Delivery. Health Promot Perspect 2014; 4(2): 137-143
Quality of care can be seen as having three principal components, including ser-vice, technical and customer quality.4
Tech-nical Quality is what the customers receive
relative to what is known to be effective and largely reflects issues related to the health care providers knowledge and experiences.5
Customer Quality refers to the characteristics
that customers need for effective involve-ment in health care processes, decision mak-ing and action to improve the quality of care delivered and received.6
Service Quality (SQ) refers to the non-health
aspects of care and reflects the experience of the health care customers with the health sys-tem, including relationships between cus-tomers and care providers, facility standards and support services and the environment in which service is delivered.7 SQ has a direct
influence on overall quality of care experi-enced by service users
Perceptions of what is quality of care are linked to expectations and are likely to differ from system to system, region to region and even person to person. In addition,
percep-tions of SQ reflect individual‟s values and
personal experiences of care services.8 In
assessing the quality of care provided by a health system for a specific health issue, it is important to consider both the technical and
SQ of care. Additionally patients‟ views on
quality of care are a valuable tool for quality improvement and also for making health
care more responsive to patients‟ needs.9 On
the other hand, considering critical and im-portant role of postpartum and childbirth period in health of mother and neonate im-proving quality of care in this setting relate to health education, safety and prevention can be used as an effective intervention to reduce risks and complications.
In this regard, the present study aimed to assess the SQ of delivered care from the perspective of women with ND and CS in Tabriz, Iran.
Materials and Methods
Participants & Procedures
A cross-sectional study was conducted in
study participants were 200 postpartum womenwith ND and CS in Al-Zahra Teach-ing Hospital. Participants were interviewed at least 2 hours after ND or 6 hours after CS. Women who filled and signed informed consent to participation in the study were eligible to take part. Participants who were not interest to have an interview or who did not continue the interview were excluded from the study. Participants were selected using convenient sampling within 2 months.
Sample size of study was determined based on primary information on service quality variable obtained from a group of 20 women. Considering 95% confidence level, 80% power by considering standard error was equal to 1.8 and Cohen's d estimated as 0.37, finally by utilizing sample size formula for analytical studies at least 175 women to be recruited in to the study.
Measures
A structured questionnaire was used to assess the importance and performance score for 12 aspects of SQ, demographic information, pregnancy history and tobacco smoking. The questions to assess SQ were adapted from a validated CQMH_SQ (Comprehensive Quality Measurement in Health_ Services Quality) questionnaire de-veloped by Tabrizi et al.10 Researchers modi-fied some questions based on the local con-ditions and did not exclude any question.
For each aspect of SQ, respondents were asked to evaluate the Importance of that as-pect and their perception of the quality of care they had received in relation to that as-pect (Performance). Importance of SQ was scored on a four point Likert scale ranging
from “0 = Not Important”, “3 = May be Important”, “6 = Important” and “10 = Very Important”. Perceived performance of care received was scored on a four point
scale ranged from “never, sometimes, usu
-ally and always” or “poor, fair, good and ex
-cellent”. For analysis this scale was dichoto
-mized as: “0 = Usually/Always or Good/E
-xcellent” and “1 = Never/Some-times or
Poor/Fair”. An overall measure of SQ, was
the importance and performance scores using the Netherlands Institute for Health Services Research methodology.11 SQ of care for
each quality aspect was calculated as:
Service Quality = 10 – (Importance × Performance).
The SQ score then ranged from 0 = the worse/lowest quality to 10 = the best/highest quality. In most surveys, re-gardless of methodology, around 10% of the population reported inadequate quality of the care10,11 and a similar percentage report
being dissatisfied with care in hospitals.12 So,
according to this fact in this study SQ score less than 9 indicates weakness and a signifi-cant opportunity for improvement.10
Ethical Consideration
The ethics of this study were reviewed and approved by review board of Tabriz Univer-sity of medical sciences.
Statistical Analysis
Independent Samples t test and ANOVA were conducted to compare SQ score be-tween categorical variables.
A hierarchical linear regression analysis was applied in two steps using the enter method. Variables found to be associated with SQ in the univariate analysis were in-cluded in multivariate regression model. The P-values for entry and removal variables in the stepwise regression model were 0.05 and 0.15, respectively. Data were analyzed using the SPSS-17 statistical package (SPSS, Chi-cago, IL, USA). P values <0.05 were consid-ered as statistically significant.
Results
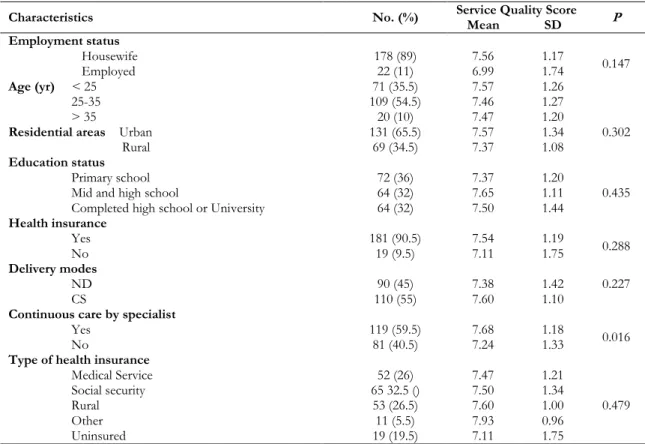
The majority of participants were house-wife (89%), lived in urban area (65.5%) and more likely to be over 25 years old.Study finding indicates more than one third of par-ticipants completed primary school (36%) and nearly one third completed high school or university levels. In this study nobody had a history of smoking (Table 1).
Table 1: Characteristics of study participants and Service Quality score
Characteristics No. (%) Service Quality Score P
Mean SD
Employment status
Housewife 178 (89) 7.56 1.17 0.147
Employed 22 (11) 6.99 1.74
Age (yr) < 25 71 (35.5) 7.57 1.26
25-35 109 (54.5) 7.46 1.27
> 35 20 (10) 7.47 1.20
Residential areas Urban 131 (65.5) 7.57 1.34 0.302
Rural 69 (34.5) 7.37 1.08
Education status
Primary school 72 (36) 7.37 1.20
0.435
Mid and high school 64 (32) 7.65 1.11
Completed high school or University 64 (32) 7.50 1.44
Health insurance
Yes 181 (90.5) 7.54 1.19
0.288
No 19 (9.5) 7.11 1.75
Delivery modes
ND 90 (45) 7.38 1.42 0.227
CS 110 (55) 7.60 1.10
Continuous care by specialist
Yes 119 (59.5) 7.68 1.18
0.016
No 81 (40.5) 7.24 1.33
Type of health insurance
Medical Service 52 (26) 7.47 1.21
0.479
Social security 65 32.5 () 7.50 1.34
Rural 53 (26.5) 7.60 1.00
Other 11 (5.5) 7.93 0.96
There was no statistically significant dif-ference between SQ aspects in CS and ND. Statistically significant differences were found between continuity of care and SQ scores for several aspects. Participants with-out continuity of care reported lower SQ score than those with continuity for overall SQ (P=0.016) (Table 1). The aspects that had the highest score for Importance (>7.00) were quality of basic amenities, and safety.
Confidentiality, communication, choice of care provider, quality of basic amenities, autonomy and safety had the highest average
Performance value (≤ 0.40) and, the highest
SQ scores were for confidentiality, auton-omy, choice of care provider and communi-cation. Opportunity to be supported by a group of pregnant women and pregnancy experts (support group), and prompt atten-tion or timeliness had the lowest SQ scores. None of the aspects catch scores equal or
greater than 9.00, which is the minimum score for good SQ (Table 2).
As Table 2 reveals, from the perspective of women with ND, autonomy and confi-dentiality had the highest SQ scores; and choice of care provider, communication, autonomy and confidentiality had the high-est SQ scores from the perception of wom-en with CS.
Using univariate analysis for overall ser-vice quality, statistically significant differ-ences were found for service quality score by occupation (P=0.043) and continuous care by specialist (P=0.016).
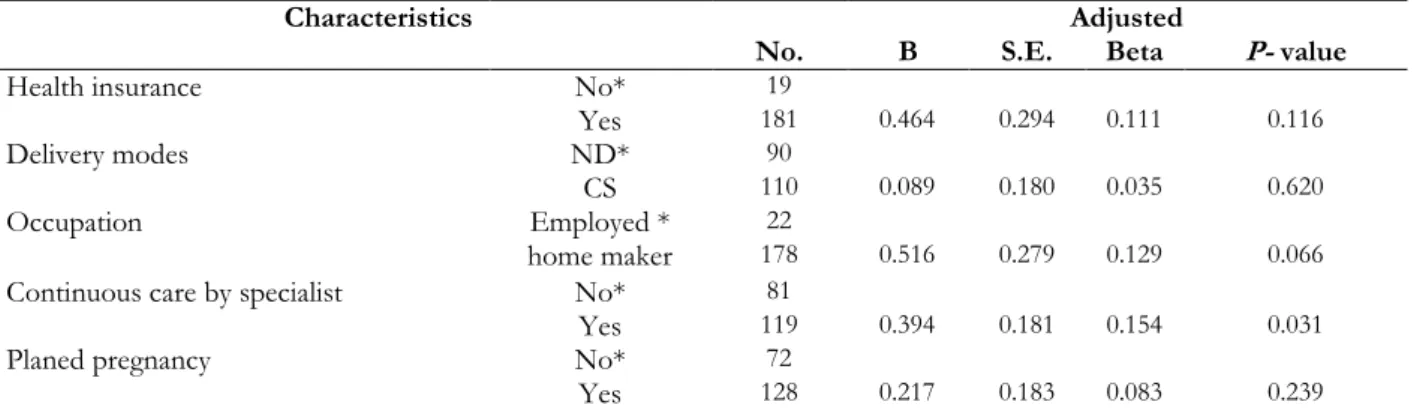
Finally, multiple regression analysis showed
that “continuous care by specialist” was si g-nificantly and independently related to SQ score. Therefore, women who get care con-tinuously by specialist reported SQ score, 0.394 unit higher than others (P= 0.028) (Table 3).
Table 2: Importance, Performance and SQ scores for quality aspects (No=200)
Service Quality Aspects ND (90) CS (110) Total
I 1 P 2 SQ 3 I P SQ I P SQ
Choice of care provider 6.37 0.38 7.98 6.68 0.31 8.31 6.54 0.34 8.16
Communication 6.82 0.33 7.93 7.02 0.25 8.52 6.93 0.28 8.25
Autonomy 5.83 0.35 8.11 6.14 0.30 8.26 6.00 0.33 8.19
Continuity 5.51 0.67 6.50 5.42 0.68 6.64 5.46 0.68 6.57
Support group 5.82 0.53 7.17 6.02 0.48 7.43 5.93 0.51 7.32
Quality of basic amenities 7.52 0.35 7.43 7.38 0.33 7.58 7.44 0.34 7.51
Dignity 6.43 0.45 7.22 6.63 0.41 7.50 6.54 0.43 7.37
Prompt attention 6.19 0.49 7.04 6.59 0.49 6.75 6.41 0.49 6.88
Safety 7.16 0.43 7.06 7.09 0.37 7.46 7.12 0.40 7.28
Prevention / early detection 6.81 0.52 6.52 7.14 0.36 7.46 6.99 0.44 7.04
Accessibility 5.64 0.52 7.20 5.59 0.41 7.99 5.62 0.46 7.64
Confidentiality 6.69 0.21 8.61 6.55 0.25 8.35 6.61 0.24 8.47
Overall service quality 6.37 0.44 7.38 6.53 0.40 7.60 6.46 0.42 7.50
1.Importance score: Range between 0 (not important) and 10 (very important)./ 2.Performance score: Range be-tween 0 (good) and 1 (poor)./ 3.Service Quality score: Range bebe-tween 0 (worst) and 10 (best).
Table 3: Results of Multiple Regression Analysis for Variables Related to total Service Quality score (No=170)
Characteristics
No.
Adjusted
B S.E. Beta P- value
Health insurance No* 19
Yes 181 0.464 0.294 0.111 0.116
Delivery modes ND* 90
CS 110 0.089 0.180 0.035 0.620
Occupation Employed * 22
home maker 178 0.516 0.279 0.129 0.066
Continuous care by specialist No* 81
Yes 119 0.394 0.181 0.154 0.031
Planed pregnancy No* 72
Yes 128 0.217 0.183 0.083 0.239
Discussion
Based on the SQ score, participants in the current study were less concerned about the quality of basic amenities, caring with respect (dignity), safety and continuity of care. But it is not expected that the highest quality of care reported for confidentiality, autonomy and choice of care provider. Con-fidentiality means being treated with trust. It
is defined as an individual‟s right to privacy
and the right to have control over personal information.13 Tabrizi and colleagues found
that in Tabriz health centres and posts from the perspective of pregnant women, service
quality aspects of “continuity of care”, “availability” and “confidentiality” achieved
scores at the level of good quality and “sup
-port group” (3.48), “safety” (6.79), and “dig
-nity” (7.14) reached low service quality
scores.14 It means in this study health
pro-viders probably conducting consultations in a way that safeguards privacy, strongly con-sidered confidentiality of information pro-vided by the patients and confidentiality of medical information and records.
The quality of delivered care from the
participants‟ perception was relatively high
in relation to communication and relation-ship with care providers and autonomy, while these aspects have been serious con-cerns in other studies among postpartum women.15,16 Autonomy means
self-govern-ment. It is defined as the right of patients to be involved and free to make a decision about their own health and treatment.15 In the present study the high SQ score for au-tonomy from the perspective of postpartum women shows that study participants proba-bly received enough information for making decisions, select treatment options and might be involved in the decision-making process. The high SQ score for choice of care provider indicates that not only most participants valued being free to choose among care providers including midwives, general practitioners, specialists and hospi-tals but also they had good opportunity to choose their care provider. Coulter and Jen-kinson reported different findings16 as
par-ticipants were highly dissatisfied in their abil-ity to choose their care provider due to the lack of adequate information.
Regarding inadequate and low overall SQ score, our findings are consistent with other studies about quality of labor.17-21 The study findings suggest that some SQ aspects (in-cluding support group and prompt atten-tion) that specifically need to be improved for postpartum women. Regarding support groups the similar results from a European study have been suggested that the oppor-tunity to be supported by a group of people, such as women at the end of pregnancy, with the same condition was highly desirable and women experienced a higher level of quality.5
While paying prompt attention to post-partum women during labour at hospital is one of the most important quality aspects,22
the majority of participants in this study ex-perienced inadequate attention. Our finding of very low SQ for continuity and timeliness and promptness of attention is consistent with findings by Miller and colleagues in Dominican Republic20 and also Burkhalter
and colleagues (2006) in 14 obstetrics hos-pitals in Benin, Ecuador, Jamaica and Rwan-da.21 Their participants noted a gap between their desired care services and delivered care. They were also dissatisfied with the restrict-ed time for consultation, lack of time to an-swer their questions and effectively dealing with their concerns.
Although the most of participants in this study had easy access to health services and hospitals, some participants reported limited accessibility of gynaecology hospital. Their need for better access is consistent with the results of several studies that emphasise the distribution of health care services on quality of delivered care.23,24 On the other hand,
re-sults from a study by Farrokhi and Khadi-varzadeh (2008)25 in Khorasan Province,
related to safety, which also suggests the need for improvement in these aspects.
Continuity of care, an important quality
aspect from patients‟ perspective,26,27 was
rated a relatively low qualityscores (SQ=6.57) in our study. For other diseases such as diabetes, evidence suggests that the quality of care is improved remarkably by having a regular health care provider,28 so that health system customers with a regular care provider might be more likely to receive optimal care.29Furthermore, customers‟ per
-ception on quality of services could be vary in terms of individual differences based on socio-economic, demographic and cultural status, the effect of media as well as the
se-verity of condition and the care providers‟
behaviour and relationship.30 In the present study, participants‟ perception differed by
the continuity of received care. Therefore, compared to people who reported receiving labour care from different providers, women with a regular health care provider were more likely to report higher quality of care. Selecting participants during 2 months by us-ing convenient samplus-ing and limitus-ing partici-pants to people who went to a teaching hos-pital could be a major weakness of this study. In the present study SQ was not measured separately for different care providers, such as midwifes, nurses and specialists.
Conclusion
From the perception of postpartum women, there is a notable gap between their expectations and their experiences in most aspects of provided care. The study results also identified inadequate overall SQ, and the far from optimal level (<9) for all quality aspects. These findings should concern care providers, hospital managers and policymak-ers to plan specific quality improvement programs for women with ND and CS. Postpartum women might be more satisfied with the health care system, particularly hos-pitals, if they were able to increase their knowledge and awareness about provided care, care facilities and care providers. There is also good opportunity to improve the
re-lationship between care providers and post-partum women.
Acknowledgements
We would like to acknowledge the finan-cial support of Health Services Management Research Centre and Al-Zahra teaching
hos-pitals‟ administrators and staff that cooper -ated with study questionnaires completion. We also greatly appreciate the study partici-pants who were able to express their per-ception about aspects that were important to them and their experiences about the quality of received care.
Competing interest
The authors declare that there is no con-flict of interest.
References
1. WHO. Fact sheet no 245: Essential
obstetric care 2000. Geneva: WHO;2011.
2. Delvaux T, Aké-Tano O, Gohou-Kouassi
V, Bosso P, Collin S, Ronsmans C. Quality of normal delivery care in côte
d'ivoire. Afr J Reprod Health 2007;11:22-32.
3. Parasuraman A, Zeithaml V, Berry L. A
conceptual model of service quality and
its implications for furture research.
Jour-nal of Marketing 1985;49:41-50.
4. Tabrizi JS. Quality of delivered care for
people with type 2 diabetes: A new patient
centered model. J Res Health Sci 2009;9:1-9.
5. Vinter-Repalust N, Petricek G, Katic M.
Obstacles which patients with type 2 diabetes meet while adhering to the therapeutic regimen in everyday life:
Qualitative study. Croatian Med J
2004;45:630-636.
6. Tabrizi JS, Wilson AJ, O‟Rourke PK.
Customer quality in health care. Patient
Educ Couns 2009;74:130-131.
7. Kenagy JW, Berwick DM, Shore MF.
Service quality in health care. JAMA
1999;281:661-665.
8. Berwick DM, Knapp MG. Theory and
practice for measuring health care quality.
Health Care Financing Review 1987;Annual
9. Jacobi CE, Boshuizen HC, Rupp I, Dinant HG, Van Den Bos GA. Quality of
rheumatoid arthritis care: The patient‟s
perspective. Int J Qual Health Care
2004;16:73-81.
10. Tabrizi JS, O‟Rourke PK, Wilson AJ, Coyne ET. Service quality for type 2 diabetes in australia: The patient
persp-ectives. Diabetic Med 2008;25:612-617.
11. van der Eijk I, Sixma H, Smeets T, Veloso
FT, Odes S, Montague S, et al. Quality of health care in inflammatory bowel disease: Development of a reliable questionnaire
(quote-ibd) and first results. Am J
Gastro-enterol 2001;96:3329-3336.
12. Queensland Government, Queensland
Health; 2006 [cited 2012 Feb 23]. Available from:
http://www.health.qld.gov.au/quality/pat _sat_survey/patsat.asp
13. WHO. Background paper for the
technical consultation on responsiveness concepts and measurement. Geneva: WHO;2001.
14. Tabrizi JS, Gholipour K, Alipour R,
Farahbakhsh M, Asghari-Jafarabadi M, Haghaei M. Service quality of maternity care from the perspective of pregnant women in tabriz health centers and health
posts – 2010-2011. Hospital 2014;12:9-19.
15. Boucar M, Bucagu M, Djibrira S. Safe
motherhood studies: results from
Rwanda. Bethesda: Quality Assurance Project; 2004.
16. Gbangbade S, Harvey S, Edson W,
Burkhalter B, Antonakos C. Safe motherhood studies-results from rwanda. Quality Assurance Project. Bethesda: University Research Co;2003.
17. Evans D. Health systems performance
assessment: Debates, methods and
empiricism. Geneva: WHO; 2003.
18. Coulter A, Jenkinson C. European
patients' views on the responsiveness of health systems and healthcare providers.
Europ J Public Health 2005;15:355-360.
19. C Maimbolwa M, Ransjö-Arvidson AB,
Ng'andu N, Sikazwe N, K Diwan V. Routine care of women experiencing normal deliveries in Zambian maternity
wards: a pilot study. Midwifery
1997;13:125-131.
20. Miller S, Cordero M, Coleman AL,
Figueroa J, Brito-Anderson S, Dabagh R,
et al. Quality of care in institutionalized deliveries: The paradox of the dominican
republic. Int J Gynaecol Obstet
2003;82:89-103.
21. Burkhalter B, Edson W, Harvey S. Quality
assurance project-operations research results: Quality of obstetric care observed in 14 hospitals in Benin, Ecuador, Jamaica
and Rwanda. Washington DC:
USAID;2006.
22. Adeyi O, Morrow R. Essential obstetric
care: Assessment and determinants of
quality. Soc Sci Med 1997;45:1631-1639.
23. Pooley CG, Gerrard C, Hollis S, Morton
S, Astbury J. „Oh it‟sa wonderful
practice… you can talk to them‟: a qualitative study of patients‟ and health professionals‟ views on the management
of type 2 diabetes. Health Soc Care
Community 2001;9:318-326.
24. Khunti K. Use of multiple methods to
determine factors affecting quality of care
of patients with diabetes. Family Practice
1999;16:489-494.
25. Farokhi F, Khadivzadeh T. Quality
assessment of midwives performance in prenatal cares in urban health centers in
Mashhad, Iran. Payesh 2008;3:203-210.[In
Persian].
26. Tabrizi JS. Quality of health care: The
patients' perspective on quality of care for type 2 diabetes [PhD Thesis]. Queensland: University of Queensland;2007.
27. Sherina HN, Teng CL, Yasin S.
Continuity of care of diabetic patients in a family practice clinic: How important is it?
Asia Pac Fam Med 2003;2:10-15.
28. Rosenblatt RA, Baldwin LM, Chan L,
Fordyce MA, Hirsch IB, Palmer JP. et al. Improving the quality of outpatient care for older patients with diabetes: lessons from a comparison of rural and urban
communities. J Fam Pract
2001;50:676-680.
29. O'Connor PJ, Desai J, Rush WA, Cherney
LM, Solberg LI, Bishop DB. Is having a regular provider of diabetes care related to
intensity of care and glycemic control? J
Fam Practice 1998;47:290-297.
30. Sixma HJ, Kerssens JJ, Campen CV,
Peters L. Quality of care from the patients' perspective: from theoretical concept to a new measuring instrument.