The relationship between social capital, social
support and the adequate use of prenatal care
A relação entre capital social e suporte social com
a adequação da utilização da atenção pré-natal
1 Escola Nacional de Saúde Pública Sergio Arouca, Fundação Oswaldo Cruz, Rio de Janeiro, Brasil.
2 Instituto de Estudos em Saúde Coletiva, Universidade Federal do Rio de Janeiro, Rio de Janeiro, Brasil.
Correspondence M. C. Leal
Escola Nacional de Saúde Pública Sergio Arouca, Fundação Oswaldo Cruz. Rua Leopoldo Bulhões 1480, Rio de Janeiro, RJ 21041-210, Brasil.
Maria do Carmo Leal 1
Ana Paula Esteves Pereira 1
Gabriela de Almeida Lamarca 1
Mario Vianna Vettore 2
Abstract
This study investigated the relationship between social capital and social support and the ad-equate use of prenatal care. A follow-up study involving 1,485 pregnant women was conducted in two cities in the Rio de Janeiro State, Brazil. De-mographic and socioeconomic characteristics, so-cial support and soso-cial capital data were collected during the first trimester of pregnancy. The post-partum period included information on levels of prenatal care utilization, social networks, parity, obstetric and gestational risk and prenatal care attendance. Hierarchized multinomial logistic regression was used in the statistical analysis. Pre-natal care use above adequate levels was associ-ated with high social capital at the city level (ag-gregated social capital), socioeconomic status and working during pregnancy. Lower non-aggregat-ed contextual and compositional social capital, gestational risk and pattern of prenatal care were associated with inadequate prenatal care utiliza-tion. Contextual social capital and social support were found to be social determinants for the ap-propriate use of prenatal care.
Social Inequity; Prenatal Care; Social Support
Introduction
A satisfactory birth for both fetus and mother depends upon careful monitoring during preg-nancy. Screening tests for the early identifica-tion of high risk pregnant women are considered the foremost strategies for the prevention of maternal and infant morbidity and mortality 1.
Other strategies developed during prenatal care include clinical management, prophylaxis of diseases, immunization and health promotion practices 2,3. Prenatal care is a window of
oppor-tunity for promoting a healthy lifestyle, includ-ing learninclud-ing how to make healthy food choices, weight control, stopping smoking and reduction of alcohol consumption 4,5.
The Brazilian Ministry of Health (Ministério da Saúde) recommends at least six prenatal care visits during the gestational period: one in the first, two in the second and three in the third tri-mester of pregnancy 6. In Rio de Janeiro State,
prenatal care coverage involving at least one prenatal visit reached 98 per cent in 2008, which can be considered as universal prenatal coverage (http://www.datasus.gov.br). However, there are discrepancies regarding the number of prenatal visits and the timing of the initiation of care be-tween different cities in the state 7.
preg-nancy were associated with adequate prenatal care utilization. On the other hand, inadequate prenatal care was significantly higher among adolescents, lighter-skinned black and darker-skinned black mothers, those living in favelas, those without paid work and those who had attempted abortion. Inadequate prenatal care utilization among the lighter-skinned/darker-skinned black mothers varied according to edu-cational level 8. Similar findings were reported
by others 9,10. During the last decades, more
attention has been given to interpersonal re-lationship networks among people who share common values. This is considered to be a kind of capital, and has been denominated “social capital” 11. Social capital is typically seen as a
part of the societal structure (a contextual ap-proach), while social networks and support are often conceptualized at the level of individuals (a compositional approach) 12,13. It is important
to view the “contextual” and “compositional” as being interrelated and not mutually exclusive. Indeed, attributing neighborhood differences to “individual” or “compositional” factors does not necessarily imply the absence of, or lack of im-portant place-based processes 14. The
“individ-ual” factors (e.g. low education, low income) are often themselves a product of the place where people live (places make people) 15. In the same
vein, the reverse is also true, that “contextual” factors are rarely independent of the individuals (people make places).
Social capital has an affect on health, by promoting the dissemination and adoption of healthy behaviors, promoting greater access to health services, raising awareness of human rights and promoting self-esteem and mutual respect 16.
Compositional social capital is related to social support, social networks, diversity, social resources, volume and structure 11. The
impor-tance of compositional social capital in adher-ence to prenatal care has been highlighted. So-cial support from the partner was reported as a relevant factor for the adequate use of prenatal care and for the adoption of health related behav-iors during pregnancy 17. Furthermore, women
who initiated prenatal care at an early stage were more likely to live with a partner and had more social networks 18.
Unfavorable social conditions are related to low scores of social capital and this interaction reinforces health inequalities 19. There are not
many Brazilian studies that consider the role of social capital in shaping the outcome of prena-tal care. The objective of this study, then, was to investigate the relationship of social capital and social support with adequate prenatal care use in
two cities in the Rio de Janeiro State with different socioeconomic conditions and levels of health services.
Methods
The study was approved by the Ethics Research Committee at the Brazilian National School of Public Health, Oswaldo Cruz Foundation (Es-cola Nacional de Saúde Pública Sergio Arouca, Fundação Oswaldo Cruz – ENSP/Fiocruz – pro-tocol nº. 158/06). A follow-up study of pregnant women was conducted in two middle-sized cit-ies in the Rio de Janeiro State. These citcit-ies were chosen because of their demographic similari-ties, differences in social capital and social sup-port proxy measures and for their differences in the provision of prenatal care. The per capita income was 118% lower while the homicide rate was 10 times higher in the city with the worst social capital proxy measures (city 1) compared with city 2 (http://www.ibge.gov.br; Secretaria de Estado de Segurança Pública do Rio de Janeiro. http://urutau.proderj.rj.gov.br/isp/admin/pa ginas/upboletim/2006_03_bol.pdf, accessed on Jun/2006). The proportion of gynecologists per women between 10-49 years-old was three times less in city 1 than in city 2. Prenatal care in cities 1 and 2 included 10 and 26 prenatal care units, respectively.
The sample size was established at 1,400 women, considering the prevalence of 25.8% inadequate and 8.3% more than adequate pre-natal care utilization 8, with a significance level
of 5% and 95% power to detect differences of at least 5%. The sample was increased by 20% due to possible losses during follow-up of pregnant women, resulting in a final sample of 1,680 preg-nant women.
Initially, a pilot study with 95 pregnant wom-en randomly selected at the same prwom-enatal care units of the main study was conducted to test the questionnaires. No changes were needed. After that, a test-retest study with a 15 day in-terval between interviews was conducted with 90 pregnant women to check for internal consis-tency and the temporal reliability of the scales. The Intraclass Correlation Coeficient between the two interviews was 0.893 for social capital, and ranged between 0.860 (emotional support) and 0.907 (material support) for the social sup-port scale dimensions. Cronbach’s α coefficient
for social capital was 0.706 and ranged from 0.706 (affectionate support) to 0.863 (emotional sup-port) for social support scale factors.
indi-trained interviewers.
The selection criteria were women in the first trimester of pregnancy and those who had given birth to a live or stillborn child. Women who ex-perienced miscarriage or abortion (birth weight < 500g or gestational weeks < 22) were excluded.
The baseline data collection was performed in 2008, and included pregnant women randomly selected from those who sought prenatal care at the state-funded health care units administered by the Brazilian Unified National Health System (SUS). The participants were gathered at five pre-natal care units (primary and referral health cen-ters) in each city, which represent 90% of prenatal care coverage in both cities.
At the baseline, demographic and socioeco-nomic characteristics, social support and so-cial capital were collected. The follow-up was performed in the post-partum period imme-diately after the delivery in the ward of the ma-ternity hospitals or at home within 30 days after discharge.
The data obtained in the follow-up were ad-equacy of prenatal care utilization, social net-works, obstetric history, prenatal attendance and gestational risk.
The assessment of the adequacy of prenatal care utilization was performed using the Ko-telchuck index 20. This index characterizes
pre-natal care utilization in two independent and distinctive dimensions: adequacy of initiation of prenatal care and adequacy of received ser-vices, once the prenatal has begun. In this study, the adequacy of prenatal care initiation and the expected number of visits were based on rec-ommendations from the Brazilian Ministry of Health 6, adjusted for gestational age at
initia-tion of care and for gestainitia-tional age at delivery for preterm births. The dimensions were com-bined into a single summary prenatal care uti-lization index, which has four categories: inad-equate, intermediate, adequate and more than adequate utilization 7,20. In the present study,
the two outcomes were “more than adequate prenatal care utilization” and “inadequate pre-natal care utilization”.
Social capital is the set of norms and net-works that enable people to act collectively 21.
This concept was operationalized from the fol-lowing indicators: social trust, social control, empowerment, political efficacy and neighbor-hood security 24. Social trust refers to the
percep-tion of trust in people, inter-relapercep-tionships and solidarity with the social community neighbor-hood 16. Social control refers to people’s
per-ceptions of community. Social control assesses whether neighbours would intervene in
situ-quent behaviour 23. Empowerment relates to
access to economic and educational resources, information, goods, money and skills that can be used to bring about environmental changes and influence other people and institutions with competing interests or conflicting political per-spectives 24. Political efficacy refers to people’s
perceptions in relation to political systems and politicians 25. Neighborhood security refers to
the perception of people about safety in the place where live 26. Social support is a system
of formal and informal relationships through which individuals receive emotional support, material or information to cope with stressful emotional situations 27. Social networks are the
“web” of social relationships surrounding the in-dividual as well as their characteristics, or groups of people who have contact with that individual, or with some form of participation 28. Since each
subscale of the social capital questionnaire was made up of different numbers of items, the final scores for each subscale were standardized from 0 to 100. In this way, the subscales were compa-rable and could be added up to form the social capital variable.
The social capital questionnaire used was developed and previously tested in the Brazilian population, with adequate internal consistency for the 30 item scale (Cronbach’s α > 0.70) 22.
The questionnaire of social support consists of 19 items comprising five dimensions of func-tional social support: material, affective, emo-tional, positive social interaction, and informa-tion 29,30.
The Social Network questionnaire consisted of five questions concerning the person’s rela-tionship with their family and friends, and their participation in social groups. The social support and social network questionnaires were found to be reliable for the Brazilian population 30,31.
Social capital and social support data were used to characterize both cities. It was assumed the selected cities would represent different levels of contextual (aggregated and non aggre-gated) social capital as ecological exposure and social support was used to reflect compositional social capital. Furthermore, non-aggregated so-cial capital and soso-cial support were also consid-ered as individual variables.
Covariates were demographic and socioeco-nomic characteristics, obstetric history, prenatal care attendance and pregnancy risk.
Demographic data were age and race/skin color, which was based on self-perception of skin color.
room, years of schooling, work during pregnan-cy and marital status.
The social class classification used is based on market power comprising a group of specific indicators and level of education of the head of household. A set of points is assigned to these indicators and a final score defines the socio-economic groups; A (highest), B, C, D, and E (lowest) 32.
Obstetric history included parity, previous history of fetal or neonatal death, previous low birth weight and previous preterm birth. Pre-natal care attendance data were prePre-natal care in more than one health service and prenatal in more than one municipality. Women were con-sidered at gestational risk when at least one of the following diseases/events was self-reported: diabetes, hypertension, HIV infection, heart dis-eases, kidney disdis-eases, autoimmune disdis-eases, threatened abortion, previous perinatal death, previous preterm birth or previous low birth weight.
Statistical analysis
The mean scores of social capital and social sup-port were compared between the two cities with the corresponding 95% t test confidence intervals of the difference.
Demographic and socioeconomic charac-teristics and parity were compared between the two cities through chi-square test. Social support and social network were compared between the categories of covariates for each city. Bivariate analyses of social capital, social support, social network and covariates with adequacy of prena-tal care utilization were conducted for each city. Continuous variables were compared using the t test and ANOVA, while categorical variables were analyzed using the chi-square test, with a signifi-cance level of 5%.
Multinomial logistic regression was per-formed to test the association of city, social capi-tal and social support with adequacy of prenacapi-tal care utilization, adjusting for covariates. Initially bivariate analysis was performed between inde-pendent variables and “more than adequate uti-lization” and “inadequate utiuti-lization”. Those vari-ables that present p ≤ 0.20 were considered for
the multivariate analysis. Since socioeconomic characteristics moderate the effect of social capi-tal and social support on the adequacy of prena-tal care utilization, interactions between social capital, social support and socioeconomic char-acteristics were tested by constructing separate models and adding and removing each interac-tion term one by one. No interacinterac-tion was found (results not shown).
Hierarchised multinomial multivariate lo-gistic analysis was performed to evaluate the association of social capital and social support with adequacy of prenatal care utilization, con-trolling for potential confounders. The first block included the variable “city”. The second block was composed of social capital, social support and social network. The third block involved de-mographic and socioeconomic characteristics, and the fourth block included obstetric history, prenatal care attendance and gestation risk. The significance of the additional variables was test-ed at each stage and non significant ones (p > 0.20) were eliminated in order to reduce the dis-crepancy between the data and the model and to find an economic model with relatively few parameters.
In the fully adjusted logistic model we includ-ed all the variables that present p ≤ 0.20 at the
bivariate analysis, independently of whether it was from the same level or not.
The association was estimated through odds ratio with a significance level of 5%. Regression coefficients for social capital and per capita family income were multiplied by 5 and 100, respectively, on the log scale, so that they indi-cate a change in the outcome variable for every increase in 5 and 100 units in social capital and per capita family income. All statistical tests were performed with SPSS, version 17.0 (SPSS Inc., Chicago, USA).
Results
Of the 1,750 pregnant women invited to partici-pate in the study, 70 (4%) declined. Of the 1,680 women that participated in the baseline, 12 (0.7%) did not agree to participate in the follow-up and 183 (10.9%) were lost in the follow-follow-up: miscarriage, abortion, moved home or were not found in the follow-up. The final sample involved 1,485 women, which corresponds to 88.4% of the baseline.
The mean age of the subjects was 24.8 ± 6.2 years at baseline, and 34% were white, 42.5% were lighter-skinned black and 23.5% was darker-skinned black. The proportions of per capita fam-ily income were 44.3% (≤ ½ the minimum wage),
37.9% (> ½ - ≤ 1 minimum wage) and 17.8% (>
1 minimum wage). The mean of the mother’s schooling was 7.7 ± 2.9 years. The frequency of social class B, C, D and E was 5.6, 61.5, 28.2 and 4.8 per cent, respectively.
Social capital and social support among pregnant women in two cities in Rio de Janeiro State, Brazil, 2008.
City 1 (N =722) City 2 (N = 958) Difference 95%CI of the difference
p-value
Mean SD Mean SD Lower Upper
Social capital
Social trust 6.83 4.73 7.47 5.13 0.64 0.162 1.121 0.009
Social control 11.22 6.70 12.49 6.90 1.27 0.610 1.928 < 0.001
Empowerment 3.32 3.98 2.97 3.61 -0.35 -0.711 0.018 0.062
Neighborhood security 15.11 4.09 16.07 3.89 0.96 0.575 1.343 < 0.001 Political efficacy 1.64 3.35 1.66 3.57 0.02 -0.320 0.352 0.926
Social capital (global) 38.13 12.71 40.67 13.14 2.54 1.286 3.791 < 0.001 Social support
Emotional support 14.52 5.36 15.70 5.05 1.18 0.680 1.682 < 0.001 Material support 14.70 5.10 15.01 5.24 0.31 -0.194 0.807 0.230
Affective support 18.33 3.07 18.64 2.69 0.31 0.038 0.591 0.026 Positive interaction 15.64 4.86 16.52 4.53 0.88 0.424 1.328 < 0.001 Information support 14.94 5.03 15.50 5.02 0.56 0.070 1.043 0.025
SD: standard deviation; 95%CI: 95% confi dence interval.
Note: all dimensions of social capital and social support range from 0 to 20. Social capital (global) ranges from 0 to 100.
lower for women from city 1 than for their coun-terparts from city 2. A similar trend was found when comparing the dimensions of social sup-port. City 1 showed lower levels of emotional support, affective support, positive interaction and information support compared with city 2 (p < 0.05).
Demographic and socioeconomic character-istics for the two cities are shown in Table 2. The mean age and the proportion of white women were significantly higher for women from city 2. Each demographic and socioeconomic charac-teristic was statistically different between the two cities. Women from city 1 were more likely than those from city 2 to be from a low social class, to report low per capita family income, to be lighter-skinned black, to be a teenager, to not work dur-ing pregnancy, to be married and to be in their first pregnancy (p < 0.05). They also reported higher schooling (p < 0.05).
Comparative analysis was conducted sepa-rately in each city to determine which social support domains were significantly related to demographic and socioeconomic characteristics and parity (Table 2). Socioeconomic status, per capita family income, schooling and parity were associated with all dimensions of social sup-port in both cities (p < 0.05). The prosup-portion of people per room was inversely associated with all dimensions of social support (city 1) and with emotional support (city 2).
Maternal age demonstrated statistical signifi-cance with material support in city 1 and emo-tional support in city 2. Married women reported higher affective support in both cities, and lower material support (city 1). The scores for posi-tive interaction were higher among those work-ing durwork-ing pregnancy compared with those not working. Affective support was also associated with work during pregnancy (city 1) (Table 2).
The analyses of social network characteristics according to demographic and socioeconomic covariates for each city are presented in Table 3.
Having a relative to talk to was inversely as-sociated with parity in both cities, and positively associated with schooling (city 2). Women who indicated “having a friend to talk to” reported more years of schooling in both cities, higher per capita family income (city 1), working dur-ing pregnancy (city 2), to be unmarried (city 2) and with fewer children (city 2) (p < 0.05). Partici-pation in a neighborhood association was more common in older women and those with more children in both cities, in women from higher so-cial classes (city 1), and in women with less years of schooling (city 2).
Table 2
Socio-demographic differences between the cities, social support according to socio-demographic characteristics in pregnant women from two cities in Rio de Janeiro State, Brazil, 2008.
City 1 (N = 722)
n (%)
City 2 (N = 958)
n (%)
p-value City 1
Emotional Material Affective Positive interaction
Information
Mean p-value Mean p-value Mean p-value Mean p-value Mean p-value
Socioeconomic status
E+D 272 (37.7) 280 (29.2) * 13.6 * 13.8 * 17.7 * 14.7 * 14.3 *
C + B 450 (62.3) 678 (70.77) 15.1 15.2 18.7 16.2 15.3
Per capita family income ** (minimum wages ***)
≤ 1/2 327 (48.9) 318 (41.0) * 13.8 * 14.2 * 17.8 * 14.6 * 14.2 *
> 1/2 and ≤ 1 238 (35.6) 300 (38.7) 14.9 14.9 18.6 16.5 15.4
> 1 104 (15.5) 157 (20.3) 16.2 16.2 19.3 17.3 16.2
People per room
≤ 2 556 (77.0) 790 (82.5) * 14.9 * 15.0 * 18.6 * 16.1 * 15.2 *
> 2 166 (23.0) 168 (17.5) 13.3 14.0 17.4 14.2 14.0
Pregnant characteristics Race/Skin color
White 165 (22.9) 407 (42.5) * 14.6 NS 14.6 NS 18.31 NS 15.7 NS 14.8 NS
Lighter-skinned black 375 (51.9) 353 (36.8) 14.8 14.9 18.3 15.5 15.2
Darker-skinned black 182 (25.2) 198 (20.7) 13.9 14.5 18.4 15.9 14.5
Age (years)
≤ 19 185 (25.6) 196 (20.5) * 14.6 NS 15.6 * 18.5 NS 15.8 NS 15.1 NS
20-34 495 (68.6) 660 (68.9) 14.6 14.4 18.3 15.6 14.9
≥ 35 42 (5.8) 102 (10.6) 13.8 14.0 18.0 15.1 14.9
Years of schooling
≤ 4 75 (10.4) 174 (18.2) * 13.4 * 14.2 NS 17.0 * 13.1 * 13.7 *
5-8 304 (42.1) 431 (45.0) 14.0 14.5 18.2 15.3 14.6
≥ 9 343 (47.5) 353 (36.8) 15.2 15.0 18.8 16.5 15.6
Work
Yes 254 (35.2) 413 (43.2) * 14.8 NS 15.0 NS 18.6 NS 16.3 * 15.3 NS
No 468 (64.8) 545 (56.8) 14.4 14.6 18.2 15.3 14.8
Marital status
Married 550 (76.2) 683 (71.2) * 14.5 NS 14.5 * 18.5 * 15.7 * 14.8 NS
Not married 172 (23.8) 275 (28.8) 14.7 15.4 17.8 15.5 15.3
Parity #
First child 313 (47.4) 368 (41.9) * 15.3 * 15.7 * 18.8 * 16.4 * 15.7 *
2-3 275 (41.5) 371 (42.3) 14.2 14.3 18.4 15.6 14.7
≥ 4 73 (11.0) 139 (15.8) 12.4 12.1 16.6 13.0 12.9
City 2
Emotional Material Affective Positive interaction Information
Mean p-value Mean p-value Mean p-value Mean p-value Mean p-value
Socioeconomic status
E+D 14.7 * 13.9 * 18.1 * 15.3 * 14.4 *
C + B 16.1 15.5 18.9 17.0 16.0
Per capita family income ** (minimum wages ***)
≤ 1/2 14.8 * 14.3 * 18.1 * 15.6 * 14.8 *
> 1/2 and ≤ 1 16.1 15.1 19.0 16.9 15.8
> 1 16.6 15.5 19.1 17.4 16.4
People per room
≤ 2 15.8 15.1 NS 18.7 * 16.6 NS 15.5 NS
> 2 15.4 14.6 18.2 16.0 15.5
Pregnant characteristics Race/Skin color
White 15.8 NS 15.1 NS 18.8 NS 16.8 NS 15.7 NS
Lighter-skinned black 15.7 15.0 18.6 16.4 15.6
Darker-skinned black 15.5 14.9 18.4 16.1 15.0
Age (years)
≤ 19 16.5 * 15.8 NS 18.7 NS 16.9 NS 16.1 NS
20-34 15.6 14.8 18.6 16.5 15.3
≥ 35 15.2 14.8 18.3 16.1 15.5
Years of schooling
≤ 4 14.9 * 14.5 * 18.1 * 15.5 * 14.6 *
5-8 15.6 14.7 18.7 16.6 15.4
≥ 9 16.2 15.7 18.9 17.0 16.1
Work
Yes 16.0 NS 15.1 NS 18.9 * 16.9 * 15.7 NS
No 15.5 15.0 18.5 16.2 15.4
Marital status
Married 15.7 NS 14.8 NS 18.9 * 16.7 NS 15.5 NS
Not married 15.7 15.5 18.0 16.1 15.6
Parity #
First child 16.6 * 16.0 * 18.8 * 17.0 * 16.3 *
2-3 15.2 14.5 18.8 16.6 15.1
≥ 4 14.4 13.5 17.8 15.0 14.3
NS: non signifi cant. * p < 0.05;
** N = 669 in city 1 and N = 775 in city 2;
*** Minimum wage in Rio de Janeiro State in 2008 = R$415.00 equivalent to US$230.00; # N = 661 in city 1 and N = 878 in city 2.
Table 3
Social network according to sociodemographic characteristics in pregnant women from two cities in Rio de Janeiro State, Brazil, 2008.
City 1 (N = 661)
n Have a relative to talk
Have a friend to talk
Neghborhood association
Voluntary work, charity
Religious activities
Yes (%) p-value Yes (%) p-value Yes (%) p-value Yes (%) p-value Yes (%) p-value
Socioeconomic status
E+D 249 77.9 NS 52.6 NS 3.2 * 1.6 * 71.9 *
C+B 412 81.8 58.3 7.5 4.9 79.9
Per capita family income (minimum wages) **
≤ 1/2 *** 300 78.7 NS 50.7 * 6.7 NS 3.7 NS 78.3 NS
> 1/2 and ≤ 1 222 79.3 62.6 4.1 4.5 75.7
> 1 95 84.2 64.2 7.4 2.1 73.7
People per room
≤ 2 511 80.2 NS 56.9 NS 5.7 NS 3.5 NS 76.9 NS
> 2 150 80.7 53.3 6.7 4.0 76.7
Pregnant characteristics
Race/Skin color
White 151 80.8 NS 62.3 NS 6.0 NS 3.3 NS 76.8 NS
Lighter-skinned black 339 80.2 51.9 4.1 3.5 75.5
Darker-skinned black 171 80.1 59.1 9.4 4.1 79.5
Age (years)
≤ 19 171 52.6 NS 3.5 NS 2.3 * 71.9 NS 79.8 NS
20-34 453 57.4 6.8 3.5 77.9 71.4
≥ 35 37 56.8 5.4 10.8 86.5 82.8
Years of schooling
≤ 4 70 71.4 NS 50.0 * 7.1 NS 4.3 * 77.1 NS
5-8 272 79.8 49.6 3.7 1.1 76.1
≥ 9 319 82.8 63.0 7.5 5.6 77.4
Work
Yes 427 80.8 NS 53.4 NS 4.7 NS 3.0 NS 75.9 NS
No 234 79.5 61.1 8.1 4.7 78.6
Marital status
Married 505 79.4 NS 56.6 NS 5.9 NS 3.4 NS 77.6 NS
Not married 156 83.3 54.5 5.8 4.5 74.4
Parity #
First child 313 83.8 * 59.6 NS 3.2 * 2.9 NS 75.8 NS
2-3 275 80.7 54.9 8.4 4.4 77.1
≥ 4 73 64.4 45.2 8.2 4.1 80.8
City 2 (N = 887)
n Have a relative to talk
Have a friend to talk
Neghborhood association
Voluntary work, charity
Religious activities
Yes (%) p-value Yes (%) p-value Yes (%) p-value Yes (%) p-value Yes (%) p-value
Socioeconomic status
E+D 255 78.4 NS 46.3 * 3.5 NS 2.0 NS 58.4 NS
C+B 623 82.5 62.2 4.3 4.2 60.9
Per capita family income (minimum wages) **
≤ 1/2 *** 286 79.0 NS 55.2 NS 4.9 NS 4.9 NS 52.8 *
> 1/2 and ≤ 1 282 83.7 60.8 4.2 2.5 62.9
> 1 143 81.1 64.3 2.8 3.5 69.9
People per room
≤ 2 717 81.7 NS 58.9 NS 3.9 NS 3.9 NS 61.4 NS
> 2 161 79.5 51.6 5.0 1.9 54.7
Pregnant characteristics Race/Skin color
White 369 83.5 NS 59.2 NS 2.7 NS 3.2 NS 60.3 NS
Lighter-skinned black 319 80.9 57.7 5.3 4.7 63.3
Darker-skinned black 190 77.9 54.2 4.7 2.1 54.7
Age (years)
≤ 19 180 82.1 NS 56.1 NS 2.8 * 1.1 NS 53.3 NS
20-34 604 82.0 57.9 3.6 3.8 62.0
≥ 35 94 75.5 58.5 9.6 6.4 61.7
Years of schooling
≤ 4 153 78.4 * 44.4 * 7.8 * 5.2 NS 54.9 NS
5-8 404 78.7 55.6 4.2 2.5 60.2
≥ 9 321 86.0 66.4 2.2 4.0 62.6
Work
Yes 491 81.5 NS 54.1 * 3.9 NS 3.0 NS 56.7 *
No 387 81.1 62.0 4.4 4.1 64.6
Marital status
Married 627 81.5 NS 54.9 * 4.3 NS 4.5 * 62.7 *
Not married 251 80.9 64.1 3.6 1.2 53.8
Parity #
First child 367 84.5 * 62.2 NS 2.2 * 2.7 NS 60.1 NS
2-3 372 82.0 54.8 4.3 3.5 61.3
≥ 4 139 71.2 52.5 8.6 5.8 57.6
NS: non signifi cant. * p-value < 0.05;
** N = 617 in city 1 and N = 711 in city 2;
income (city 2). In addition, the frequency of par-ticipation in religious activities was statistically higher among women that worked during preg-nancy and married women (city 2) (Table 3).
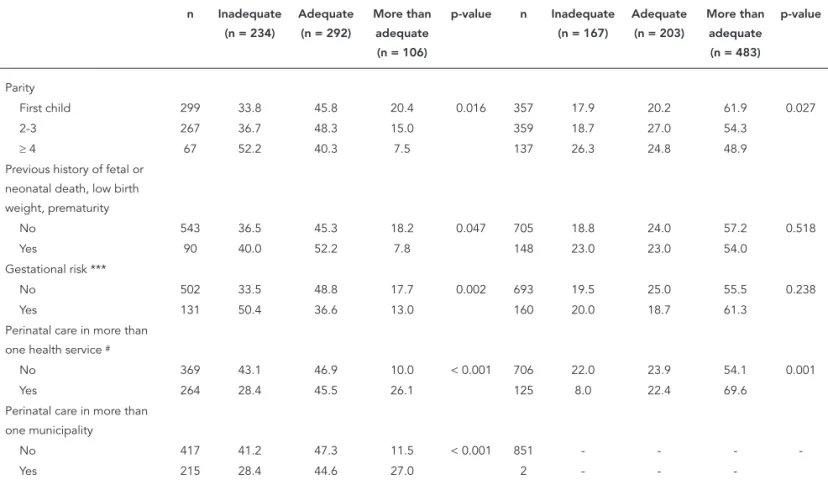
The association of social capital, demograph-ic and socioeconomdemograph-ic characteristdemograph-ics, obstetrdemograph-ic history and prenatal care attendance with ade-quate prenatal care use in each city is presented in Table 4. Women who received adequate pre-natal care presented higher scores for emotional support and positive interaction compared with women who received inadequate prenatal care. The average scores of these social support di-mensions were statistically higher for women with more than adequate prenatal attendance than for women with just adequate prenatal care. There were statistical differences in per capita family income, persons per room, parity, years of schooling, working during pregnancy and having prenatal care in more than one health care unit among groups of adequate prenatal care use in both cities (p < 0.05). Women with obstetric and gestational risk were more frequent among those with inadequate prenatal care in city 1. In addi-tion, in city 1, there was a significant difference between women who reported prenatal care in more than one municipality and those who did not in the adequate use of prenatal care. Older women groups tended to have a higher propor-tion of adequate prenatal care and unmarried women were more prone to inadequate prena-tal care compared with married women in city 2 (Table 4).
Table 5 shows the bivariate, hierarchical and fully adjusted multinomial analyses. The bivari-ate multinomial analyses revealed that women living in city 2 (aggregated contextual social capi-tal), those with higher levels of non-aggregated social capital, social control and neighborhood security were more likely to get more than ad-equate prenatal care. Two dimensions of social support greatly increased the odds of receiving more than adequate prenatal care. Higher emo-tional support and positive interaction increased 16% and 14% the likelihood of receiving more than adequate prenatal care. No social network dimensions reached statistical significance with more than adequate prenatal care. Otherwise, al-most all demographic and socioeconomic factors were associated with having more than adequate prenatal care. For example, high socioeconomic status, high per capita family income, lighter skin color, older women and having paid work pre-dicted more than adequate prenatal care.
Factors associated with inadequate pre-natal care at the bivariate analysis were lower non-aggregated contextual social capital, lower neighborhood security and lower social support
concerning emotional and affective support and positive interaction indicators. In addition, we found that women with higher affective support were less likely to have inadequate prenatal care (24% less for an increase of 5 points in a 0 to 20 scale). Three socioeconomic factors that were positively associated with more than adequate prenatal care associated inversely with inad-equate prenatal care: socioeconomic status, per capita family income and paid work, while higher parity and lower schooling only influenced the chance of having inadequate prenatal care. More-over we found that women at gestational risk, which were supposed to start the prenatal care earlier and carry out more visits, were the ones that had a higher chance of having inadequate prenatal care (OR = 1.68). As expected, the ones that consulted more than one health unit were 60% less likely to be classified as “inadequate”.
Aggregated social capital (city level) increased by eight-fold the odds of more than adequate prenatal care (Table 5). The social variables (level 2) that in the univariate analysis were associated with more than adequate prenatal care lose their statistical significance. However, higher socio-economic status and having paid work remained statistically significant. The same was true for years of schooling, where the chance of having more than adequate prenatal care increased by almost 7% for each additional year. Age and skin color were no longer significant.
Higher non-aggregated contextual social capital, neighborhood security, emotional sup-port, affective support and positive interaction remained inversely associated with inadequate prenatal care, even after controlling for the ag-gregated social capital (hierarchically adjusted). Women with a higher non-aggregate social capi-tal score performed 5.5% less for inadequate pre-natal care for every 5 point increase on a 0 to 100 scale. For the others, the protection was 17.5%, 16.7%, 24.3% and 17.9% for each 5 point increase on a 0 to 20 scale, respectively.
The strong connection between socioeco-nomic conditions, social capital and social sup-port, at the individual level, was responsible for the weakness of the association between non-ag-gregate contextual social capital and inadequa-cy of prenatal care in the fully adjusted model. Although the direction remained the same, the sample used here did not have sufficient power to detect an independent association.
Discussion
(compo-Adequacy of prenatal care according to sociodemographic characteristics in pregnant women from two cities in Rio de Janeiro State, Brazil, 2008.
City 1 (N = 632) City 2 (N = 853)
n Inadequate (n = 234)
Adequate (n = 292)
More than adequate (n = 106)
p-value n Inadequate (n = 167)
Adequate (n = 203)
More than adequate (n = 483)
p-value
Total (%) 632 37.0 46.3 16.7 - 853 19.6 23.8 56.6
-Social Capital (mean) 632 36.8 38.2 39.0 0.240 853 38.8 40.9 41.3 0.095
Social Support (mean)
Emotional support 632 13.9 14.8 15.6 0.017 853 14.7 15.6 16.0 0.023
Material support 632 14.5 14.8 15.4 0.343 853 14.5 15.2 14.9 0.411
Affective support 632 18.2 18.5 18.8 0.165 853 18.3 18.7 18.7 0.195
Positive interaction 632 15.1 16.1 16.3 0.029 853 15.8 16.3 16.8 0.044
Information support 632 14.9 15.0 15.6 0.454 853 14.8 15.5 15.6 0.247
Social network (% of yes)
Have a relative to talk 633 76.1 81.6 86.8 0.055 853 81.4 78.8 82.0 0.629
Have a friend to talk 633 57.7 53.2 62.3 0.244 853 52.7 57.6 59.8 0.273
Neghborhood association 633 7.7 4.8 3.8 0.232 853 6.6 3.0 3.9 0.201
Voluntary work, charity 633 3.8 3.1 2.8 0.845 853 2.4 2.0 4.3 0.213
Religious activities 633 74.4 77.1 81.1 0.385 853 50.9 59.6 63.1 0.021
Socioeconomic status
E+D 235 46.1 46.4 7.5 < 0.001 255 25.9 26.3 47.8 0.001
C+B 397 31.7 46.1 22.2 598 16.9 22.7 60.4
Per capita family income (minimum wages) *
≤ 1/2 ** 288 41.7 45.5 12.8 < 0.001 280 28.2 22.9 48.9 < 0.001
> 1/2 and ≤ 1 210 30.5 53.8 15.7 276 12.7 22.8 64.5
> 1 92 33.7 34.8 31.5 136 9.6 19.8 70.6
People per room
≤ 2 490 33.0 48.0 19.0 < 0.001 696 17.7 24.1 58.2 0.012
> 2 142 50.7 40.1 9.2 157 28.0 22.3 49.7
Race/skin color
White 145 35.9 45.5 18.6 0.871 359 16.2 23.4 60.4 0.166
Lighter-skinned black 324 38.5 45.1 16.4 307 21.2 23.1 55.7
Darker-skinned black 163 35.0 49.0 16.0 187 23.5 25.7 50.8
Age (years)
≤ 19 167 41.3 44.9 13.8 0.128 588 27.7 20.3 52.0 0.041
20-34 431 34.8 48.0 17.2 177 17.9 24.6 57.5
≥ 35 34 44.1 29.4 26.5 88 14.8 25.0 60.2
Years of schooling
≤ 4 67 43.2 47.8 9.0 < 0.001 149 26.8 24.8 48.4 0.013
5-8 260 44.3 46.5 9.2 389 21.1 23.7 55.2
≥ 9 305 29.5 45.6 24.9 315 14.3 23.5 62.2
Employed
No 405 42.0 46.2 11.8 < 0.001 482 24.7 24.9 50.4 < 0.001
Yes 227 28.2 46.3 25.5 371 12.9 22.4 64.7
Marital status
Married 481 36.3 46.2 17.5 0.670 606 17.2 23.9 58.9 0.017
Not married 151 39.1 46.3 14.6 247 25.5 23.5 51.0
Table 4 (continued)
City 1 (N = 632) City 2(N = 853)
n Inadequate (n = 234)
Adequate (n = 292)
More than adequate (n = 106)
p-value n Inadequate (n = 167)
Adequate (n = 203)
More than adequate (n = 483)
p-value
Parity
First child 299 33.8 45.8 20.4 0.016 357 17.9 20.2 61.9 0.027
2-3 267 36.7 48.3 15.0 359 18.7 27.0 54.3
≥ 4 67 52.2 40.3 7.5 137 26.3 24.8 48.9
Previous history of fetal or neonatal death, low birth weight, prematurity
No 543 36.5 45.3 18.2 0.047 705 18.8 24.0 57.2 0.518
Yes 90 40.0 52.2 7.8 148 23.0 23.0 54.0
Gestational risk ***
No 502 33.5 48.8 17.7 0.002 693 19.5 25.0 55.5 0.238
Yes 131 50.4 36.6 13.0 160 20.0 18.7 61.3
Perinatal care in more than one health service #
No 369 43.1 46.9 10.0 < 0.001 706 22.0 23.9 54.1 0.001
Yes 264 28.4 45.5 26.1 125 8.0 22.4 69.6
Perinatal care in more than one municipality
No 417 41.2 47.3 11.5 < 0.001 851 - - -
-Yes 215 28.4 44.6 27.0 2 - -
-* N = 692 in city 1 and N = 590 in city 2;
** Minimum wage in Rio de Janeiro State in 2008: R$415,00; equivalent to US$230,00; *** Diabetes, Hypertension, HIV, heart or kidney diseases;
# N = 831.
sitional social capital) were associated with ad-equacy of prenatal care use. However, aggregated contextual social capital was measured only in two cities, and other environmental exposures could have been responsible for this finding, like the greater availability and accessibility of prena-tal care units in city 2.
Two main findings on social capital must be underlined because of the two different perspec-tives used to understand the concept: contextual social capital from Putnam’s theory 13 and
com-positional social capital from Bordieu’s theory 12.
On the one hand, more than adequate use of pre-natal care was associated with high social capital at the city level (aggregated social capital). On the other hand, the odds of inadequate prenatal care use was higher among women with lower non-aggregated contextual and compositional social capital.
Social capital is a collective attribute of com-munities or societies, and its beneficial proper-ties are associated with individuals and their social relationships 11. Poorting 33 used data
from 22 European countries to show that rather than having a contextual influence on health, the beneficial properties of social capital can be found at the individual level. Individual levels of social trust and civic participation were strongly associated with self-rated health. At the same time, the aggregate social trust and civic partici-pation variables at the national level were not related to people’s subjective health after con-trolling for compositional differences in socio-demographics.
Putnam’s social capital concepts 13 were
Hierarchized multinomial logistic regression between social capital and social support with adequate prenatal care utilization.
Variable Adequate vs. more than adequate Adequate vs. inadequate
Crude Hierarchically adjusted
Fully adjusted Crude Hierarchically adjusted
Fully adjusted
OR p-value OR p-value OR p-value OR p-value OR p-value OR p-value
Level 1
City (reference category = 1) 6.58 < 0.001 6.58 < 0.001 8.07 < 0.001 1.03 0.828 1.03 0.828 0.92 0.607
Level 2
Social capital * (divided by 5) 1.05 0.054 1.02 0.516 0.97 0.374 0.95 0.045 0.95 0.041 0.95 0.095
Social trust 1.05 0.473 - - - - 0.95 0.427 - - -
-Social control 1.10 0.030 1.06 0.251 0.93 0.115 0.92 0.108 0.95 0.375
Empowerment 0.99 0.932 - - - - 0.97 0.749 - - -
-Neighborhood security 1.16 0.058 1.04 0.669 0.86 0.055 0.85 0.049 0.85 0.071
Political efficacy 0.99 0.912 - - - - 0.95 0.576 - - -
-Social support * (divided by 5)
Emotional support 1.16 0.014 1.10 0.146 1.07 0.579 0.86 0.014 0.86 0.013 0.90 0.299
Material support 1.01 0.856 - - - - 0.92 0.204 0.92 0.199 1.03 0.736
Affective support 1.07 0.547 - - - - 0.80 0.056 0.80 0.056 1.04 0.845
Positive interaction 1.14 0.054 1.09 0.226 1.01 0.904 0.85 0.019 0.85 0.018 1.00 0.968
Information support 1.10 0.140 1.08 0.257 1.06 0.663 0.95 0.433 - - -
-Social network (reference category = no)
Have a relative to talk to 1.17 0.313 - - - - 0.88 0.430 - - -
-Have a friend to talk to 1.24 0.082 1.25 0.091 1.02 0.912 1.02 0.864 - - -
-Neghborhood association 0.97 0.915 - - - - 1.86 0.039 1.86 0.038 2.23 0.016
Voluntary work, charity 1.58 0.192 1.68 0.168 1.17 0.703 1.25 0.582 - - -
-Religious activities 0.85 0.209 - - - - 0.78 0.088 0.78 0.089 0.87 0.379
Level 3
Socioeconomic status * 1.07 < 0.001 1.05 0.015 1.08 0.002 0.96 0.003 0.99 0.746 0.99 0.635 Per capita family income *
(divided by R$100,00)
1.14 < 0.001 1.04 0.259 1.05 0.253 0.86 0.001 0.97 0.464 0.97 0.480
Race/Skin color ** (reference category = darker-skinned black)
1.31 0.001 0.99 0.888 1.00 0.980 0.96 0.689 - - -
-Age * 1.03 0.002 1.02 0.091 1.03 0.129 0.98 0.082 0.97 0.099 0.97 0.057
Years of schooling * 1.04 0.070 1.07 0.026 1.04 0.291 0.93 0.001 0.97 0.288 0.98 0.451 Work (reference category = no) 1.67 < 0,000 1.42 0.026 1.62 0.019 0.63 0.002 0.82 0.234 0.82 0.242
Married (reference category = no) 1.04 0.783 - - - - 0.80 0.130 0.73 0.077 0.72 0.068
Parity ** (1,2,3...) 0.96 0.424 - - - - 1.11 0.027 1.14 0.061 1.15 0.060
Level 4
Previous History of fetal or neonatal death, low birth weight, prematurity (reference category = no)
0.89 0.479 - - - - 1.08 0.654 - - -
-Gestational risk *** (reference category = no)
1.30 0.104 1.34 0.238 1.34 0.238 1.73 0.001 1.69 0.005 1.69 0.005
Perinatal care in more than one health service (reference category = no)
0.860 0.27 - - - - 0.63 0.003 0.63 0.011 0.63 0.011
* Continuous variable; ** Ordinal variable;
availability of health services are more prone to receive more than adequate prenatal care.
This study was not able to examine the direct mechanisms by which contextual social capital may improve access to prenatal care. However, social capital refers to three interdependent community factors, namely interpersonal trust, civic engagement (i.e. active participation in public affairs), and norms of reciprocity (i.e. gen-eralized expectations of cooperative behavior) 13.
Furthermore, social capital may operate to cre-ate more humane, efficient, better coordincre-ated, broader, or deeper health care systems. If we ex-tend this reasoning to health care institutions, we may argue that social capital improves access in the same manner that social capital improves lo-cal government functioning 34. Social capital may
be the element of values and sense of community that operates to improve both the probability and impact of accountability mechanisms because in higher social capital communities, reputa-tions matter, and shared values and community goals are more likely to exist. Conversely, in low social capital communities, common values and goals are lacking, and reputations do not travel through the community because its residents are more disengaged, resulting in weakened ac-countability mechanisms 34.
Socioeconomic status and having paid em-ployment also remained associated with more than adequate utilization of adequate prenatal care in multivariate analysis, showing that in-dividual social conditions were independently associated with prenatal care. Other authors demonstrated the inverse care law in women’s health care utilization 35,36. The use of adequate
health services was correlated with having a higher educational level, having private health insurance and being married 35. In addition,
hav-ing received a mammogram in the previous two years was associated with urban residence, years of schooling, family income, number of physi-cian visits, and health plan coverage 36.
Social support components such as emotion-al support, affective support and positive interac-tion were inversely associated with inadequate prenatal care. This finding is consistent with the study by St Clair et al. 37, who reported that
utiliza-tion of prenatal care was significantly associated with social network structural variables, includ-ing size of relative network, emotional intimacy with relatives, frequency of contact with friends and dispersion of friendship network.
Non-aggregated contextual social capital and lower compositional social capital (social sup-port) were associated with inadequate prenatal care use. This occurred independently of aggre-gate social capital. In this case, the importance of
social capital was found at both contextual and compositional levels. According to Fukuyama 38,
social capital can be embodied in the smallest and most basic of groups, the family, as well as the largest of all groups, the nation. So, it can be argued that the benefits that individuals accrue from their own social networks can lead to a de-crease in inadequate prenatal care use.
It can be assumed that women tended to use informal and specific social relationships (e.g. neighbors, friends and family members) at a minimum cost, giving access to specific sets of resources 11. This may represent a kind of
indi-vidual social capital and networks to capitalize benefits towards health, and to overcome contex-tual barriers to obtain access to prenatal care, like limited availability of health services.
Women who reported participation in neigh-borhood associations were more prone to in-adequate prenatal care use. These women were older, had lower schooling levels and higher ity when compared with those who did not par-ticipate in neighborhood associations. Further-more, schooling and lower parity were associated with more relationships with family and friends. Similarly, St Clair et al. 37 showed that women
with higher parity and lower levels of education reported greater participation in neighborhood social networks. In our study, the social networks of women with inadequate prenatal care were characterized by low levels of diversity, and in-cluded people from the same social group with similar patterns of health service use.
The social support measures confirmed that pregnant women living in unfavorable social conditions showed lower scores for non-aggre-gated social capital. In addition, the city with the highest levels of social capital also presented bet-ter social indicators. However, the proportion of unmarried women and higher parity were higher in the city with higher social capital. One poten-tial explanation for the unexpected higher parity in that city can be the lower proportion of young people and migrants compared with the city with low levels of social capital, which was constituted as a city 19 years ago, in contrast to the nearly 200 years of existence of the city with high social capi-tal. The higher frequency of women without part-ners in the city with high social capital may not represent an indicator for social disadvantage, but rather can be understood as a phenomenon of contemporary urban society and the econom-ic independence of women, like female headed households, as shown by Marin & Piccinini 39. In
ated with better socioeconomic conditions and formal employment, while the age and parity as well as household crowding were related with lower scores for social support. Married women reported feeling most loved and important to other people but relied less on social support when needed (for example, when sick or needing to go to the doctor). The contrast regarding the perception of material and emotional support among adolescents who frequently lived with supportive family members was striking. The fre-quency of adolescents was higher in the city with low social capital, and unmarried women lived in households with more people (data not shown).
Regarding the provision of health services, they failed to ensure a better adherence to pre-natal health care among women at previous or current obstetric risk, and this finding is in agreement with the Leal et al. 8 study. One
hy-pothesis is that health care systems in the cit-ies in the study were incapable of guaranteeing inter-sectoral referrals to improve the use of prenatal care. The lack of a connection between associative mechanisms for local communities (neighborhood associations) and health care systems to promote the improvement of the use of prenatal services in these communities may be an explanation.
longitudinal design. Measures for social capital and social support were collected during the first trimester of pregnancy while the information about prenatal care use was gathered during the post partum period. The use of adequate proxy indicators for income and violence to select the cities with different levels of social capital was confirmed through the significant differences found between the cities for social capital mea-sures. Furthermore, appropriate questionnaires were used to measure social capital and social support, which assured the validity of the study. Very good psychometric properties were ob-served in both questionnaires despite the fact the sample included pregnant women, a period of life marked by intense emotional experiences related to maternity.
The present study demonstrated that contex-tual social capital and social support were social determinants for adequate prenatal care use. In spite of the strong connection between socioeco-nomic conditions, social capital and social sup-port, independent connections were observed between different social determinants of health and prenatal care, even in cities with extremely poor health service provision.
Resumo
O objetivo deste estudo foi investigar a associação entre capital social e apoio social com a adequação da aten-ção pré-natal. Um estudo de seguimento que envolveu 1.485 gestantes foi realizado em duas cidades do Esta-do Esta-do Rio de Janeiro, Brasil. Características demográfi-cas e socioeconômidemográfi-cas e dados de capital social e apoio social foram coletados no 1o trimestre da gestação. No
pós-parto, registraram-se informações sobre adequa-ção do pré-natal, redes sociais, risco obstétrico e gesta-cional e padrão de atendimento pré-natal. Regressão logística hierarquizada multinomial foi utilizada na
análise. A utilização mais que adequada do pré-natal foi associada com maior capital social em nível de ci-dade (capital social agregado), status socioeconômico e trabalho durante a gravidez. Baixo capital social contextual não agregado e composicional, gestação de risco e padrão do uso do pré-natal foram associados com a utilização inadequada do pré-natal. O capital social contextual e o apoio social foram determinantes sociais para a adequação da utilização do pré-natal.
Contributors
M. C. Leal was responsible for designing and carrying out the research and writing up the article. A. P. E. Perei-ra participated in the research, data analysis and article write-up. G. A. Lamarca contributed in the research and in writing the article. M. V. Vettore was involved in car-rying out the research and writing up the article.
Acknowledgements
This research received support from CNPq and FAPERJ.
References
1. World Health Organization. Antenatal Care ran-domized trial: manual for the implementation of the new model. Geneva: World Health Organiza-tion; 2002.
2. Ministério da Saúde. Assistência pré-natal: manual técnico da Secretaria de Políticas de Saúde. 3a Ed.
Brasília: Ministério da Saúde; 2000.
3. Pender NJ, Murdaugh CL, Parsons MA. Health promotion in nursing practice. In: Pender NJ, Murdaugh CL, Parsons MA, editors. Upper saddle river. 5th Ed. New Jersey: Pearson Education Inc;
2005.
4. Chamberlain G. Manual de assistência pré-natal. São Paulo: Livraria Santos Editora; 1993.
5. Lin YH, Tsai EM, Chan TF, Chou FH, Lin YL. Health Promoting Lifestyles and Related Factors in Preg-nant Women. Chang Gung Med J 2009; 32:650-61. 6. Ministério da Saúde. Pré-natal e peruerpério
aten-ção qualificada e humanizada: manual técnico. 3a
Ed. Brasília: Ministério da Saúde; 2006. (Série A. Normas e Manuais Técnicos).
7. Szwarcwald CL, Mendonça MHM, Andrade CLT. Indicadores de atenção básica em quatro municí-pios do Estado do Rio de Janeiro, 2005: resultados de inquérito domiciliar de base populacional. Ciênc Saúde coletiva 2006 11:643-55.
8. Leal MC, Gama SG, Ratto KM, Cunha CB. Uso do índice de Kotelchuck modificado na avaliação da assistência pré-natal e sua relação com as car-acterísticas maternas e o peso do recém-nascido no Município do Rio de Janeiro. Cad Saúde Pública 2004; 20 Suppl 1:S63-72.
9. Coimbra LC, Silva AA, Mochel EG, Alves MT, Ri-beiro VS, Aragão VM, et al. Factors associated with inadequacy of prenatal care utilization. Rev Saúde Pública 2003; 37:456-62.
10. Bassani DG, Surkan PJ, Olinto MT. Inadequate use of prenatal services among Brazilian women: the role of maternal characteristics. Int Perspect Sex Reprod Health 2009; 35:15-20.
son JG, editor. Handbook of theory and research for sociology of education. New York: Greenwood Press; 1986. p. 241-8.
13. Putnam RD. Making democracy work: civic tradi-tions in Modern Italy. Princeton: Princeton Uni-versity Press; 1993.
14. Subramanian SV, Lochner KA, Kawachi I. Neigh-borhood differences in social capital: a composi-tional artifact or a contextual construct? Health Place 2003; 9:33-44.
15. Macintyre S, Ellaway A. 2000. Ecological approach-es: rediscovering the role of the physical and social environment. In: Berkman LF, Kawachi I, editors. Social epidemiology. New York: Oxford University Press; 2000. p. 332-48.
16. Berkman LF, Kawachi I. Social epidemiology. New York: Oxford University Press; 2000.
17. Lia-Hoagberg B, Schaffer M, Strohschein S. Public health nursing practice guidelines: an evaluation of dissemination and use. Public Health Nurs 1999; 16:397-404.
18. Quelopana AM, Champion JD, Salazar BC. Factors predicting the initiation of prenatal care in Mexi-can women. Midwifery 2009; 25:277-85.
19. Wilkinson R, Pickett K. The spirit level: why more equal societies almost always do better. 1st Ed.
London: Penguin Group; 2009.
20. Kotelchuck M. An evaluation of Kessner adequacy of prenantal care index and a proposed adequa-cy prenantal care utilization index. Am J Public Health 1994; 84:1414-20.
21. Woolcock M, Narayan D. Social capital: implica-tions for development theory, research and pol-icy. The World Bank Research Observer 2000; 15: 225-49.
22. Pattussi MP. Neighbourhood social capital and oral health in adolescents [Doctoral Dissertation]. Lon-don: University College London; 2004.
23. Sampson RJ, Raudenbush SW, Earls F. Neighbor-hoods and violent crime: a multilevel study of col-lective efficacy. Science 1997; 277:918-24.
24. Miles-doan R. “Empowering” women. Network 1994; 15:14-6.
25. Muntaner C, Oates GL, Lynch JW. Social class and social cohesion: a content validity analysis using a nonrecursive structural equation model. Ann N Y Acad Sci 1999; 896:409-13.
K, Gupta V. Social capital, income inequality, and firearm violent crime. Soc Sci Med 1998; 47:7-17. 27. Caplan G. Support systems and community mental
health. New York: Behavioral Publications; 1974. 28. Berkman LF, Syme SL. Social networks, host
resis-tance, and mortality: a nine-year follow-up study of Alameda County residents. Am J Epidemiol 1979; 109:186-204.
29. Sherbourne CD, Stewart AL. The MOS social sup-port survey. Soc Sci Med 1991; 38:705-14. 30. Griep RH, Chor D, Faerstein E, Lopes C. Apoio
so-cial: confiabilidade teste-reteste de escala no Estu-do Pró-Saúde. Cad Saúde Pública 2003; 19:625-34. 31. Chor D, Griep RH, Lopes C, Faerstein, E. Medidas
de rede e apoio social no Estudo Pró-Saúde: pré-testes e estudo piloto. Cad Saúde Pública 2001; 17:887-96.
32. Associação Nacional de Empresas de Pesquisa. Critério de classificação econômica no Brasil. São Paulo: Associação Nacional de Empresas de Pes-quisa; 1997.
33. Poortinga W. Social capital: an individual or collec-tive resource for health? Soc Sci Med 2006; 62:292-302.
34. Hendryx MS, Ahern MM, Lovrich NP, McCurdy AH. Access to health care and community social capi-tal. Health Serv Res 2002; 37:87-103.
35. Leal MC, Gama SGN, Frias P, Szwarcwald CL. Healthy lifestyles and access to periodic health ex-ams among Brazilian women. Cad Saúde Pública 2005; 21 Suppl:S78-88.
36. Lima-Costa MF, Matos DL. Prevalência e fatores associados à realização da amografia na faixa etária de 50-69 anos: um estudo baseado na Pes-quisa Nacional por Amostra de Domicílios (2003). Cad Saúde Pública 2007; 23:1665-73.
37. St Clair PA, Smeriglio VL, Alexander CS, Celentano DD. Social network structure and prenatal care utilization. Med Care 1989; 27:823-32.
38. Fukuyama F. Trust: the social virtues and the cre-ation of prosperity. New York: Free Press; 1995. 39. Marin A, Piccinini CA. Famílias uniparentais: a
mãe solteira na literature. Psico (Porto Alegre) 2009; 40:422-9.
Submitted on 15/Jun/2010