Visual Representation of Searched Results using
Tree Diagram
Goh Kim Nee, Chen Yoke Yie, Richard Liaw Zhi Cheng
Abstract –This paper presents a new search method and the representation of results via tree diagram. As the reliance on computers increases, so will the volume of data and information stored in them. Storing of data and information on the computer is not a difficult task, but what is more daunting is searching for the file that you have stored. Currently on a Windows Operating System File Search method, users are able to search for a file and the results are displayed immediately with no structure. A prototype was built in this research to enable users to search a file based on its contents followed by a recommendation to display results via tree diagram for returned search results. It was found that search result that is visually displayed via tree diagram offered users a visual representation of where the relative location of the file is stored. Future work should enhance the ability of the tree diagram display to be interactive.
Index terms: Content search, visual representation, tree diagram, Windows Operating System
I. INTRODUCTION
In our modern world, the use of computers has become essential in our everyday lives. As the reliance on computers rises, so does the volume of information and data stored in it. The importance of data storage and access facilities or methods is not to be taken for granted. Any operating system offer users with ways to organize and search for files and folders.
Each individual has their own method for searching a file or folder stored in our computer or storage devices. The search function in Windows allows users to search a file or folder based on the filename and its content. However, returned results are not displayed in an extensive view of where files and folders are stored or the way they are arranged. Is there a visual representation method that can serve as an alternative to what is already available now? The purpose of this research is to develop an alternative search method and to display its results in a tree diagram.
Manuscript received July 26, 2011; revised Aug 10, 2011.
Kim Nee Goh is with the Universiti Teknologi PETRONAS, Malaysia (phone:605-3687504; fax:605-3656180; e-mail: [email protected]).
Yoke Yie Chen is with the Universiti Teknologi PETRONAS, Malaysia (phone:605-3687516; fax:605-3656180; e-mail: [email protected]).
Richard Liaw Zhi Cheng was a student at Universiti Teknologi PETRONAS, Malaysia. (e-mail: [email protected]).
II. LITERATURE REVIEW AND THEORY
There are a few kinds of visual representation, as will be explained in this section.
Tag clouds are visualizations of data where words (or tags) are positioned in a cloud and augmented by various visual properties. They usually indicate the word frequency or concept relevance in a page by the size of each tag, and they may serve as navigation interfaces by providing hyperlinks to other pages [1]. Each tag is a description of the content or context of an object. To provide further clarification, tag clouds are “visual representations of social tags, displayed in paragraph style layout, usually in alphabetical order, where the relative size and weight of the font for each tag corresponds to the relative frequency of its use” [2].
To apply this visual method into this project, larger font tags can be a higher level of subdirectories and the smallest font will be used to represent end files. Now, the advantage that we can reap from this method is that a hierarchical view of the organization of subdirectories and files can be established. However, if there are a lot of subdirectories and files, the tag cloud would be too crowded and messy. As a result, searching for a single file would be too time-consuming as users will have to browse through many lines to locate the intended file. Fig. 1 shows an example of an overcrowded tag cloud.
Fig. 1. Overcrowded tag cloud
Fig. 2. Example of an organization chart
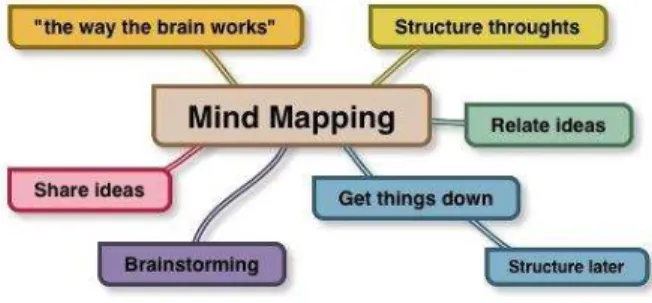
A mind map however, is a sketchily structured visual representation of organizing information [3]. The mind map shows the connection between a central topic and concepts, themes or tasks that relates to it including their levels of relativity. It makes use of the full range of our cortical skills – word, image, number, logic, rhythm, color and spatial awareness – in a single powerful technique which enables us to utilize the infinite expanse of our brain [4]. In other words, a mind map can be both visually appealing as well as a powerful tool to stimulate the user‟s memory abilities. Researchers in [5] states that mind maps leverages on human perception capabilities to represent information in a visual manner. Providing a graphical representation can localize related concepts, reducing cognitive load associated with retrieving and maintaining different knowledge elements [6]. As compared to linear representation of ideas, graphical representations of concepts are shown to have a positive impact on memory recall [7].
Fig. 3. Example of a mind map
Fig. 3 shows that mind mapping can easily show hierarchy and organization of files and folders. Like in the case of the organization chart, the technique of „grouping‟ can be utilized to avoid clutter. This technique is one that groups together an entity with its descendents. However, excessive grouping can render the search as impractical. Imagine if the file someone is looking for is stored within few levels of subdirectories. Mind mapping technique might be a powerful visual representation method but it may be impractical to display layers of search results. Besides that, generating a large mind map might require too much processing power or, in a more measurable unit: processing time. When using a search method, users would prefer a shorter response time. The Windows „Search‟ function does
a considerably good job in this aspect. Thus, to match the current system, the newly proposed search system should also incorporate shorter search durations.
Research by [8] proved that users we able to perform better when search results were represented in a visual manner through HotMap and Concept Highlighter. Using Google as the base for comparison, the authors developed HotMap, which “visually depicts the frequency of each of the terms in the users‟ queries using a compact color coding for each of the document surrogates in the search results.” Concept Highlighter however, works by obtaining a set of relevant concepts from a concept knowledge base using the user‟s query terms and cluster those results based on these concepts. Participants were surveyed after completing the tasks and pair-wise analysis of the results showed that HotMap was preferable to Google and Concept Highlighter.
In another research [9], they created SACK (Selective Application of Contextual Knowledge) which keeps track of user‟s information seeking activities based on context of search. The novelty of this system allows “user to pivot through this activity-based context to find, re-find and discover information through selective application of that context.” Users are given the liberty to select the context of the information search and make ad-hoc combinations of documents and queries to further explore the collection.
A research done by [10] found out in their visual search research that users looking at a Hyperbolic Tree display examined more tree nodes at a faster rate and visually scanned through the tree hierarchy at a faster rate than users of Windows File structure. When too much crowding happens in a compressed region, visual search gets degraded.
III. PRELIMINARY SURVEY
A preliminary survey was done with 30 participants, who are students in a university, with an age range between 20-22 years of age, to investigate their search behavior using Windows operating system computers.
Fig. 4. Search method of participants
Fig. 5 shows the result of how users search if they have forgotten the filename and location. It was found that 50% of the participants go through every directory, subdirectory(ies) until the file or folder is found. 30% reported that they will give up searching if the search becomes too cumbersome.
Fig. 5. Results of how users search if they have forgotten the filename and location.
Users are also asked which search method they would prefer to use, as seen in Fig. 6. It was reported that most users would opt to use the Windows „Search‟ function as it is more convenient and less cognitive processing that is needed from the user.
Fig. 6. Users search method preference
From the results above, we can see that the majority of people are very reliant on the Windows „Search‟ function.
Of course, this does not come as a surprise as it is the simplest method of search and does not burden the users‟ cognitively. Most people find that it is the fastest method to search for files. However, interestingly enough, when users find themselves in a situation where they cannot remember both the location and name of the file they are looking for, they abandon this „Search‟ function. From Fig. 5 of the survey, we notice that a total of 80% did not prefer to use the „Search‟ function, when in contradiction, 70% of them actually stated that they prefer searching for files using this function (based on Fig. 6).
IV. RESULTS AND DISCUSSION
A. Proposed System Design
Fig. 7 shows the flowchart of the proposed system.
Fig. 7. Flowchart of the proposed system
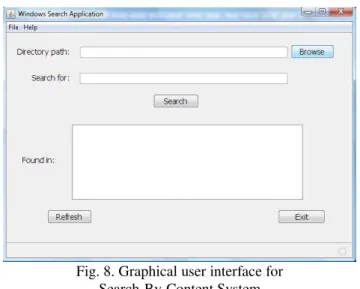
Fig. 8. Graphical user interface for Search-By-Content System
From Fig. 8, a „Directory path‟ is required as an input from the user. The program will check for the validity of the path. If the directory path does not exist or the input from user is not a directory path at all, an error message will be displayed. To further aid the users, this program includes a „Browse‟ button. By clicking this button, a GUI file chooser will appear in a pop-up window. By browsing through the computer, users can select any folder they wish to set as the target directory. By setting a target directory and clicking „Open‟, the directory path will automatically be transferred into the „Directory path‟ text field of the program.
Next, in the „Search for‟ field, the user is required to enter a keyword or a phrase. The purpose of this is to provide the program with an argument to search. As of this prototype, the program will search for the keyword or phrase as a whole, which includes the filename and also the content of the files. This means that the search will only return true on files that contain the exact match to the keyword or phrase entered by the user. This system is not case sensitive. The search is not limited to only alphabetic input. A combination of any kind of character is also accepted (eg: numbers and punctuation marks).
B. System Implementation
The „Search‟ button, when clicked, will first get the text from both the directory path and keyword/key phrase text fields. Then, the program will check the validity of the directory path. After which the program will enter into a recursion. A recursion or more specifically, a recursive method is basically one that works very much like a loop. The difference is, instead of running a counter and looping as long as the counter is within range, the recursive method is one that repeats by invoking/calling itself. The recursive method in this program basically goes through all the files stored under the specified directory, including the files of all level of subdirectories.
At every file, the program will open a file input stream and read the contents of that file line after line. The purpose is to
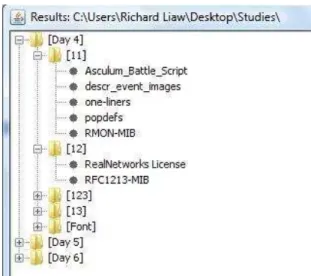
search for the intended keyword or phrase. At the successful discovery of the first instance of the keyword or phrase in a file, the line-by-line reading of that file will end and the program will proceed to search in the next file. All files that are found containing the keyword or phrase will be added into a vector. The main advantage of using a vector in this program is its ability to contain other vectors, thus the hierarchy of files and folders can be recorded and maintained. The vectors are created and objects are added according to the relative hierarchy and location of files and folders. Every time a subdirectory is encountered, a new vector will be created and added into its parent vector. Every time a file is encountered, a new file object is initialized and added into its parent vector. This continues until all files and folders are recorded as a hierarchy of vectors and objects. Next, the program just has to display all the vectors, sub-vectors and objects as folders, sub-folders and files while preserving their relative position in the hierarchy. This will result in a tree that will appear in a pop-up window.
Once a search is completed, a list of files containing the keyword or phrase will be displayed in the “Found in:” output text area, as shown in Fig. 9. The output text area is also utilized as an area to display error messages. The purpose of the list is to provide users with a simple view of all the files that they would be interested in. Sometimes, a user might not be interested in the hierarchy of files or their relative location. They just want to look for a file that contains a keyword or phrase.
Fig. 9. List of Files Containing the Word „study‟
reference. The pop-up will not disappear until it is manually closed by the user.
Fig.10. Example of Expanded Tree Diagram
C. User Acceptance Test (UAT)
A user acceptance test was done with 30 participants, students in a university with the age range between 20-22.
The purpose of the test is to test the prototype‟s performance on various computers with different specification. This will
allow the researchers to gather qualitative feedback from users about their perceived usefulness of the proposed system.
A test case has been prepared for the users. The keyword to search for is standardized (“Target”). The directory path that is to be entered to start the search is also standardized. The root/target directory is a folder named “Testing”. This is a directory created solely for this test and is distributed to all end users. This root directory is populated with 6 subdirectories. These 6 subdirectories are then populated with various subdirectories or files. Overall, there are approximately 187 subdirectories or files contained within this root directory. The time it takes for the system to complete the search is recorded. „Time‟ here is defined as the duration (in seconds) from when the user clicks the „Search‟ button to when the Tree Diagram window pops up. Excerpts of 5 users with different computer specifications were taken as samples to be shown in this paper as summarized in Table 1.
Table 1: User Acceptance Testing Results User
Number
Computer Specifications Search time User Feedback
User 1 Operating System:
Windows Vista™ Home Premium (6.0, Build 6002) Service Pack 2 (6002.vistasp2_gdr.100608-0458) Processor:
Intel(R) Core(TM) 2 CPU T7200 @ 2.00GHz (2 CPUs) ~2.0GHz
Memory: 2046MB RAM
9 seconds “A useful program. The tree diagram helps me in navigating to the folder that I was looking for. Maybe you would want to include an „Advanced Search‟ where users can enter more criteria for the search? Just an opinion.”
User 2 Operating System:
Windows XP Professional (5.1, Build
2600) Service Pack 3
(2600.xpsp_sp3_gdr.101209-1647) Processor:
Intel(R) Pentium(R) 4 CPU 2.40GHz Memory:
1016MB RAM
10 seconds “I don‟t think I will use a program like this much. Unless of course, the list and tree diagram are more interactive. I want to double click the list or tree and directly open the files.”
User 3 Operating System:
Windows XP Professional (5.1, Build
2600) Service Pack 3
(2600.xpsp_sp3_gdr.090804-1435) Processor:
Intel(R) Pentium(R) 4 CPU 2.40GHz Memory:
504MB RAM
19 seconds “Kind of slow for me. Maybe an option to choose whether I want the tree diagram to be generated or not. If I disable it, wouldn‟t the search be faster?”
User 4 Operating System:
Windows XP Professional (5.1, Build
2600) Service Pack 3
(2600.xpsp_sp3_gdr.080814-1236) Processor:
Intel(R) Core(TM) 2 Duo CPU E8400 @ 3.00GHz (2 CPUs)
Memory: 1980MB RAM
User 5 Operating System: Windows 7 Professional 32-bit (6.1, Build 7600) (7600.win7_rtm.090713-1255)
Processor:
Intel(R) Atom(TM) CPU N450 @ 1.66GHz (2 CPUs), ~1.7GHz
Memory: 1024MB RAM
11 seconds “Can be better if the tree is interactive.”
From this test, it was found that the average search time is 11.4 seconds. However, search time is also dependant on the amount of files to be search and the number of layers the search will be doing. Based on the users qualitative feedback, the system is found to be overall satisfactory. However, numerous users have mentioned their inability to interact with the resulting list and tree diagram. Currently, the resulting list and tree diagram does not allow users to click and open the files. Users would like that option to double click on files to open them or even drag and drop to move and rearrange files. This is a proposed future improvement.
V. CONCLUSION AND FUTURE WORK
There might be the case when users want to search for files relating to a certain topic but could not remember their file names or when users would want to search for certain contents but there are too many files with similar names stored arbitrary in a folder. This prototype is able to serve as an alternative search program as it has the ability to search for files containing the keyword or phrase. The winning point of this search method is that it provides a comprehensive „tree view‟, which the Windows Search function does not provide. Our future work is to enable the tree diagram‟s interactivity and to integrate this system with the current Windows search function, to complement with what is currently available.
REFERENCES
[1] J. Oosterman and A. Cockburn, “An empirical comparison of tag clouds and tables,” in Proc. of the 22nd Conference of the Computer-Human Interaction Special Interest Group of Australia on Computer-Human Interaction, Brisbane, Australia, 2010, pp. 288-295.
[2] M. A. Hearst and D. Rosner, “Tag Clouds: Data Analysis Tool or Social Signaler?” in Proc. of the 41st Annual Hawaii International Conference on System Sciences, Hawaii, USA, 2008, pp.160.
[3] V. Chik, B. Plimmer and J. Hosking, “Intelligent mind-mapping,” in Proc of the 19th Australasian conference on Computer-Human Interaction: Entertaining User Interfaces, Adelaide, Australia, 2007, pp. 195-198.
[4] T. Buzan, The Mind Map Book: Millennium Edition. Bath, Great Britain: BBC Worldwide Limited, 2000. [5] P. Kommers and J. Lanzing, “Student‟s concept
mapping for hypermedia design: navigation through the world wide web space and self-assessment,” Journal of Interactive Learning Research, vol. 8, 1997, pp. 3-4.
[6] S. Tergan, “Digital Concept Maps for Managing Knowledge and Information,” in Lecture Notes in Computer Science: Knowledge and Information Visualization, 2005, pp. 185-204.
[7] H. Lin and H. Faste, “Digital mind mapping: innovations for real-time collaborative thinking,” in Proc. of the 2011 annual conference extended abstracts on Human factors in computing systems, Vancouver, Canada, 2011, pp. 2137-2142.
[8] O. Hoeber and X. D. Yang, “A Comparative User Study of Web Search Interfaces: HotMap, Concept Highlighter, and Google,” in International Conference on Web Intelligence, Hong Kong, 2006, pp.866-874. [9] G. Golovchinsky and J. Pickens, “Interactive
Information Seeking via Selective Application of Contextual Knowledge,” in Proc. of the 3rd symposium on Information interaction in context, New Jersey, USA, 2010, pp.145-154.