Short Term Minimum Water Temperatures
Determine Levels of Infection by the
Amphibian Chytrid Fungus in
Alytes
obstetricans
Tadpoles
Saioa Fernández-Beaskoetxea1, Luis M. Carrascal1, Andrés Fernández-Loras1, Matthew C. Fisher2*, Jaime Bosch1,3*
1Museo Nacional de Ciencias Naturales, CSIC, Madrid, Spain,2Department of Infectious Disease Epidemiology, Imperial College London, St. Mary’s Hospital, London, United Kingdom,3Centro de Investigación, Seguimiento y Evaluación, Parque Nacional de la Sierra de Guadarrama, Rascafría, Spain
*matthew.fisher@imperial.ac.uk(MCF);bosch@mncn.cisc.es(JB)
Abstract
Amphibians are one of the groups of wildlife most seriously threatened by emerging infec-tious disease. In particular, chytridiomycosis, caused by the aquatic fungus Batrachochy-trium dendrobatidis, is responsible for amphibian species declines on a worldwide scale. Population-level outcomes following the introduction of the pathogen are context dependent and mediated by a large suite of abiotic and biotic variables. In particular, studies have shown that temperature has a key role in determining infection dynamics owing to the ecto-thermic nature of the amphibian host and temperature-dependency of pathogen growth rates. To assess the temperature-dependent seasonality of infectious burdens in a suscep-tible host species, we monitored lowland populations of larval midwife toads,Alytes obste-tricians, in Central Spain throughout the year. We found that infections were highly seasonal, and inversely correlated against water temperature, with the highest burdens of infection seen during the colder months. Short-term impacts of water-temperature were found, with the minimum temperatures occurring before sampling being more highly predic-tive of infectious burdens than were longer-term spans of temperature. Our results will be useful for selecting the optimal time for disease surveys and, more broadly, for determining the key periods to undertake disease mitigation.
Introduction
Spatiotemporal variation in the amount of clinical disease caused by pathogens is common in
nature [1–4]. In many settings, this variation follows a marked seasonal pattern that is related
to the thermal requirements of the pathogens [5–6] or to changes in the host density and its
immune system [7–10]. Seasonality determines much of the external environmental variation
influencing diseases, and several studies have shown that seasonality plays an important role in
OPEN ACCESS
Citation:Fernández-Beaskoetxea S, Carrascal LM, Fernández-Loras A, Fisher MC, Bosch J (2015) Short Term Minimum Water Temperatures Determine Levels of Infection by the Amphibian Chytrid Fungus inAlytes obstetricansTadpoles. PLoS ONE 10(3): e0120237. doi:10.1371/journal.pone.0120237
Academic Editor:Christopher Somers, University of Regina, CANADA
Received:September 11, 2014
Accepted:February 4, 2015
Published:March 20, 2015
Copyright:© 2015 Fernández-Beaskoetxea et al. This is an open access article distributed under the terms of theCreative Commons Attribution License, which permits unrestricted use, distribution, and reproduction in any medium, provided the original author and source are credited.
Data Availability Statement:All relevant data are within the paper.
population ecology of both host and pathogen [11–12]. Therefore, by studying seasonal envi-ronmental variability it is possible to make predictions about changes in infection dynamics over time.
Chytridiomycosis is an amphibian specific disease that has been recognized as one of the
main causes of recent amphibian declines and extinctions worldwide [13–14]. The causal
agent,Batrachochytrium dendrobatidis(Bd) is a pathogenic fungus whose impacts on
amphibi-an populations show strong spatial amphibi-and temporal variation. Spatial variation in the prevalence of infection is highly heterogeneous and caused by taxonomic (under- and over-infected fami-lies), environmental (e.g., temperature range and precipitation at a site), and community-level
(e.g., species richness) determinants [14]. It is well known that some populations of susceptible
species do not develop any symptoms of disease, even when many individuals are highly
para-sitised byBd[15], whereas others suffer severe declines or extinctions. This variation in the
vir-ulence ofBdis known to be caused by a complex interaction between biotic (host community
structure, predatory microbiota, probiotic skin bacteria) and abiotic (altitude, temperature,
UVB, climatic seasonality) factors [16–21]. In temperate zones, with greater seasonality, the
outcome of infection is usually more variable than in tropical areas [22], being more harmful
in cool and high altitude regions [23–25]. Within a region, seasonal environmental fluctuations
have important consequences for the development of disease.
Among the many environmental factors that regulate populations of saprobic aquatic fungi, temperature has profound impacts on their population dynamics and explains why many
chy-tridiomycetes bloom with seasonal temperature changes [26].Bd in vitrogrows most rapidly
between 17°C and 25°C. At temperatures above 28°C and below 10°C the growth rate decreases
[27–28] and the pathogen is killed within short periods of time at temperatures of 37°C or
above [29]. An increasing number of studies have revealed a strong influence of temperature
on patterns ofBdinfection in wild populations [18,30–32]. Australian adult frogs show peaks
of prevalence in the coolest months of the year [18,33–35] and the same pattern is known to
occur in North America and Puerto Rico, where the epidemiology ofBdis strongly dictated by
seasonality, transitioning from complete disappearance during summer to causing die-offs
during winter [22,36–40].
WhileBdattacks the keratinized mouthparts of amphibian larvae, tadpoles survive as
reser-voirs without suffering obvious symptoms of disease [16,23]. However, when metamorphosis
occurs, the fungus invades the recently keratinized skin of the juvenile animal causing hyper-keratosis, impairment of osmoregulatory processes and triggering death in vulnerable species
[43]. Mortality is dependent on an individuals intensity of infection, which also shows
tempo-ral variation depending on the year, breeding behaviour of the animals, density of the host or
their body size and sex [41–42]. Therefore, linking changing patterns of infection intensity to
biotic and abiotic factors is important for understanding the rate of clinical disease that ulti-mately impacts host populations. In this study we aimed to assess the temperature-dependent seasonality of infectious burdens in tadpoles of a susceptible species in order to improve our ability to model and predict the impacts of chytridiomycosis across host populations.
Materials and Methods
The study area is located in the agropastoral valley of the Duoro River in the municipality of Toro (Province of Zamora in Castilla-León, Spain). Fresh water springs are common and
many flow into artificial troughs that are used by cattle.Aytes obstetricans(the common
mid-wife toad) breeds in these troughs, where the species reproduces twice a year (spring and au-tumn) and autumn tadpoles often overwinter.
Six troughs located between 693 and 772 m of altitude were selected for the study (Nueva de Bardales, UTM coordinates 30T 304137, 4588429; Valdespino, UTM coordinates 30T 300479, 4587707; Villares, UTM coordinates 30T 299974, 4586932; Perros, UTM coordinates 30T 297429, 4585493; Picarico, UTM coordinates 30T 295107, 4586056 and Marlota, UTM coordi-nates 30T 294955, 4583532). Selected troughs were similar in size and hold similar tadpole den-sities to those found across the Iberian Peninsula. Submerged dataloggers (HOBO Pro v2
Water Temperature Logger U22–001, Onset Inc., Bourne, Massachusetts) in each trough
pro-vided a continuous half-hourly measurement of water temperature across one year, from Feb-ruary of 2010 to January of 2011. These sites were not privately owned or protected and therefore no permissions to access the troughs are required. On the other hand, because the studied species is protected by national legislation, animal care as well field permits to conduct this research were obtained from the Consejería de Medio Ambiente, Junta de Castilla y León, Spain (permit EP/CyL/20/2010).
Each month, we estimated the total number ofA.obstetricanstadpoles present in every
trough, as well the proportion of tadpoles below Gosner stage 36 (no, or rudimentary, hind
limbs present)[44]. Twenty tadpoles were captured at random with a small hand-net and
swabbed gently with a sterile cotton swab (MW 100–100, Medical Wire & Equipment) 20
times across their mouthparts. After swabbing, the tadpoles were released back into their troughs. According to the current national legislation no approval from an Animal Care and Use Committee is required for these procedures. DNA extractions from the swabs were
per-formed using PrepMan Ultra (Applied biosystems) and the amount ofBdDNA present in
each sample was measured through a CFX96TM Real-Time PCR Detection System
(BIO-RAD) with aBd-specific Taqman Assay [45]. Each 96-well assay plate included a negative
con-trol and four different standards containing DNA from 100, 10, 1 and 0.1Bdgenome
equiva-lents. We used an isolate from infectedA.obstetricansin Northwest Spain (IA042, Ibón
Acherito, Spanish Pyrennees) as a source of standards. Both, the standard isolate and the strain
present at the studied area genetically closely related, being members of theBdGPL lineage
(un-published results).
Infection load was measured as the number of zoospore equivalents per swab. Each sample
was performed in duplicate and individuals were consideredBd-positive when the results of
the two replicates were consistent and>0.1 zoospore genome equivalents. If not, the sample
was re-run and considered positive only if another positive result occurred. Prevalence was cal-culated as the percentage of infected individuals.
General Linear Mixed Models were applied to analyse variation in population averagedBd
loads (log transformed; x’= ln[x+1]) throughout eleven months (from March to January).
Pop-ulation averagedBdloads were used instead of individual values as our sampling unit was the
population at each“site”. Site was considered as a random factor, and average minimum and
maximum daily water temperatures, tadpole abundance and tadpole development as covari-ates. These analyses were carried out using estimates of average minimum and maximum tem-peratures across six different periods of time (2, 5, 10, 15, 22 and 30 days prior to tadpole sampling). As February was the first month with temperature records we could not include this month in data analyses due to the lack of temperature data for January 2010. The mean square (MS) and the degrees of freedom (df) of the error terms were estimated following
Sat-terthwaite’s method; this finds the linear combinations of sources of random variation that
a random intercept + random slope model. Further, random intercept + random slope models demand large sample sizes in order to attain high levels of statistical power; this is not our case, as we only have six different sites sampled in eleven months.
Standardized regression coefficients (β) were obtained for covariates as a measure of the
sign and magnitude effects of predictor variables (i.e. analyses were carried out with standard-ized variables, such that their averages are zero and variances are one). For the random factor
“site”we estimated the proportion of variance accounted for in each model. Homoscedasticity
and normality of residuals of the General Linear Mixed Models were checked and did not devi-ate from the canonical assumptions.
Seven alternative models were compared with Akaike’s second-order AIC corrected for
small sample sizes (AICc) [46] to assess their weights of evidence. All these models included
the site, tadpole abundance and tadpole development as predictors, but varied according to the
inclusion of temperature covariates. Sixa priorimodels included the average minimum and
maximum temperatures estimated across six different periods of time; 2, 5, 10, 15, 22 and 30 days before tadpole sampling. The seventh model did not include any temperature measure-ment, to control against the influence of temperature in determining the population averaged
Bdloads of tadpoles (seeTable 1). The strength of evidence of models was obtained using
weights (Wi) derived from AICc figures, and their quotients were used to compare pairs of
models. Parameter estimates (β, proportion of variance accounted for by“site”and R2) were
averaged using model weights (Wi). Such a model-averaged estimator compares favorably in terms of bias and precision against a single estimator extracted from the single best model. Fi-nally, all possible subsets of the predictors using General Linear Mixed Models were estimated, considering each time span (2, 5, 10, 15, 22 and 30 days prior to tadpole sampling) and always
including the random factor“site”(76 models; to control for the fact that our true sample unit
was the population at each“site”).
The influence of phenology on the population averagedBdloads in tadpoles was tested by
means of a three-order polynomial for month (March-1, January-11) using the residuals of the
sevena priorimodels inTable 1. These post-hoc models attempt to quantify the magnitude of
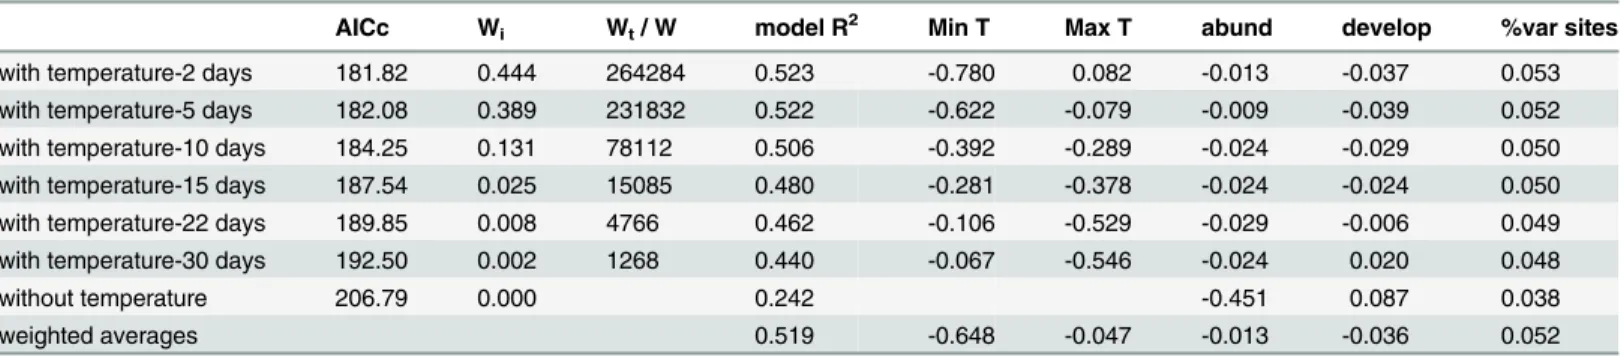
Table 1. Alternative models forBatrachochytrium dendrobatidisinfection loads (in logarithm) in six different sites.
AICc Wi Wt/ W model R2 Min T Max T abund develop %var sites
with temperature-2 days 181.82 0.444 264284 0.523 -0.780 0.082 -0.013 -0.037 0.053
with temperature-5 days 182.08 0.389 231832 0.522 -0.622 -0.079 -0.009 -0.039 0.052
with temperature-10 days 184.25 0.131 78112 0.506 -0.392 -0.289 -0.024 -0.029 0.050
with temperature-15 days 187.54 0.025 15085 0.480 -0.281 -0.378 -0.024 -0.024 0.050
with temperature-22 days 189.85 0.008 4766 0.462 -0.106 -0.529 -0.029 -0.006 0.049
with temperature-30 days 192.50 0.002 1268 0.440 -0.067 -0.546 -0.024 0.020 0.048
without temperature 206.79 0.000 0.242 -0.451 0.087 0.038
weighted averages 0.519 -0.648 -0.047 -0.013 -0.036 0.052
Thefirst six models include the average minimum and maximum water temperature (T) in six different time spans prior to tadpole sampling (i.e., two,five, ten, 15, 22 and 30 days), taking into account other three predictor terms: tadpole abundance (abund), tadpole development (develop) and site. Sample size is 66 (six sites x 11 months). AICc: AIC corrected for small sample sizes. Wi: model weights. Wt/ W: quotient of strength of evidence dividing the
weight (Wt) each model containing both maximum and minimum temperatures with the model without temperatures (W). Figures below Min T, Max T,
tadpole abundance and development are standardized regression coefficients (β) obtained in mixed general linear models (βvalues inform about the magnitude and sign of the partial relationships of the predictor variables). Weighted averages: multimodel inference of standardizedβregression coefficients considering the model weights Wi. The AICcfigure for the null model (i.e., not including any effect) is 208.04.
variance in population averagedBdloads that occur across the year, but are not related to tem-poral changes in temperature, tadpole abundance and tadpole development.
All the statistical analyses were carried out using STATISTICA 10 (StatSoft Inc, Tulsa, Oklahoma).
Results
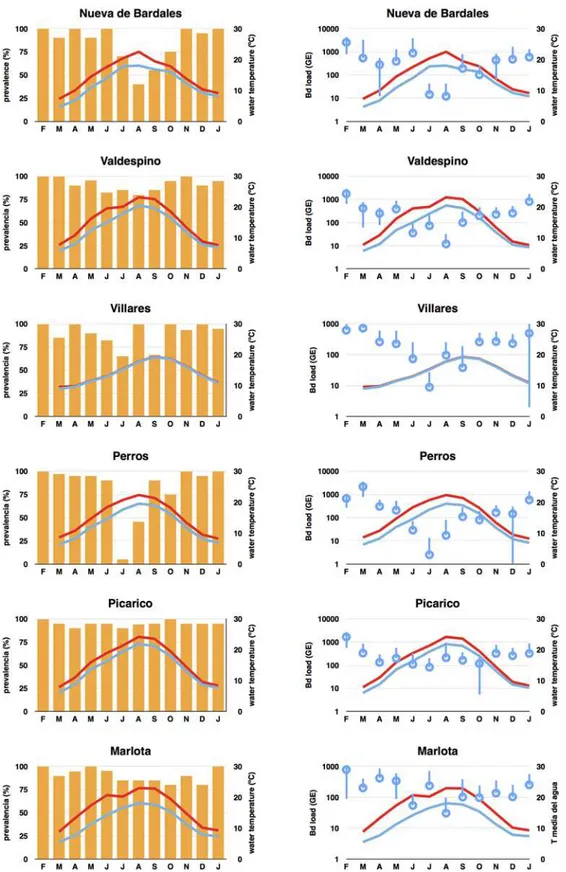
Seasonal changes in water temperature were very consistent across study sites (seeFig. 1), with
lower temperatures from January to March (around 8°C), and higher temperatures in late sum-mer (August and September; around 20°C). The lowest minimum water temperature registered was 1.2°C (March), while the highest recorded maximum water temperature was 25.4°C (September). Maximum differences among sites in average monthly temperatures were around 4°C, ranging from 2.0°C in April to 5.4°C in August; these differences among sites were very similar considering both the monthly minimum and maximum temperatures. Diurnal tempera-ture variations were on average 2.2°C across sites and throughout the study period, with highest recorded figures in June (3.5°C in average) and lowest figures in December and January (1.0°C).
For all sites, the prevalence ofBdinfection in tadpoles was highly variable, with an average
per site ranging from 5 to 100% (Fig. 1). Prevalence was strongly correlated with population
av-eragedBdloads, demonstrating a steep increase from zero to 100 zoospore equivalents, and a
nearly saturated prevalence above 200 zoospore equivalents. The relationship between these two variables approached linearity when prevalence was arcsin-transformed and zoospore
load was log-transformed. Thus, 54.4% of variation inBdprevalence across sites and
through-out months was explained by a model includingBdload and site (F6,59= 11.76, p<<0.001);
population averagedBdload accounted for 49.6% of variance inBdprevalence (F1,5= 31.47,
p = 0.002) while site accounted only for 2.7% of variance (F5,59= 0.70, p = 0.626). For this
rea-son, subsequent data analyses have been restricted to population averagedBdload for the sake
of brevity, considering the tight relationship betweenBdprevalence and load, the very high
prevalences measured, and according to the fact that prevalence did not reliably inform about
the high variation inBdload with prevalences greater than 75%.
Subsequent addition of minimum and maximum temperatures to models including tadpole abundance, tadpole development and site considerably increased the proportion of variance
explained by population averagedBdload, and the strength of evidence of models (Table 1).
The model lacking temperature had a strength of evidence many times (>1,000) lower than
the models including average minimum and maximum temperatures 2, 5, 10, 15, 22 and 30 days before tadpole sampling. Moreover, models including both temperatures five or two days
before sampling occurred had strengths of evidence>200,000 times higher than models not
including temperature.
The effect of temperature in explaining population averagedBdload diminished from the
short-term (i.e., two days before tadpole sampling) through to mid-term (i.e., 30 days before
sampling), shown by the increase in AICc values and the decrease in model weights inTable 1.
According to the quotient of model weights, considering average temperatures during the two days prior to tadpole sampling provided a model with a strength of evidence 222 times higher than the model that included average temperatures during the preceding 30 days.
Both minimum and maximum temperatures had a negative influence on population
aver-agedBdload, with the effect of minimum temperature (β= -0.648) being higher than that of
maximum temperature (β= -0.047; see standardized regression coefficients and their weighted
averages inTable 1). Thus, population averagedBdload decreased across sites and months as
temperature increased. Local tadpole abundance and development had a negligible influence
Fig 1. Prevalence and infection load ofBatrachochytrium dendrobatidis.Prevalence (left) and infection load (right; in logarithm scale, GE, mean +/- SE) for populations ofAlytes obstetricanstadpoles in six different sites throughout 12 months in each site. Monthly average minimum and maximum water temperature are shown in blue and red respectively.
The negative influence of average minimum temperature on population averagedBdload steadily decreased from very short time spans of two days to longer periods of 30 days (see Fig. 2for its influence in the time span of two days before tadpole sampling). The converse pat-tern was observed for the average maximum temperature, whose importance was higher
aver-aging data for 22 and 30 days prior to tadpole sampling (see alsoβcoefficients inTable 1).
The most parsimonious model, of all those possible, in explaining population averagedBd
load was one that included the average minimum temperature two days before tadpole
sam-pling and the factor“site”(AICc = 173.7; R2= 0.522; F6,59= 10.73, p<<0.001), with a strong
negative effect of minimum temperature (β= -0.696; F1,5= 25.46, p<0.001) and“site”
explain-ing a low amount of variance (5.1%; F5,59= 1.60, p = 0.174). A similarly parsimonious model
(AICc = 173.9; R2= 0.520; F6,59= 10.65, p<<0.001) included minimum temperature five days
before tadpole sampling (β= -0.694) and site as predictors (5.1% of variance). The first model,
including the average maximum temperature during 30 days before tadpole sampling, had a
considerably lower strength of evidence (AICc = 184.2; R2= 0.439; F6,59= 7.69, p<<0.001),
with temperature having a strong negative effect (β= -0.631; F1,5= 22.39, p<0.001) and“site”
explaining 4.9% of variance (F5,59= 1.19, p = 0.326).
The proportion of variability in population averagedBdload not accounted by the six a priori
models inTable 1including temperature (i.e., model residuals) was explained to a very low
ex-tent by sampling date (using a cubic polynomial of month: 0.8–2.2%; p>0.71 in the six models).
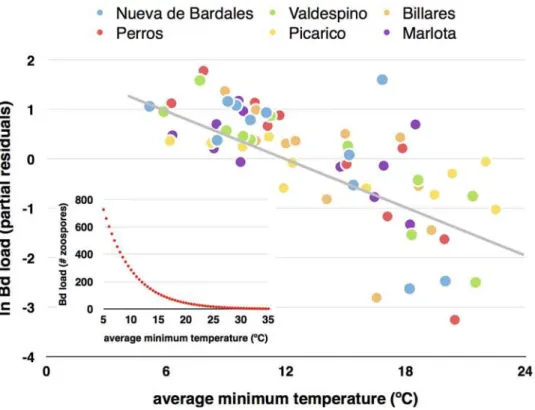
Fig 2. Average minimum water temperature and infection load ofBatrachochytrium dendrobatidis. Partial residual plot illustrating the influence of average minimum water temperature two days before tadpole sampling, onBatrachochytrium dendrobatidisinfection load (in logarithm) ofAlytes obstetricanstadpoles from six different sites. Sample size is 11 months for each site. The residual plot shows the relationship between minimum temperature andBdload given that the other two independent variables are also in the model (see with temperature-2 days inTable 1), therefore, partialling out their effects. The inner panel shows the modeled relationship betweenBdload (average number of zoospores per tadpole) and average minimum temperature two days before sampling.
In summary, temperature had an important role in determining the intensity of infections
byBd. Its effect was considerably more important when the average minimum temperature
2–5 days before tadpole sampling was taken into account, and the influence of average
mini-mum temperature on population averagedBdload was considerably higher than that recorded
for the average maximum temperature. Variability in population averagedBdload that could
be attributed to different localities was low, accounting for only 5% of the total variability. The
influence of tadpole abundance and tadpole development on population averagedBdloads was
nearly negligible and the proportion of variability in population averagedBdloads that was
ac-counted by sampling date was very low.
Discussion
Previous studies ofBd-infectedAlytes muletensistadpoles on the island of Mallorca showed
that the survival of infected populations was site specific, and that this owed to the role of
tem-perature in regulating the host/pathogen dynamic [20]. In our current study, we demonstrate
across a replicated set of mainlandA.obstetricansbreeding sites that temperature exerts a
simi-larly profound effect. This leads to pronounced seasonal cyclicity inBdloads, with the highest
burdens of infection seen during the colder months. In other ecosystems various factors such
as habitat type, density of the host, life history traits and virulence of the infecting strain ofBd
have also been argued as possible causes of this variation in host susceptibility [14,47,48].
Local weather conditions and their seasonal variation are known to have a large influence on
pathogen-host dynamics [22,39,42,48]. As seasonality is typically stronger in temperate
cli-mates, where numerous and serious cases of amphibian mass mortalities due to chytridiomy-cosis have been recorded, some authors have suggested that temperate zones are exposed to a
higher risk of outbreaks of chytridiomycosis [49]. This argument has some validity as
tempa-rate populations ofRana muscosaandR.sierra, which likeA.obstetricans, are highly
vulnera-ble to chytridiomycosis, show high mortality at high-altitudes [17,32]. However, in contrast to
our findings, these studies have shown no effect of seasonality on the intensity ofBdinfections.
This likely owes to the fact that in these montane areas of the USA researchers cannot sample amphibians in the winter months due to the presence of the snow cover; our sample sites fail to freeze in winter and we are able to sample throughout the year.
We witnessed increasing infection loads while temperature decreased,i.e. peaks of infection
in the winter. Many other authors have obtained similar results in the laboratory [38,50,51,
52] and also in the field, however studies have most often been undertaken in tropical areas, or
have not covered the entire seasonal variation in temperature [22,32,33,36,53,54]. Our study
corroborates these results in a temperate climate, by monitoring the infection on tadpoles monthly during a year in the field. The higher importance of minimum over maximum water temperature is easily understandable considering that maximum temperatures allow for the availability of lower temperatures throughout the day that are more favorable for the chytrid fungus.
We found that the effect of average minimum temperature was higher than that recorded for the maximum temperature during the same period of time. Although the range of averaged
maximum temperatures recorded during summer months (15.3–23.6°C) was within the
opti-mal range ofBdgrowth (17–25°C)[28], we observed the lowest infection loads across this
peri-od. We have previously used mathematical models and analysis of the temperature-dependent
expression ofBd-infected adultSilurana tropicalisimmune-related genes to show that
temper-ature, zoospore growth rates and immune-related clearance all interact to determineBdloads
[55]. While our current study is in focused on larval, rather than adult, stages, it is likely that a
temperature to determine the intensity of infections. During spring and autumn we saw similar
ranges of averaged maximum temperatures (9.8–20.7°C and 8.9–19.5°C, respectively) and also
similar infection intensity between these two seasons. While the range of temperatures during
winter (7.3–12.6°C) was outside of the optimal range forBd, we saw the highest infection loads
precisely in this season. This suggests a failure in the ability of the tadpoles to clear infection, rather than the effect of the pathogens growth alone. The increased susceptibility that we see is likely related to the poorer functioning of the immune system at temperatures below 10°C, a fact that has been strongly supported in a study of temperature-dependent immune inhibition inS.tropicalis[55]. However, far less is known about the temperature-dependency of immune function in larval amphibians and here we can only speculate that our findings may owe to temperature-dependent immune-inhibition, that may impact the adaptive and innate arms of the immune system including tadpole ability to synthesise antimicrobial peptides. That we see the greatest impact of temperature just before sampling episodes shows that these tempera-ture-related impacts on susceptibility are dynamic. However, further work is required to
disen-tangle the causal relationships between rates ofBdgrowth and tadpole immune-responses.
Partialling out the effects of the other variables, average minimum water temperature two days before sampling shows a strong negative relationship with the logarithm of average
popu-lationBdload (see the inner panel inFig. 2). The lower 95% confidence interval of the modeled
relationship makes the infection equal to zero zoospores when the average minimum tempera-ture is 25°C (a very similar relationship and temperatempera-ture cut-off point is obtained analyzing the time span of 5-days before tadpole sampling). Nevertheless, the minimum water
tempera-ture predicted for completely eliminatingBdinfection at the population level was 35°C.
There-fore, if minimum water temperature is higher than 25°C during two-five days beThere-fore, there is a very high probability that most, but not all, tadpoles lose the infection. This result matches
those previously found inA.obstetricansin Switzerland [56], and confirm the valid cut-off
point of ca. 30°C to completely eliminateBdinfection in the wild considering that above this
temperatureBdin culture begins to die [24,54].
We found that tadpole abundance and tadpole development exert a negligible effect onBd
infection and, in agreement with our findings, detailed studies ofR.muscosatadpoles [57] also
failed to find a significant relationship betweenBdpresence and larval stage. On the other hand,
some laboratory and field studies [58] indicate a clear influence of the density of infected
indi-viduals in the rates ofBdtransmission. Despite the fact that some of these studies considered
Bdprevalence while othersBdload, these contrasting results could be related to differences
among species in their intrinsic susceptibility to infection byBdand requires further study.
Determining the relationship between environmental variables across local scales and their relationship to pathogen growth, disease infection levels, and ultimately episodes of mass mor-tality, will allow us to improve our ability to model and predict the impacts of this infection across host populations. This will be useful, for example, in refining survey strategies by select-ing the periods with the highest burdens of infection and, therefore, reducselect-ing sample size re-quired without losing statistical power. Additionally, and more importantly, this knowledge will improve our ability to make evidence based management decisions to undertake disease mitigation attempts during the periods with the lowest burdens of infection. Ultimately, this will enhance the decision making process with regard to conservation measures that could en-hance the survival of endangered or threatened species.
Acknowledgments
CSIC and Banco Santander. S Fernández-Beaskoetxea was supported by Biodiversa project RACE: Risk Assessment of Chytridiomycosis to European Amphibian Biodiversity. MC Fisher was funded by the UK Natural Environmental Research Council NERC.
Author Contributions
Conceived and designed the experiments: JB SFB. Performed the experiments: SFB AFL JB. Analyzed the data: LMC SFB JB. Contributed reagents/materials/analysis tools: SFB JB LMC MCF AFL. Wrote the paper: SFB JB LMC MCF AFL.
References
1. Bjørnstad ON, Finkenstädt BF, Grenfell BT. Dynamics of measles epidemics: estimating scaling of
transmission rates using a time series sir model. Ecol Monogr. 2002; 72: 169–184.
2. Hosseini PR, Dhondt AA, Dobson A. Seasonality and wildlife disease: how seasonal birth, aggregation and variation in immunity affect the dynamics of Mycoplasma gallisepticum in house finches. Proc R Soc Lond B Biol Sci. 2004; 271: 2569–2577.
3. Lofgren E, Fefferman N, Naumov YN, Gorski J, Naumova EN. Influenza seasonality: underlying causes and modeling theories. J Virol. 2007; 81: 5429–5436. PMID:17182688
4. Duncan AB, Fellous S, Kaltz O. Temporal variation in temperature determines disease spread and maintenance in Paramecium microcosm populations. Proc R Soc Lond B Biol Sci. 2011; 278: 3412– 3420.
5. Waller P, Rudby-Martin L, Ljungstrom B, Rydzik A. The epidemiology of abomasal nematodes of sheep in Sweden, with particular reference to over-winter survival strategies. Vet Parasitol. 2004; 122: 207– 220. PMID:15219362
6. Cattadori IM, Boag B, Bjørnstad ON, Cornell SJ, Hudson PJ. Peak shift and epidemiology in a seasonal host—nematode system. Proc R Soc Lond B Biol Sci. 2005; 272: 1163–1169.
7. Laakkonen J, Henttonen H, Niemimaa J, Soveri T. Seasonal dynamics of Pneumocystis carinii in the field vole, Microtus agrestis, and in the common shrew, Sorex araneus, in Finland. Parasitology. 1999; 118: 1–5. PMID:10070655
8. Altizer S, Dobson A, Hosseini P, Hudson P, Pascual M, Rohani P. Seasonality and the dynamics of in-fectious diseases. Ecol Lett. 2006; 9: 467–484. PMID:16623732
9. White L, Waris M, Cane P, Nokes D, Medley G. The transmission dynamics of groups A and B human respiratory syncytial virus (hRSV) in England & Wales and Finland: seasonality and cross-protection. Epidemiol Infect. 2005; 133: 279–289. PMID:15816153
10. Cheng AC, Cheng SA, Chen YY, Chen JC. Effects of temperature change on the innate cellular and hu-moral immune responses of orange-spotted grouper Epinephelus coioides and its susceptibility to Vib-rio alginolyticus. Fish Shellfish Immunol. 2009; 26: 768–772. doi:10.1016/j.fsi.2009.03.011PMID:
19332138
11. Altizer SM, Hochachka WM, Dhondt AA. Seasonal dynamics of mycoplasmal conjunctivitis in eastern North American house finches. J Anim Ecol. 2004; 73: 309–322.
12. Tamerius JD, Comrie AC. Coccidioidomycosis incidence in Arizona predicted by seasonal precipita-tion. PLoS One. 2011; 6: e21009. doi:10.1371/journal.pone.0021009PMID:21701590
13. Stuart SN, Chanson JS, Cox NA, Young BE, Rodrigues ASL, Fischman DL et al. Status and trends of amphibian declines and extinctions worldwide. Science. 2004; 306: 1783–1786. PMID:15486254
14. Olson DH, Aanensen DM, Ronnenberg KL, Powell CI, Walker SF, Bielby J, et al. Mapping the global emergence of Batrachochytrium dendrobatidis, the amphibian chytrid fungus. PLoS ONE. 2013; 8: e56802. doi:10.1371/journal.pone.0056802PMID:23463502
15. Tobler U, Borgula A, Schmidt BR. Populations of a susceptible amphibian species can grow despite the presence of a pathogenic chytrid fungus. PLoS ONE. 2012; 7: e34667. doi:10.1371/journal.pone. 0034667PMID:22496836
16. Briggs CJ, Vredenburg VT, Knapp RA, Rachowicz LJ. Investigating the population-level effects of chy-tridiomycosis: an emerging infectious disease of amphibians. Ecology. 2005; 86: 3149–3159.
17. Briggs CJ, Knapp RA, Vredenburg VT. Enzootic and epizootic dynamics of the chytrid fungus pathogen of amphibians. Proc Natl Acad Sci USA. 2010; 107: 9695–9700. doi:10.1073/pnas.0912886107PMID:
20457916
19. Harris RN, Brucker RM, Walke JB, Becker MH, Schwantes CR, Flaherty DC, et al. Skin microbes on frogs prevent morbidity and mortality caused by a lethal skin fungus. ISME. 2009; 3: 818–24. doi:10. 1038/ismej.2009.27PMID:19322245
20. Doddington BJ, Bosch J, Oliver JA, Grassly NC, García G, Schmidt BR, et al. Context-dependent am-phibian host population response to an invading pathogen. Ecology. 2013; 98: 1795–1804.
21. Schmeller DS, Blooi M, Martel A, Garner TWJ, Fisher MC, Azemar F, et al. Microscopic aquatic preda-tors strongly affect infection dynamics of a globally emerged pathogen. Curr Biol. 2014; 24: 176–180. doi:10.1016/j.cub.2013.11.032PMID:24374305
22. Savage AE, Sredl MJ, Zamudio KR (2011) Disease dynamics vary spatially and temporally in a North American amphibian. Biol Conserv 144: 1910–1915.
23. Bosch J, Martinez-Solano I, Garcia-Paris M. Evidence of a chytrid fungus infection involved in the de-cline of the common midwife toad (Alytes obstetricans) in protected areas of central Spain. Biol Con-serv. 2001; 97: 331–337.
24. Rachowicz LJ, Knapp RA, Morgan JAT, Stice MJ, Vredenburg VT, Parker JM, et al. Emerging infec-tious disease as a proximate cause of amphibian mass mortality. Ecology. 2006; 87: 1671–1683. PMID:16922318
25. Walker SF, Bosch J, Gomez V, Garner TWJ, Cunningham AA, Schmeller DS, et al. Factors driving pathogenicity versus prevalence of the amphibian pathogen Batrachochytrium dendrobatidis and chy-tridiomycosis in Iberia. Ecol Lett. 2010; 13: 372–382. doi:10.1111/j.1461-0248.2009.01434.xPMID:
20132274
26. Sparrow FK. Ecology of freshwater fungi. In: Gainsworth GC, Sussman AS, editors. The fungi Vol 3. New York: Academic Press; 1968.
27. Longcore JE, Pessier AP, Nichols DK. Batrachochytrium dendrobatidis gen. et sp. nov., a chytrid patho-genic to amphibians. Mycologia. 1999, 91: 219–227.
28. Piotrowski JS, Annis SL, Longcore JE. Physiology of Batrachochytrium dendrobatidis, a chytrid patho-gen of amphibians. Mycologia. 2004; 96: 9–15. PMID:21148822
29. Johnson M, Berger L, Phillips L, Speare R. Fungicidal effects of chemical disinfectants, UV light, desic-cation and heat on the amphibian chytrid, Batrachochytrium dendrobatidis. Dis Aquat Organ. 2003; 57: 255–260. PMID:14960039
30. Drew A, Allen EJ, Allen LJS. Analysis of climatic and geographic factors affecting the presence of chy-tridiomycosis in Australia. Dis Aquat Organ. 2006; 68: 245–250. PMID:16610590
31. Bosch J, Carrascal LM, Durán L, Walker S, Fisher MC. Climate change and outbreaks of amphibian chytridiomycosis in a montane area of Central Spain; is there a link? Proc R Soc Lond B Biol Sci. 2007; 274: 253–260.
32. Knapp RA, Briggs CJ, Smith TC, Maurer JR. Nowhere to hide: impact of a temperature-sensitive am-phibian pathogen along an elevation gradient in the temperate zone. Ecosphere. 2011; 2: art93. 33. Retallick R, Mccallum H, Speare R. Endemic infection of the amphibian chytrid fungus in a frog
commu-nity post-decline. PLoS Biology. 2004; 2: 1–7.
34. Kriger KM, Hero JM. Survivorship in wild frogs infected with chytridiomycosis. EcoHealth. 2006; 3: 171–177.
35. Phillott AD, Grogan LF, Cashins SD, Mcdonald KR, Berger L, Skerratt LF. Chytridiomycosis and sea-sonal mortality of tropical stream-associated frogs 15 years after introduction of Batrachochytrium den-drobatidis. Conserv Biol. 2013; 27: 1058–1068. doi:10.1111/cobi.12073PMID:23678872
36. Bradley GA, Rosen PC, Sredl MJ, Jones TR, Longcore JE. Chytridiomycosis in native Arizona frogs. J Wildl Dis. 2010; 38: 206–212.
37. Ouellet M, Mikaelian I, Pauli BD, Rodrigue J, Green DM. Historical evidence for widespread chytrid in-fection in North American amphibian populations. Conserv Biol. 2005; 19: 1431–1440.
38. Andre SE, Parker SJ, Briggs CJ. Effect of temperature on host response to Batrachochytrium dendro-batidis infection in the mountain yellow-legged frog (Rana muscosa). J Wildl Dis. 2008; 44: 716–20. PMID:18689660
39. Longo AV, Burrowes PA, Joglar RL. Seasonality of Batrachochytrium dendrobatidis infection in direct-developing frogs suggests a mechanism for persistence. Dis Aquat Organ. 2010; 92: 2–3.
40. Voordouw M, Adama D, Houston B, Govindarajulu P, Robinson J. Prevalence of the pathogenic chytrid fungus, Batrachochytrium dendrobatidis, in an endangered population of northern leopard frogs, Rana pipiens. BMC Ecology. 2010; 10: 6. doi:10.1186/1472-6785-10-6PMID:20202208
42. Murray KA, Skerratt LF, Garland S, Kriticos D, Mccallum H. Whether the weather drives patterns of en-demic amphibian chytridiomycosis. A pathogen proliferation approach. PLoS ONE. 2013; 8: e61061. doi:10.1371/journal.pone.0061061PMID:23613783
43. Voyles J, Young S, Berger L, Campbell C, Voyles WF, Dinudom A, et al. Pathogenesis of chytridiomy-cosis, a cause of catastrophic amphibian declines. Science. 2009; 326: 582–585. doi:10.1126/science. 1176765PMID:19900897
44. Gosner KL. A simplified table for staging anuran embryos and larvae with notes on identification. Herpe-tologica. 1960; 16: 183–190.
45. Boyle DGD, Boyle DBD, Olsen VV, Morgan JATJ, Hyatt ADA. Rapid quantitative detection of chytridio-mycosis (Batrachochytrium dendrobatidis) in amphibian samples using real-time Taqman PCR assay. Dis Aquat Organ. 2004; 60: 141–148. PMID:15460858
46. Burnham KP, Anderson DR. Model selection and multimodel inference: a practical information-theoretic approach. New York: Springer-Verlag; 2003.
47. Woodhams DC, Alford RA, Briggs CJ, Johnson M, Rollins-Smith LA. Life-history trade-offs influence disease in changing climates: strategies of an amphibian pathogen. Ecology. 2008; 89: 1627–1639. PMID:18589527
48. Fisher MC, Garner TWJ, Walker SF. Global Emergence of Batrachochytrium dendrobatidisand am-phibian chytridiomycosis in space, time, and host. Annu Rev Microbiol. 2009; 63: 291–310. doi:10. 1146/annurev.micro.091208.073435PMID:19575560
49. Hof C, Araújo MB, Jetz W, Rahbek C. Additive threats from pathogens, climate and land-use change for global amphibian diversity. Nature. 2011; 480: 516–519. doi:10.1038/nature10650PMID:
22089134
50. Berger L, Speare R, Hines HB, Marantelli G, Hyatt AD, McDonald KR, et al. Effect of season and tem-perature on mortality in amphibians due to chytridiomycosis. Aust Vet J. 2004; 82: 434–439. PMID:
15354853
51. Bustamante HM, Livo LJ, Carey C. Effects of temperature and hydric environment on survival of the Panamanian golden frog infected with a pathogenic chytrid fungus. Integr Zool. 2010; 5: 143–153. doi:
10.1111/j.1749-4877.2010.00197.xPMID:21392332
52. Murphy PJ, St-Hilaire S, Corn PS. Temperature, hydric environment, and prior pathogen exposure alter the experimental severity of chytridiomycosis in boreal toads. Dis Aquat Organ. 2011; 95: 31–42. doi:
10.3354/dao02336PMID:21797033
53. Kriger KM, Ashton KJ, Hines HB, Hero JM. On the biological relevance of a single 20 Batrachochytrium dendrobatidis zoospore: a reply to Smith. Dis Aquat Org. 2007; 73: 257–260. PMID:17330746
54. Forrest MJ, Schlaepfer MA. Nothing a hot bath won't cure: infection rates of amphibian chytrid fungus correlate negatively with water temperature under natural field settings. PLoS ONE. 2011; 6: e28444. doi:10.1371/journal.pone.0028444PMID:22205950
55. Ribas L, Ming-Shi LI, Doddington BJ, Robert J, Seidel JA, Simon Kroll J, et al. Expression profiling the temperature-dependent amphibian response to infection by Batrachochytrium dendrobatidis. PLoS ONE. 2009; 4: e8408. doi:10.1371/journal.pone.0008408PMID:20027316
56. Geiger CC, Küpfer E, Schär S, Wolf S, Schmidt BR. Elevated temperature clears chytrid fungus infec-tions from tadpoles of the midwife toad,Alytes obstetricans. Amphibia-Reptilia. 2011; 32: 276–280. 57. Knapp RA, Morgan JAT. Tadpole mouthpart depigmentation as an accurate indicator of
chytridiomyco-sis, an emerging disease of amphibians. Copeia. 2006;188–197.