Irreversible Collective Migration of
Cyanobacteria in Eutrophic Conditions
Julien Dervaux1*, Annick Mejean1, Philippe Brunet2
1Laboratoire Interdisciplinaire des Energies de Demain, Université Denis Diderot, Paris, France, 2Laboratoire Matière et Systèmes Complexes, Université Denis Diderot, Paris, France
*dervauxjulien@wanadoo.fr
Abstract
In response to natural or anthropocentric pollutions coupled to global climate changes, mi-croorganisms from aquatic environments can suddenly accumulate on water surface. These dense suspensions, known as blooms, are harmful to ecosystems and significantly degrade the quality of water resources. In order to determine the physico-chemical parame-ters involved in their formation and quantitatively predict their appearance, we successfully reproduced irreversible cyanobacterial blooms in vitro. By combining chemical, biochemical and hydrodynamic evidences, we identify a mechanism, unrelated to the presence of inter-nal gas vesicles, allowing the sudden collective upward migration in test tubes of several cyanobacterial strains (Microcystis aeruginosaPCC 7005,Microcystis aeruginosaPCC 7806 andSynechocystis sp. PCC 6803). The final state consists in a foamy layer of bio-mass at the air-liquid interface, in which micro-organisms remain alive for weeks, the medi-um lying below being almost completely depleted of cyanobacteria. These "laboratory blooms" start with the aggregation of cells at high ionic force in cyanobacterial strains that produce anionic extracellular polymeric substances (EPS). Under appropriate conditions of nutrients and light intensity, the high photosynthetic activity within cell clusters leads the dis-solved oxygen (DO) to supersaturate and to nucleate into bubbles. Trapped within the EPS, these bubbles grow until their buoyancy pulls the biomass towards the free surface. By in-vestigating a wide range of spatially homogeneous environmental conditions (illumination, salinity, cell and nutrient concentration) we identify species-dependent thresholds and time-scales for bloom formation. We conclude on the relevance of such results for cyanobacterial bloom formation in the environment and we propose an efficient method for biomass har-vesting in bioreactors.
Introduction
Within the last 60 years, in part following the development of modern agriculture and its coun-terpart in the massive use of soil fertilizers, seasonal blooms of aquatic photosynthetic microor-ganisms have become commonplace in quiet rivers, lakes, fishponds and even the open ocean [1–3]. During a bloom, the phytoplankton density near the surface of the water column OPEN ACCESS
Citation:Dervaux J, Mejean A, Brunet P (2015) Irreversible Collective Migration of Cyanobacteria in Eutrophic Conditions. PLoS ONE 10(3): e0120906. doi:10.1371/journal.pone.0120906
Academic Editor:Franck Chauvat, CEA-Saclay, FRANCE
Received:November 6, 2014
Accepted:January 28, 2015
Published:March 23, 2015
Copyright:© 2015 Dervaux et al. This is an open access article distributed under the terms of the
Creative Commons Attribution License, which permits unrestricted use, distribution, and reproduction in any medium, provided the original author and source are credited.
Data Availability Statement:All relevant data are within the paper and its Supporting Information files.
Funding:This project is funded by the program Emergence(s) of the City of Paris. The funders had no role in study design, data collection and analysis, decision to publish, or preparation of the manuscript.
increases by several orders of magnitude within timescale of days from less than 102−103cell/ ml up to 105−109cell/ml and sometimes culminates into a thick superficial foam [4]. These episodes of massive biomass accumulation involve various species like micro-algae, cyanobac-teria or protists [5] and multiple evidences [2,6–12] suggest that the ability to bloom provides
several competitive advantages over non-blooming organisms (access to light and CO2,
avoid-ance of grazing and ability to counter light mixing). Still, blooms are harmful upon various as-pects: they shadow sunlight to plants and other micro-organisms, some species release powerful toxins that are harmful to humans, mammals as well as various marine species [13,
14] and biomass decay ultimately leads to oxygen rarefaction or even depletion (anoxia) that can stress or asphyxiate fishes, shellfishes or invertebrates [15].
From numerous environmental monitoring, it is now well established that blooms are corre-lated with a combination of intense sunlight, high water temperatures, eutrophic conditions and gentle stream flows [16,17]. They are often observed during late spring or summer, near agricultural regions where nitrate or phosphate-based fertilizers are carried by water runoffs and give micro-organisms a sudden growth boost. However, because the characteristic time-scale of blooms (about 1 day) is not compatible with cell proliferation alone (cell division times range from 10h in optimal laboratory conditions to a few days for most bloom-associated spe-cies [4]), the sudden increase of the biomass concentration within the epilimnion (the superfi-cial water) is likely to result from an interplay between long-term multiplication of cells and the collective migration of the biomass. In many situations, this migration culminates in the ir-reversible formation of a thick scum at the surface of water. While it has been clearly estab-lished that buoyancy regulation through the synthesis of gas vesicles and carbohydrate ballast is a key factor involved in the massive migration of the biomass [18–22], several non-vacuolate
cyanobacterial species from various genera, such asSynechococcusspp.,Aphanothecespp, as well as other species [23], are nonetheless able to form blooms. This suggests that one or several other mechanisms are likely to contribute to the process of bloom formation. In addition, it is still unclear how a dense suspension of micro-organisms, as formed by the collective upward migration of the biomass, can further evolve into the robust compact scum which is responsible for the most harmful effects associated with blooms.
Therefore, the dynamics of the migration process should be precisely recorded in order to better understand the blooming mechanism. In the seek for accurate predictions of their for-mation, laboratory studies can provide a valuable complement to field observations. However, because the spatiotemporal monitoring of micro-organisms concentration during bloom for-mation is challenging, only few laboratory experiments have been performed so far [24,25] and the accurate measurement of local density of micro-organisms remains to be achieved. The approach followed in the present paper is to investigate quantitatively to what extent such thick scum can irreversibly form out of a collective migration and agglomeration, from well-controlled initial conditions compatible with environmental ones. Therefore, we mainly focus on the last stages of this scum formation. By carrying out systematic milliliter-scale ex-periments in test tubes, we investigate a range of environmental conditions (initial concentra-tion of microorganisms, light intensity, salinity, nutrients chemical composiconcentra-tion and
concentration) and we identify those leading to an irreversible migration toward the surface in cultures of the cyanobacteriaMicrocystis aeruginosaPCC 7005. Indeed, members of the Micro-cystisgenus are frequently detected in blooms appearing in rivers and freshwater lakes [5,26,
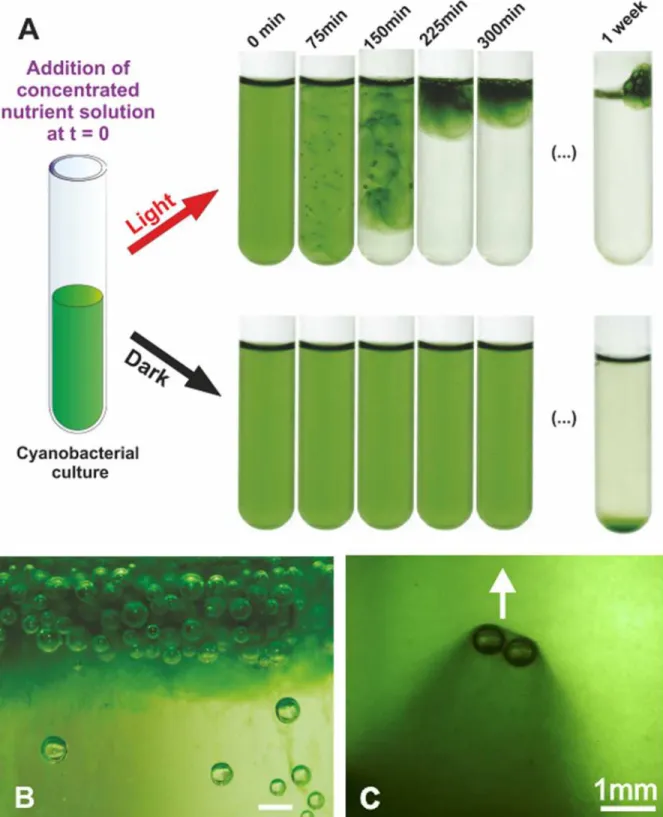
Fig 1.M. aeruginosabloom in a test tube.A: Upward migration of the whole biomass following the addition of nutrients, inducing the irreversible formation of a scum stable over weeks, withM. aeruginosaPCC 7005. The initial OD580of the cyanobacterial culture is 0.66. This blooming is not observed in
darkness. See text for more details. B: Close up view of the topmost foamy layer, the scale bar is 1mm C: Trail of dense biomass around rising bubbles. The arrow indicates the direction of bubble migration.
extensive dataset within situoxygen measurements, EPS concentration and surface charge quantification, rheology experiments and microscopic observations, we rule out the influence of gas vesicles on this process and evidence the coupled roles of photosynthetically-produced oxygen accumulation and anionic EPS-mediated cell aggregation following salt addition on blooming. The mechanism of collective upward biomass migration identified here relies on the trapping of oxygen bubbles within cell clusters that provide a buoyant lift to the biomass and can occur within timescales as short as 30 minutes.
Materials and Methods
Strains and culture conditions
Strains used in this study areMicrocystis aeruginosaPCC 7005,Microcystis aeruginosaPCC 7806,Synechocystis sp.PCC 6803. All strains were grown in BG11 (1X) medium, with trace metal solution, under a 14h/10h light cycle (6μE.m−2.s−1) at 25°C. The composition of the
BG11 medium (1X) is as follow: CaCl2.2H2O (36.7mg/L), citric acid (5.6 mg/L), K2HPO4
(31.4mg/L), Na2Mg.EDTA (1mg/L), C6H8FeNO7(6mg/L), MgSO4(36mg/L), Na2CO3(20mg/
L), NaNO3(1500mg/L). The trace metal solution is composed of: H3BO3(2860 mg/L),
MnCl2—4H2O (1810 mg/L), ZnSO4—7 H2O (222 mg/L), Na2MoO4—2 H2O (390 mg/L),
CuSO4- 5 H2O (79 mg/L), Co(NO3)2-6H2O (49 mg/L).
Biomass measurement
Optical density measurements were performed at 580 nm [30,31] on a Novaspec II spectro-photometer (Amersham Pharmacia Biotech Inc, UK) using a cuvette with a 1cm light path. Cell counting was performed with a Malassez cell on an inverted microscope and gave a con-centration of 2107cell/ml at an optical density OD580= 1. Using an average cell diameter of
5μm, this corresponds to a volume fraction of*10−3.
Sample preparation for bloom formation
All experiments were performed at 25°C. For the determination of the salt thresholds, aliquots from culture in the late exponential phase (OD580*2) were diluted to a final concentration of
OD580= 0.35. The influence of the gas vesicles on blooming—using ultrasonic waves to make
them collapsing—was tested on aliquots from cultures in middle and late exponential phases
(OD580of 1 and 2) which were diluted to a final concentration of OD580= 0.35. Sonication was
conducted in a water bath sonicator at 25kHz for 5 minutes. In all experiment the pH of the bacterial suspension was comprised between 7.0 and 8.0. The light and nutrient concentrations for each experiments are specified in the main text. In all experiments, the light source (a large LED pannel) was located on the side of the test tubes and provided a highly
homogeneous lightning.
Oxygen measurements
Imaging techniques
Images were acquired with a Nikon D90 equipped with a Makro-Planar 2/50 ZF Zeiss objective except panel B ofFig. 1(taken with a Tokina Macro 100 F2.8 D equipped with an extension tube) and panel C ofFig. 1(taken with a Navitar objective). Microscopic images in panels A and B ofFig. 3were acquired with a Olympus IX3 inverted microscope coupled to a Qimaging Optimos sCMOS camera.Fig. 3-Dwas acquired with a Leica MZ16 microscope.
Rheology measurements
Rheology measurements were performed on a controlled shear stress rheometer (Anton-Paar Physica MCR500) in a cone and plate geometry with a 52μm gap. The samples were kept at 23.00°C during data acquisition. For the viscosity evolution experiments, rheology measure-ments were made on samples prepared as follow: 50μl of concentrated BG11 solution (100X) were added to 1 ml of a sample from a culture in the late exponentially phase (OD580= 2.4) in
an Eppendorf tube and inverted upside-down three times. The tubes were then placed under a 13μE.m−2.s−1light. At intervals of 5 minutes, the content of the tubes was gently poured onto the rheometer plate and the viscosity was measured at a shear rate of 310−2s−1.The
measure-ments were performed three time and the error bar is the standard deviation between the three runs.
EPS extraction and quantification
EPS were extracted mostly like in [31,32]. A sample of 30 ml of a stationary phase culture (OD580*4) was split in two volumes and blooming was triggered by adding 1.5ml of
concen-trated BG11 solution (100X) in one of the samples. Both samples were then placed under light (14μE.m−2.s−1) for 90 minutes. The samples were then placed for 90s in a water bath sonicator
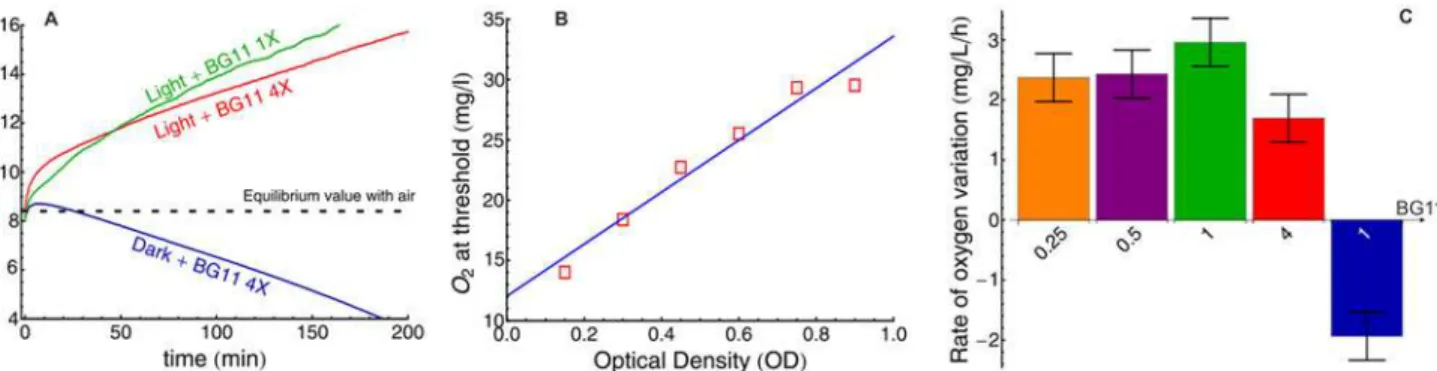
at intermediate power (25kHz) to separate cells from loosely bound EPS. The samples were then centrifuged at 10000gfor 30 minutes at room temperature. The supernatant was separated from the cells and the centrifugation step was repeated twice. Following centrifugation, the cell pellets were resuspended in BG11 medium (1X) and the supernatant of the three runs were added. Then, the supernatants were filtered (using a paper filter of typical pore size 0.45μm) and stored overnight at -20°C with two volumes of chilled ethanol to precipitate the EPS. The two tubes of precipitated EPS were then washed with 95% ethanol, dried under air and Fig 2. Oxygen bubbles lift the biomass during bloom formation.A: O2production following BG11 addition to cultures ofM. aeruginosaPCC7005 (final
OD580= 0.35). B: Dissolved Oxygen (DO) concentration at the threshold of bloom formation as a function of initial optical density, evidencing that the lifting
force is mainly due to these bubbles. The threshold was defined as the time at which the veil at the bottom of the biomass is located 5 mm above the bottom of the test tube. When the threshold was reached, the sample was carefully diluted in BG11 (1X) and placed in the dark to measure the DO concentration. C: Rate of O2production (OD580 = 0.35) for various BG11 concentration (values at the foot of each bar) in the light or in the dark (right bar in blue).
resuspended in 500μL of ultra-pure water (UPW) each. The protein and carbohydrate contents of the EPS were quantified respectively with a Bradford assay using BSA as a reference and with a phenolsulfuric assay using glucose as a reference. Zeta potentials of purified EPS were measured with a zetasizer nano ZS (Malvern, UK). We found a zeta potential of−23±6mV that was neutralized upon BG11 addition. Experiments were performed in triplicate and error bars are standard deviations between the three runs.
Results
A sudden increase in salts concentration triggers blooming
Cultures of the non-toxic cyanobacterial strainM. aeruginosaPCC 7005 were grown in stan-dard mineral medium (BG11+Trace Metals) until they reached an optical density at 580nm (OD580) of 2 (i.e.*4.107cell/ml). Aliquots of the culture were then re-suspended in
concen-trated BG11 medium (*4 times the concentration of the initial culture) to a final OD580of
0.66 in 5ml test tubes. The tubes were placed either in complete darkness or under
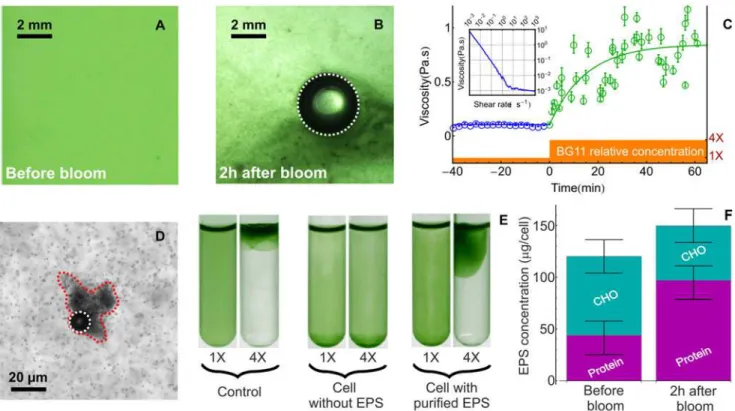
Fig 3. Aggregation of the biomass during a bloom.A-B: Microscopic details of the microstructure before (A) and following (B) BG11 addition (final relative concentration of 4X) to a cyanobacterial culture ofM. aeruginosa(final OD580= 0.5). C: Time evolution of the viscosity of a cyanobacterial culture before
(black circles) and after (green circles) nutrient addition. We first measured the viscosity of a concentrated culture (OD580*2.4) as a function of the shear rate (see Inset). The bacterial suspension exhibits a shear-thinning behavior in the range 10−3to 1 s−1where the viscosity falls by 3 orders of magnitude. The
apparent divergence of viscosity at low shear is the signature of a yield stress behavior and this can be ascribed to the interactions between EPS, bacterial cells and ions. After a crossover regime (1 to 10 s−1) the viscosity becomes independent of the shear rate in the range 10 to 103s−1and saturate at 1.1±0.1
mPa.s. In this high-shear limit, the viscosity is very close to that of water as expected for a dilute (volume fraction around 210−3) suspension of weakly motile
bacteria. D: A bubble trapped in a cluster of cells (surrounded by a red dashed line) at high magnification. The contours of growing bubbles in B and D have been highlighted by white dashed lines. E: Cells were separated from their EPS using sonication and centrifugation. Without EPS,“naked”M. aeruginosa cells failed to form a bloom. When the“naked”cells were supplemented with the purified EPS, the ability to form a bloom was restored. Pictures were taken 180 minutes following BG11 addition. In the experiment with naked cells supplemented with purified EPS, the threshold for bloom formation remained identical to that of untreated cells (i.e with their EPS). F: Chemical composition of the EPS before and after blooming.
homogeneous lighting (intensity 13μE.m−2.s−1) and imaged using a digital camera during 6 hours.Fig. 1illustrates the typical time evolution of the system. While the culture kept in dark-ness remained homogeneous for the duration of the experiment, we observed a massive migra-tion of the biomass towards the free surface in the sample exposed to light.
This migration started with the nucleation of gas bubbles inside the culture tube which be-come visible roughly 60 minutes after the beginning of the experiment. Gentle shaking of the tubes revealed that bubbles were not stuck to the walls of the tubes but rather localized inside the bulk of the liquid, suggesting that they were somehow trapped by the biomass. These bub-bles kept growing until they reached sizes of order of a millimeter (after roughly 150 minutes), at which point they started to rise, pulling the biomass upward with them. Trails of dense green biomass could be observed around and below rising bubbles (Fig. 1-C). In addition, a sharp boundary delimited the bottom of the rising biomass, below which the culture liquid was transparent (Fig. 1-A). The system stopped evolving after 300 minutes. We measured the opti-cal density of the lower fraction after 300 minutes and found it to be 0.03 such that, in the final state, more than 95% of the entire biomass was located at the free surface. In a control tube (no BG11 added), the OD580was measured at 0.73 after 300 min so that the relative increase in
bio-mass that occurred during the experiments was 11%. Because no bloom is formed when bacte-ria are resuspended in dilute nutrient solution, we then asked what was the minimum BG11 concentration necessary to induce the migration of the biomass. At an OD580of 0.35 and
under*14μE.m−2.s−1, blooming occurred at a relative BG11 concentration of*4Xand
above (S1 Fig). Remarkably, the cyanobacteria did not re-colonize the remaining part of the tube and stayed localized in the bacterial foam formed at the surface (Fig. 1-B), even after one week. In the sample placed in darkness, sedimentation occurred but on a much longer time-scale (one week). This slow sedimentation is consistent with the absence of gas vesiclede novo
synthesis after a prolonged exposure to darkness [18,19,33].
Trapped oxygen bubbles lift the biomass
BecauseM. aeruginosahas the ability to regulate its buoyancy using internal gas vesicles, we first tested whether this mechanism was contributing to the irreversible migration described above by collapsing the vesicles by sonication (seeMaterialssection andS2 Fig). In a control tube (no concentrated BG11 added), sonicated cyanobacterial cells had completely sedimented after 300 minutes, therefore ensuring that i) the vesicles were indeed collapsed by the sonica-tion treatment and ii) the cyanobacteria could not synthesize enough new vesicles to counter sedimentation over this timescale, in agreement with previous studies [18]. In another sample sonicated identically, but with BG11 added, blooming occurred nonetheless and the biomass was entirely concentrated at the free surface after 300 minutes. Furthermore, we compared the biomass migration with and without previous sonication, for samples with BG11 added, and no differences were observed between the two samples. From this assay, we concluded that the blooming mechanism identified here does not rely on the presence of gas vesicles.
bacteria in fresh concentrated medium. In the dark, DO concentration stopped increasing within 5 minutes of the light extinction and then decayed below the equilibrium value of 8.3 mg/L and until oxygen was completely depleted, thereby indicating active aerobic respiration. On the other hand, when the culture was exposed to light, the DO concentration increased lin-early, at a rate of*2mg/L/h, until it reached the detection limit of the DO probe (16 mg/L),
roughly 200 min after the beginning of the experiment.
Since DO was present at concentrations well above the saturation value, we concluded that the nucleation of O2bubbles that could lift the biomass was thermodynamically favored. To
check whether O2bubbles were indeed responsible for the biomass migration, we thus
investi-gated the relationship between DO concentration and total biomass at the threshold of bloom formation. If O2is responsible for the vertical migration of the cyanobacteria, we expect its
concentration to be proportional to the total weight of this biomass at the onset of bloom for-mation. As seen inFig. 2-B, there is indeed a very good correlation (P-value<10−3) between
these quantities. Furthermore, when a sample was first placed in darkness for 12 hours follow-ing the addition of the concentrated BG11 solution to brfollow-ing the DO to 0 mg/L, it took a much longer time (*8 hrs) before bloom formation occurred, further strengthening the evidence
that O2bubbles lift the biomass. In addition, the DO concentration at threshold was similar to
that obtained without keeping the sample in darkness at first. We then questioned whether the sudden increase in nutrient was leading to an increase of the oxygen production rate on the time scale of the experiment and/or was only responsible for the trapping of the O2produced
by the photosynthetic activity of the bacteria. We therefore measured the rate of DO variation at various BG11 concentrations. Within the range of BG11 concentrations we investigated (0.25X to 4X), no significant variations in the DO production rate was observed (average value 2.4±0.4 mg/L/h for a culture at OD580= 0.35). In darkness, the rate of O2uptake was measured
at 1.9±0.4 mg/L/h.
Aggregation of the biomass leads to bubble trapping in the bulk
Since the sudden addition of nutrient had no significant effect on oxygen production on the timescale of the experiment, we were led to the conclusion that the increase in BG11 concentra-tion was essentially responsible for providing bubble nucleaconcentra-tion site within the biomass. A mi-croscopic inspection of the cyanobacterial culture before (Fig. 3-A) and after (Fig. 3-B and D) the addition of the concentrated nutrients revealed that oxygen bubbles were indeed trapped in large aggregates of cell. Furthermore, while cells within clusters were physically linked, as could be seen by gently moving the bubble, they were not necessarily in contact, suggesting that cell to cell binding must be mediated by extracellular components such as EPS. In order to quantify the extent and dynamics of this aggregation, we monitored the rheological properties of the cyanobacterial culture over time as a proxy for the evolution of the biomass microstructure. The data shown inFig. 3-Cindicate that the low-shear viscosity was constant around*0.1Pa.
s before nutrient addition. Following the sudden addition of BG11, the viscosity increased roughly by an order of magnitude. Fitting the data with a simple exponential yielded a charac-teristic timescale of 15min for the aggregation dynamic. Given the typical metabolic timescales ofM. aeruginosa(doubling time*50 hours), this timescale is not compatible with the
constant at*130 ± 30pg.cell−1. Although the moderate increase of the EPS (*25%) is within
the error bar of the measurement, it could also be partly caused by a regulation of the transcrip-tion processes and the productranscrip-tion of the EPS by metallic catranscrip-tions, as observed in other cyano-bacterial species [34].
Anionic EPS-cations interactions trigger biomass flocculation
In order to further pinpoint the mechanisms leading to the aggregation and blooming of the biomass, we individually tested the effect of the various components of the BG11 nutritive me-dium. It clearly appeared that sodium nitrate could induce bloom formation although at a slightly higher threshold than when NaNO3was dispensed with the other components of the
BG11 medium. This reveals a synergistic effect between the various salts present in the BG11 medium. To discriminate between sodium and nitrate, we then assayed bloom formation fol-lowing the addition of various other salts. The data presented inTable 1show that Na+, as well as other cations, could trigger the aggregation of the biomass. When the cation chelator EDTA was added to the culture with the salts, bloom formation was suppressed. Furthermore, electro-phoretic mobility measurements performed on purified EPS indicated that they carry a nega-tive charge, in agreement with other studies that have reported the presence of acidic sugars among cyanobacterial exopolysaccharides [35–37]. From these data, we concluded that
aggre-gation occurred as a result of the flocculation between anionic EPS and nutrient-associated cat-ions. Additionally, we found that the critical concentration for bloom formation was cation-dependent. Classifying the cation in order of flocculating power, we found: Mg2+*Ca2+>K+ *Na+. This is in qualitative agreement with the Schulze-Hardy rule stating that flocculation
thresholds decrease with ion valency [38,39].
Irreversible blooming occurs in several cyanobacterial strains
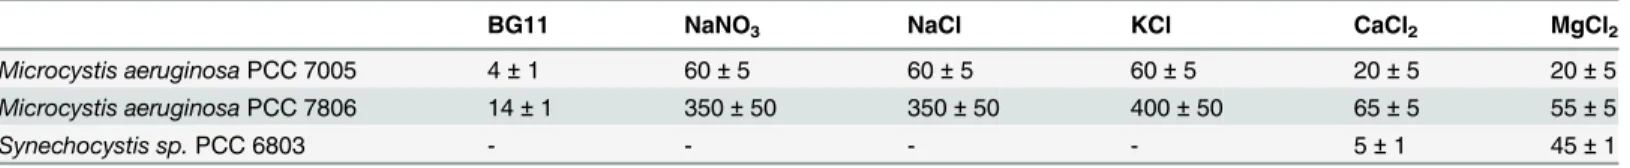
Because the dual ability to synthesize anionic EPS and produce oxygen is not restricted toM. aeruginosaPCC 7005, we tested various other cyanobacterial strains and species. Bloom was successfully induced in the toxic stainM. aeruginosaPCC 7806, with the same salts used to trigger bloom formation inM. aeruginosaPCC 7005, although at much higher thresholds (e.g. a relative BG11 concentration of 14X against 4X for the strain PCC 7005). We also successfully induced bloom formation in the unrelated, non-vacuolate specieSynechocystis sp.PCC 6803, which further strengthened the evidences presented above that the migratory process studied here does not rely on the presence of gas vesicles. In this latter case however, collective migra-tion only occurred upon addimigra-tion of Ca2+or Mg2+but no blooms were observed when samples of PCC 6803 were supplemented with either BG11 (up to a relative concentration of 50X), NaNO3, NaCl, KCl (up to concentrations of 1M). This indicate that divalent cations, but not
Table 1. Salt and species-dependent concentration thresholds (in mM, except for the BG11 medium) above which irreversible blooms form.
BG11 NaNO3 NaCl KCl CaCl2 MgCl2
Microcystis aeruginosaPCC 7005 4±1 60±5 60±5 60±5 20±5 20±5 Microcystis aeruginosaPCC 7806 14±1 350±50 350±50 400±50 65±5 55±5
Synechocystis sp.PCC 6803 - - - - 5±1 45±1
Reference concentration of 1 is that of BG11 specified inMaterial and Methods. The reported concentrations of BG11 are thefinal relative values while the concentrations of all other salt are the amount added to the samples and are expressed in mM. For comparison, the BG11 at 1X contains 17.65 mM NaNO3,*18 mM Na+,*0.2 mM K+,*0.25 mM Ca2+and*0.3 mM Mg2+
monovalent ones, can reduce the electrostatic repulsion between PCC 6803 cells and lead to biomass aggregation and subsequent migration. Interestingly, when divalent cations were added above the threshold for bloom formation together with monovalent cations, no blooms occurred. This reveals that metallic cations compete for the binding sites of the EPS produced bySynechocystis sp.PCC 6803. This contrasts sharply with the synergistic interaction observed forM. aeruginosaPCC 7005.
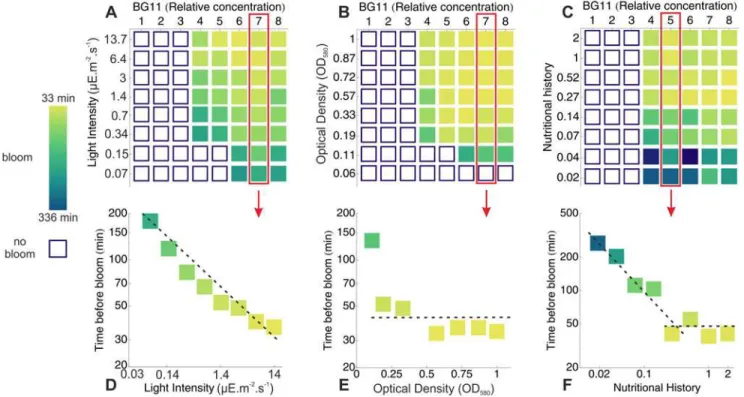
Influence of light intensity and cyanobacterial concentration on bloom
formation
In the previous sections, we have identified biomass flocculation following a sudden increase in salinity and photosynthetic oxygen production as the physico-chemical mechanisms underly-ing the irreversible migration of the biomass. In natural conditions, the intensity of these pro-cesses is governed by the interplay between various environmental parameters. In order to determine whether the process of bloom formation described here could occur in a natural en-vironment, we have assayed blooming for a range of cyanobacterial concentrations, light inten-sities and salt (BG11) concentrations on the cyanobacteriaM. aeruginosaPCC 7005 and summarized the results inFig. 4. For each set of parameters, we recorded whether bloom oc-curred and the time it took to appear. At a fixed cell density of 7106cell/ml (Fig. 4 A and D),
decreasing the light intensity from 14 to 0.3μE.m−2.s−1had no influence on the salt concentra-tion threshold (relative BG11 concentraconcentra-tion of*4X) necessary to induce a bloom. Below 0.3
Fig 4. Phase diagrams for bloom formation.A-C: Phase diagrams for bloom formation. Open squares indicate that no bloom were observed within a time window of 24 hour while solid squares show that blooming occurred. The later are color coded with the timescale of bloom formation. For various values of the light intensity (A), initial cell density (B) and nutritional history (i.e relative nutrient concentration in the mother culture -C), 8 values of the salinity (relative BG11 concentration) were tested. D-F: Details of the phase diagrams A-C for fixed values of the salinity. Lowering the light intensity (D) increased the blooming timescale while changing the initial cell density OD580had little effect on this timescale (E). For nutritional history in the range 0.2−2X no effect on
bloom formation were seen while below 0.2X the blooming timescale increased sharply (F).
μE.m−2.s−1, this threshold increased slightly (relative BG11 concentration of*6X). Decreasing
the light intensity increased monotonously the timescale of bloom formation from*30
to*200 min. At a fixed light intensity of*7μE.m−2.s−1(Fig. 4 B and E), changing the cell concentration in the range 3106−2107cell/ml had no effect either on the timescale or on
the BG11 threshold of bloom formation. For cell densities of 2106cell/ml both the salinity
threshold and the timescale of bloom formation rised sharply and no blooms were observed at cell densities of 106cell/ml and below. Similar results were also obtained by first inoculating the cells at low optical density with a high salt ([KCl] = 60 mM or [CaCl2] = 20 mM)
concen-tration and then allowing them to grow at 14μE.m−2.s−1. In that case, scum formation also oc-curred when the culture reached the critical cell concentration of 2106cell/ml.
The timescale for bloom formation depends strongly on the nutritional
history of the cyanobacteria
By comparing experimental data gathered on samples from exponential (OD580*1—Fig 4-B)
and late exponential to stationary phase (OD580≳2—Fig 1-A), we noticed that samples from
older cultures took a longer time to develop a bloom. While the age of a culture might not be an environmentally relevant parameter, this observation suggests that the nutritional history of a culture might influence the blooming process. In order to investigate this effect, we cultivated
M. aeruginosaPCC 7005 in BG11 nutritive medium at various relative concentrations (0.02X to 2X) for three weeks and the cultures were then assayed for bloom formation by diluting the samples to an OD580= 0.35 and then adding concentrated nutrients to trigger bloom
forma-tion.Fig 4 C and Findicates that blooming occurred at the same salt concentration threshold (relative BG11 concentration of 4X), irrespective of the nutritional history. Similarly, no signifi-cant variations of the blooming timescale were observed when the nutrient concentration in the initial culture was decreased from 2X to*0.25X. When this concentration was further
de-creased in the range 0.02-0.25X on the other hand, the timescale of bloom formation was strongly affected and increased from*40 to*330 minutes. Because blooming thresholds
were not affected by the nutritional history, these data suggest that the increased timescale is not due to a change in EPS concentration but rather to a decreased O2production rate in
cul-tures grown at lower nutrient concentration. In support of this hypothesis, we indeed measured a four-fold reduction in chlorophyllacontent per cell in diluted medium (S3 Fig).
Discussion
By modulating their buoyancy using internal gas vesicles, individualM. aeruginosacells can migrate along the water column at speed up to 1 mm/h [21,40,41] while the collective migra-tion mechanism studied here allows cells to migrate at speed≳1cm/h. When the salt concen-tration is above a salt and species-dependent threshold, cations screen the repulsive
interactions between negatively charged EPS at the surface of cyanobacterial cells and cellular aggregates form. The concentrated photosynthetic activity in these clusters leads to O2
super-saturation which nucleates into bubbles. In turn, trapped O2bubbles provide a lift force that
the mechanism identified in this study using natural samples. For example, environmental iso-lates ofM. aeruginosaform large colonies and exhibit a complex vertical migration dynamics due to their dynamic glycan ballast that could compete with the oxygen-mediated upward mi-gration. Although possibly interesting, these effects require an in-depth investigation and are therefore postponed to a future study.
The blooming process studied here occurs in a range of conditions that are environmentally relevant as similar and even higher values than the measured thresholds have already been measured in natural waterbodies for the salinity [42], light, nutrient concentration (for cultures grown in diluted BG-11 medium) [43,44] and oxygen saturation levels [45]. Although the sa-linity thresholds for bloom inM. aeruginosaPCC 7005 andSynechocystis sp.PCC 6803 are low enough to be exceeded in natural environments [42], the competitive binding between mono-valent and dimono-valent cations inSynechocystis sp.PCC 6803 is likely to inhibit its ability to bloom in most waters. Indeed, while we successfully producedSynechocystisblooms in the laboratory, this specie is not usually associated with environmental blooms. By contrast, the synergistic binding of metallic cations with the EPS produced byM. aeruginosaPCC 7005 may explain the abundance of this specie in natural blooms. While cations also bind cooperatively in the toxic strainM. aeruginosaPCC 7806, this specie is less likely to bloom in nature as its salt thresholds are 3 to 6 times higher than in the nontoxic strain. Although both synergistic and competitive associations between cyanobacterial EPS and metals have been reported previously [36,46,47], the underlying mechanisms remain poorly understood and more work is needed to elucidate these binding processes. In this respect, similar experiments performed with cyanobacterial mutants ofSynechocystis sp.PCC 6803 defective for EPS production [31] could provide valu-able data to further understand the cell aggregation process.
Both the nutritional history and the light intensity were found to increase the timescale for bloom formation without any significant effect on the salinity thresholds. This variation can be explained by a decrease in the O2production rate per unit of biomass under low light
intensi-ties or in case of a weaker photosynthetic machinery in poor environments. Of course, other factors such as the temperature, can contribute to the efficiency of the photosynthetic O2
pro-duction. While the timescale for bloom never exceeded*6 hours in our experiments, the O2
accumulation rate in nature is likely to be smaller due to both convection and the respiratory activity of other species, two effects that are absent in our experiments. Because the timescale of bloom cannot exceed*12 hours (the maximum sunlight exposure), O2production may be
the limiting factor for bloom formation and, while outside the scope of this study, it would also be interesting to conduct additional experiments with PSII-inactivated mutants defective in oxygen evolution.
Given the slow growth of cyanobateria, blooming occurs without major increase of the over-all biomass. We found that the initial cell density had little effect on either the salinity threshold or on the timescale of bloom. On the other hand, irreversible migration only occurred above a sharply defined concentration threshold of*106cell/ml (OD580= 0.05). This ON/OFF
Beside the environmental relevance of the present study, exploiting the natural tendency to bloom of cyanobacterial cultures could have a valuable impact in an industrial context given the high potential of cyanobacteria for biofuel generation [50–52]. Indeed, the separation of
micro-scopic organisms, whose density is close to that of water, from the culture medium in bioreac-tors is so far an expensive and challenging bio-engineering process, requiring the filtration or centrifugation of large volumes. Inducing the global agglomeration and migration of the bio-mass by raising the salinity could offer a fast, easy, inexpensive and environmentally friendly harvest solution in large pools, also because the recovery and recycling of salty nutrients is easy.
Supporting Information
S1 Fig. Evolution of the blooming process for various BG11 concentration.Assay for bloom formation inM. aeruginosaPCC7005. Aliquots from a culture in the late exponential phase (OD*2) were resuspended to a final optical density of 0.35 in BG11 medium at various
rela-tive concentrations (1X being the reference given in theMaterial and Methodssection) indicat-ed on top of each tube. Series of tubes are shown at three different times: 0, 150 and 300 min. after nutrient pouring. Note that for relative nutrient concentration above*20X, there is a
distinctive yellowing of the biomass while the lower fraction progressively becomes black. These changes in coloration can be attributed to cell lysis together with the release of the cyano-bacterial pigment phycocyanin.
(EPS)
S2 Fig. Effect on sonication on blooming.Series of pictures showing that sonication of cyano-bacterial culture collapsed the gas vesicles but did not prevent blooming. Assay for bloom for-mation inM. aeruginosaPCC7005 following sonication. Aliquots from a culture in the late exponential phase (OD*2) were resuspended to a final optical density of 0.35 in BG11
medi-um 1X (negative control) and 4X (positive control) to induce blooming. Other aliquots were first sonicated and then resuspended at the same BG11 and cell concentration. In the sonicated sample at a BG11 concentration of 1X, there is a clear sedimentation of the cyanobacterial cell, indicating that the gas vesicles were indeed collapsed by sonication. This did not prevent the sonicated sample from blooming.
(EPS)
S3 Fig. Chlorophyll a content.Cultures ofMicrocystis aeruginosaPCC 7005 were grown at different BG11 concentrations (relative concentration between 0.01X and 1X) for three weeks under a 14h/10h light cycle (6μE.m−2.s−1) at 25°C. The sample were then tested for bloom for-mation and their chlorophyll a content was measured. 1ml aliquots of the cultures were centri-fuged at 13000g for 1min. The pellets were then resuspended in 90% methanol and allowed to sit 5 min in the dark to extract the chlorophyll. The samples were then centrifuged again and the optical density OD665of the supernatant was measured at 665nm. The optical density was
converted in chlorophyll a concentration through the formula: chl a (μg/ml) = 12.7OD665.
(EPS)
S1 Movie. Movie showing the evolution of the blooming process for various BG11 concentration.
(AVI)
Acknowledgments
rheology measurements, Florent Carn for assistance with the zetasizer and Valérie Gautier for her help with the EPS extraction.
Author Contributions
Conceived and designed the experiments: JD AM PB. Performed the experiments: JD PB. Ana-lyzed the data: JD AM PB. Contributed reagents/materials/analysis tools: JD AM PB. Wrote the paper: JD AM PB.
References
1. Schindler D (1974) Eutrophication and Recovery in Experimental Lakes: Implications for Lake Manage-ment. Science, 184(4139): 897–899. doi:10.1126/science.184.4139.897PMID:17782381
2. Reynolds CS, Walsby AE (1975) Water-blooms. Biol. Rev. 50:437–481.
3. Smith VH, Schindler DW (2009) Eutrophication science: where do we go from here? Trends Ecol Evol. 4:201–207. doi:10.1016/j.tree.2008.11.009
4. Bartram J, Burch M, Falconer IR, Jones G, Kuiper-Goodman T (1999) Situation assessment, planning and management. in Toxic Cyanobacteria in Water, eds Chorus I, Bartram J ( E & FN Spon, London, UK), pp. 179–209.
5. Paerl HW, Fulton RS, Moisander PH, Dyble J (2001) Harmful freshwater algal blooms, with an empha-sis on cyanobacteria. The Scientific World 1:76–113. doi:10.1100/tsw.2001.16
6. Fogg GE (1969) The physiology of an algal nuisance. Proc. R. Soc. B 173: 175–189. doi:10.1098/ rspb.1969.0045
7. Foy RH, Gibson CE, Smith RV (1976) The influence of daylength, light intensity and temperature on the growth rates of planktonic black-green algae. Eur. J. Phycol. 11:151–163. doi:10.1080/
00071617600650181
8. Paerl HW, Ustach J (1982) black-green algal scums: An explanation for their occurrence during fresh-water blooms. Limnol. Oceanogr. 27:212–217. doi:10.4319/lo.1982.27.2.0212
9. Paerl HW (1988). Nuisance phytoplankton blooms in coastal, estuarine, and inland waters. Limnol. Oceanogr. 33: 823–847. doi:10.4319/lo.1988.33.4_part_2.0823
10. Huisman J, Sharples J, Stroom JM, Visser PM, Kardinaal WEA, Verspagen JMH et al (2004) Changes in turbulent mixing shift competition for light between phytoplankton species. Ecology 85(11):2960–
2970 doi:10.1890/03-0763
11. Huisman JM, Matthijs HCP, Visser PM (2005)Harmful cyanobacteria.Springer Aquatic Ecology Series 3. (Springer, Dordrecht, The Netherlands).
12. Reynolds CS (2006) Ecology of Phytoplankton (Ecology, Biodiversity and Conservation) ( Cambridge University Press, Cambridge, UK).
13. Sivonen K (1996) Cyanobacterial toxins and toxin production. Phycologia 35:1224. doi:10.2216/ i0031-8884-35-6S-12.1
14. Flewelling LJ, Naar JP, Abbott JP, Baden DG, Barros NB, Bossard GD et al. (2005) Brevetoxicosis: red tides and marine mammal mortalities. Nature 435(7043):755–6. doi:10.1038/nature435755aPMID:
15944690
15. Hallegrae GM (1993) A review of harmful algal blooms and their apparent global increase. Phycologia 32:7999
16. Paerl HW, Huisman J (2008) Blooms like it hot. Science 320:57–58. doi:10.1126/science.1155398
PMID:18388279
17. Paerl HW, Otten TG (2013) Harmful cyanobacterial blooms: causes, consequences, and controls. Mi-crobial Ecology 65:9951010. doi:10.1007/s00248-012-0159-y
18. Kromkamp J, van den Heuvel A, Mur LR (1989) Formation of gas vesicles in phosphorus-limited cul-tures ofMicrocystis aeruginosa. Journal of General Microbiology 135: 1933–1939.
19. Deacon Walsby AE (1990) Gas vesicle formation in the dark, and in light of di erent irradiances, by the cyanobacterium Microcystis sp. British Phycological Journal 25: 133–139. doi:10.1080/
00071619000650121
20. Kromkamp J, Walsby AE (1990) A computer model of buoyancy and vertical migration in cyanobacte-ria. Journal of Plankton Research 12: 161–183. doi:10.1093/plankt/12.1.161
22. Visser PM, Passarge J, Mur LR (1997) Modelling vertical migration of the cyanobacterium Micro-cystis. Hydrobiologia 349: 99–109. doi:10.1023/A:1003001713560
23. Reynolds CS, Huszar V, Kruk C, Naselli-Flores L, Melo S (2002) Towards a functional classification of the freshwater phytoplankton. J Plankton Res. 24:417428. doi:10.1093/plankt/24.5.417
24. Booker MJ, Dinsdale MT, Walsby AE (1976) A Continuously monitored column for the study of stratifi-cation by planktonic organisms. Limnol. Oceanog. 21:915–919. doi:10.4319/lo.1976.21.6.0915
25. Walsby AE, Booker MJ (1980) Changes in buoyancy of a planktonic black-green alga in response to light intensity. Br. phycol. J. 15:311–319. doi:10.1080/00071618000650321
26. Jacoby JM, Collier DC, Welch EB, Hardy FJ, Crayton M (2000) Environmental factors associated with a toxic bloom ofMicrocystis aeruginosa. Can. J. Fish. Aqu. Sci. 57:231–240. doi:10.1139/f99-234
27. Yang S, Dong L, Jiang C, Cheng X, Zhang H, Cui L (2007) Isolation, culture and identification of micro-cystis in source water. Life Sci. J. 4: 28–32.
28. Tonk L, Bosch K, Visser PW, Huisman J (2007) Salt tolerance of the harmful cyanobacterium Microcys-tis Aeruginosa. Aquat. Microb. Ecol. 46:117–123. doi:10.3354/ame046117
29. Briand E, Bormans M, Quibbler C, Salençon MJ, Humbert JF (2012) Evidence of the cost of the produc-tion of microcystins byMicrocystis aeruginosaunder di erent light and nitrate environmental conditions. PLoS ONE 7:e29981. doi:10.1371/journal.pone.0029981PMID:22276137
30. Myers JA, Curtis BS, Curtis WR (2013) Improving accuracy of cell and chromophore concentration measurements using optical density. Bmc. Biophys. 6:4. doi:10.1186/2046-1682-6-4PMID:24499615
31. Jittawuttipoka T, Planchon M, Spalla O, Benzerara K, Guyot F, Cassier-Cphauvat C et al (2013) Multi-disciplinary evidences thatSynechocystisPCC6803 exopolysaccharides operate in cell sedimentation and protection against salt and metal stresses. PloS one 8(2): e55564. doi:10.1371/journal.pone. 0055564PMID:23405172
32. Cerantola S, Bounery J, Segonds C, Marty N, Montrozier H (2000) Exopolysaccharide production by mucoid and non-mucoid strains of Burkholderia cepacia. FEMS Microbiol Lett. 185:243246. doi:10. 1016/S0378-1097(00)00099-9
33. Lehmann H (1971) Kinetik des Aufbaus einer Proteinmembran. Untersuchungen an Gasvakuolen der blaugriinen Alge Microcystis aeruginosa. Ber. Dr. Bot. Ges. 84: 615–627.
34. Garcia-Dominguez M, Lopez-Maury L, Florencio FJ, Reyes JC (2000) A gene cluster involved in metal homeostasis in the cyanobacteriumSynechocystis sp.strain PCC 6803. J Bacteriol. 182(6):1507–14. doi:10.1128/JB.182.6.1507-1514.2000PMID:10692354
35. De Philippis R, Vincenzini M (1998) Exocellular polysaccharides from cyanobacteria and their possible applications. FEMS Microbiol. Rev. 22:151–175.
36. Pereira S, Micheletti E, Zille A, Santos A, Moradas-Ferreira P, Tamagnini P et al (2011) Using extracel-lular polymeric substances (EPS)-producing cyanobacteria for the bioremediation of heavy metals: Do cations compete for the EPS functional groups and also accumulate inside the cell? Microbiology 157:451458. doi:10.1099/mic.0.041038-0
37. De Philippis R, Margheri MC, Materassi R, Vincenzini M. Potential of unicellular cyanobacteria from sa-line environments as exopolysaccharide producers. Appl. Environ, Microbiol. 64:1130–1132, 1998 38. Schulze H (1882) Schwefelarsen im w¨asseriger Lösung. J. Prakt. Chem. 25:431–452. doi:10.1002/
prac.18820250142
39. Hardy WB (1900) A preliminary investigation of the conditions which determine the stability of irrevers-ible hydrosols. Proc. R. Soc. Lond. 66:110–125. doi:10.1098/rspl.1899.0081
40. Thomas RH, Walsby AE (1985) Buoyancy regulation in a strain of Microcystis. J. Gen. Microbiol. 131:799809.
41. Klemer AR, Cullen JJ, Mageau MT, Hanson KM, Sundell RA (1996) Cyanobacterial buoyancy regula-tion: The paradoxical roles of carbon. J. Phycol. 32: 47–53. doi:10.1111/j.0022-3646.1996.00047.x
42. DOE (1994) inHandbook of Methods for the Analysis of the Various Parameters of the Carbon Dioxide System in Sea Watereds Dickson AG, Goyet C ORNL/CDIAC-74.
43. Xiao-e Y, Xiang W, Hu-lin H, Zhen-li H (2008) Mechanisms and assessment of water eutrophication. J. Zhejiang. Univ. Sci. 9:197 209. doi:10.1631/jzus.B0710626
44. Cha n J, Bridgeman T, Bade D (2013) Nitrogen Constrains the Growth of Late Summer Cyanobacterial Blooms in Lake Erie. Adv. Microbiol. 3(6A) 16–26.
45. Weitkamp DE, Katz M (1980) A review of dissolved gas supersaturation literature. Trans. Am. Fish. Soc. 109, 659–702. doi:10.1577/1548-8659(1980)109%3C659:ARODGS%3E2.0.CO;2
47. Parker DL,Mihalick JE, Plude JL, Plude MJ, Clark TP, Egan L et al (2000) Sorption of metals by extra-cellular polymers from the cyanobacterium Microcystis aeruginosa f. flos-aquae strain C3–40. J. Appl. Phycol. 12:219–224. doi:10.1023/A:1008195312218
48. Klemer AR, Feuillade J, Feuillade M (1982) Cyanobacterial blooms: carbon and nitrogen limitation have opposite e ects on the buoyancy of Oscillatoria. Science 215:1629–31. doi:10.1126/science.215. 4540.1629PMID:17788490
49. Chorus I, Cavalieri M (2000) in Monitoring bathing waters a practical guide to the design and implemen-tation of assessments and monitoring programmes eds Bartram J, Rees J ( E & FN Spon, New York). 50. Parmar A, Singh NK, Pandey A, Gnansounou E, Madamwar D (2011) Cyanobacteria and microalgae: A positive prospect for biofuels. Bioress. Techn. 102:10163–10172. doi:10.1016/j.biortech.2011.08. 030
51. Chen M, Li J, Zhang L, Chang S, Liu C, Wang J et al (2014) Auto-flotation of heterocyst enables the effi-cient production of renewable energy in cyanobacteria. Nature Sci. Rep. 4:3998.