FUNDAÇÃO GETULIO VARGAS
JOELSON OLIVEIRA SAMPAIO
EVOLUTION OF CORPORATE GOVERNANCE OF PRIVATELY
CONTROLLED BRAZILIAN COMPANIES
Dissertação de Mestrado apresentada à Escola de
Administração de Empresas de São Paulo da Fundação
Getulio Vargas, como requisito para a obtenção de título
de Mestre em Administração de Empresas
Campo de Conhecimento:
Finanças Corporativas
Orientador:
Prof. Dr. Antonio Gledson de Carvalho
Sampaio, Joelson.
Evolution of Corporate Governance of Privately Controlled Brazilian Companies / Joelson Sampaio. - 2010.
102 f.
Orientador: Antonio Gledson de Carvalho
Dissertação (mestrado) - Escola de Administração de Empresas de São Paulo.
1. Governança corporativa – Brasil. 2. Empresas -- Brasil. 3. Conselhos de administradores. 4. Empresas – Conselhos diretores. I. Carvalho, Antonio Gledson de. II. Dissertação (mestrado) - Escola de Administração de Empresas de São Paulo. III. Título.
EVOLUTION OF CORPORATE GOVERNANCE OF PRIVATELY
CONTROLLED BRAZILIAN COMPANIES
Dissertação de Mestrado apresentada à Escola de
Administração de Empresas de São Paulo da
Fundação Getulio Vargas, como requisito para a
obtenção de título de Mestre em Administração de
Empresas
Campo de Conhecimento:
Finanças Corporativas
Data de aprovação:
____/____/_______
Banca Examinadora:
___________________________
Prof. Dr. Antonio Gledson de Carvalho (Orientador)
FGV-EAESP
___________________________
Prof. Dr. Richard Saito
FGV-EAESP
___________________________
Prof. Dr. Rodrigo De Losso
Resumo
Nesta dissertação, nós fornecemos um panorama da evolução das práticas de governança corporativa no Brasil ao longo do tempo com base preliminarmente em empresas privadas brasileiras que responderam o Survey de Governança Corporativa no Brasil realizado em 2005 e 2007. Este estudo aborda questões relacionadas com o número de conselheiros independentes e não independentes, conselho de administração, controle das companhias, comitês de auditoria e conselho fiscal. Direitos dos acionistas, acordos de acionistas, mecanismos de transparência e de transações com conflito de interesse, também serão discutidos neste trabalho. Constatamos que a evolução das práticas de governança corporativa tem sido mais significativa em algumas áreas. Todavia, outros ainda são menos adotados pelas empresas brasileiras. Independência do conselho é uma área relativamente fraca: apenas 13% das empresas em 2007, contra 11% em 2005 tem 50% ou mais conselheiros independentes. O número de empresas que fornece direitos de proteção aos acionistas minoritários em uma venda do controle, além do mínimo exigido pela lei brasileira, aumentou. Há um aumento da formalidade dos processos do conselho, como sistema de avaliação de CEO, plano de sucessão de CEO, sistema para avaliar outros diretores e o envio de materiais antes da reunião. Além disso, divulgações de informações financeiras melhoram consideravelmente durante este período.
Palavras-Chave: Brasil, governança corporativa, conselho de administração,
ABSTRACT
In this dissertation we provide an overview of the evolution of corporate governance practices in Brazil over time based primarily in Brazilian private firms which responded to the 2005 and 2007 Brazil Corporate Governance (CG) Survey. This study address issues related to the number of independent directors and non-independent, board structure and control of companies, audit committees and fiscal board. Shareholder rights, shareholder agreements, mechanisms for transparency, and transactions with conflict of interest will also be discussed in this work. We found that the evolution of corporate governance practices has been more significant in some areas. However, others are still less adopted by Brazilian companies. Board independence is an area relatively weak: only 13% of companies in 2007, versus 11% in 2005 have 50% or more of independent directors. The number of the companies that provide takeout rights to minority shareholders on a sale of control beyond the minimum required by Brazilian law has increased. There is an increase in formality of board processes, like system to evaluate CEO, CEO succession plan, system to evaluate other officers and materials before meeting. Moreover, financial disclosure has improved considerably during this period.
Keywords: Brazil, corporate governance, boards of directors, minority
SUMMARY
1. Introduction ... 7
2. Literature Review ... 9
3. Data and Descriptive Statistics ... 10
4. Levels list of BM&FBovespa and Cross-Listing ... 14
5. Board of Directors ... 20
5.1 Board Independence ... 24
5.2 Representatives of minority shareholders... 29
5.3 Chairman and CEO... 35
5.4 Who composes the board?... 36
5.5 Mandates of Directors ... 38
6. Board Procedures... 40
6.1 Minutes and Board Meeting ... 40
6.2 Board Processes ... 42
6.3 Board Actions ... 47
6.4 Board Committees ... 49
7. Audit Committee ... 51
7.1 Fiscal Board ... 55
7.2 Representation of minority interests in the Audit... 59
7.3 External Auditor ... 66
8. Shareholder Meetings and Shareholder Rights ... 69
8.1 Shareholders’ Meetings ... 69
8.2 Rights of Preferred Shareholders... 72
8.3 Minority Common Shareholders ... 76
9. Related Party Transactions ... 80
10. Disclosure ... 84
10.1 Financial Statements... 84
10.2 Website Disclosure ... 88
11. Control ... 92
11.1 Shareholders’ Agreements... 94
12. Remuneration of Directors and Executives ... 97
1. Introduction
There are few detailed governance-related studies, and this may be, in general, due the scarcity of public data on this theme. This dissertation aims to show the evolution of the main aspects related to corporate governance practices in privately controlled Brazilian companies. The contribution of this study to the existing literature is a detailed analysis of the evolution of corporate governance practices over time in Brazil. Thus, this study will address issues related to the number of independent and non-independent directors, board structure and control of companies, audit committees and fiscal boards. Shareholder rights, shareholders’ agreements, mechanisms for transparency and transactions with conflict of interest will also be discussed in this work.
The development of Brazilian capital market in recent years has aspects that go beyond the IPO boom that recently occurred in the Brazilian market. Also, there is a trend towards good practices of corporate governance. Furthermore, some Brazilian companies have accessed the external capital market by listing their shares in foreign stock exchanges, especially the New York Stock Exchange, in the form of American Depositary Receipts (ADR), in order to capitalize through the release of securities abroad. Several rules imposed by the Securities and Exchange Commission (SEC) must be followed by firms that list their shares in stock exchanges in the U.S. Some of these rules are related to accounting procedures, transparency and disclosure – the so-called "principles of corporate governance."
Some governance practices are required by the Brazilian legislation, one example, is a recently law (law 11638/07), which is close to the IFRS International Financial Reporting Standard and that public companies must adopt up to 20101. Thus, some companies have voluntarily adopted the different levels of corporate governance in BMF&FBovespa. The result of all these changes is that some aspects of governance had a significant evolution in recent years. However, other aspects are still less adopted by Brazilian companies. E.g., board independence is a relatively weak area: although the number of companies that have no independent directors were reduced during this
1
period, only 13% of companies in 2007, versus 11% in 2005 have 50%. There is a decrease in the average of the non-independent directors on the board that may be related to the increase of representation of minorities on boards. The number of companies that provide takeout rights to minority shareholders on a sale of control beyond the minimum required by Brazilian law has increased. This increase is not only a result of the entry of new firms in Level 2 or Novo Mercado, but also an improved governance practices adopted by these companies. There is a trend toward more firms have audit committees and fiscal board, but there is an apparent trend toward more firms have both. There is an increase in formality of board processes, like system to evaluate CEO, CEO succession plan, system to evaluate other officers and materials before meeting. Moreover, financial disclosure has improved considerably during this period.
We will work with two surveys to compare the evolution of corporate governance practices in Brazil. The first survey was held in 2005 with 88 privately controlled firms, while the second was held in 2007 with 121 companies privately controlled firms. The number of companies that responded to both questionnaires was 36. We sent a questionnaire to companies with several issues that form the basis for this study. During this period, some of the changes in governance practices are in part related with the change of some companies to BM&FBovespa segments. In addition, many companies that went public in the period from 2005 to 2007 entered in the Level 2, or Novo Mercado of BM&FBovespa. These different levels of governance will be discussed in further details in the next sections of this dissertation. Table 2 shows that, of the 88 companies participating in the 2005 survey, only two (2%) were listed in the Novo Mercado, and in 2007, from 121 participants, forty-five (37%) were in this segment.
agreements (Section 11); and compensation (Section 12). We end with the conclusion in section 13.
2. Literature Review
Some general governance studies have been performed by Patel Balic and Bwaka (2002) that discuss issues related to the transparency of companies and Bruno and Claessens (2007) which give a general overview of corporate governance. There are some studies with more specific aspects of governance, such as Zheka (2006) in Ukraine; Drobetz, Schillhofer and Zimmerman (2004) in Germany; Black, Love and Rachinsky (2006) in Russia. Also, Choi, Park and Yoo (2007) provided details on the structure of the boards of Korean companies during 1999-2002. Balasubramanian, Black and Khanna (2009) studied more specific and detailed measures of governance in India. Some studies that have focused on indicators of legal systems found that laws protecting minority shareholders significantly differ from country to country due to different legal origins (LA PORTA et al., 1998). There are several approaches to corporate governance. In the U.S., the corporate governance provides legal protection to investors against expropriation of wealth by managers, while in Japan and Germany it tends to concentrate power in the hands of large investors who may exercise good corporate governance practices (VISHNY; SHLEIFER, 1997).
positive impact on abnormal returns on trading volume and liquidity of the shares. Dutra and Saito (2002) studied the composition of the 142 most actively traded companies in Brazil and found little use of cumulative voting. Da Silveira, Barros and Famá (2004) studied the association between the value of the firm and board size, composition and separation of CEO and chairman. They found a positive association of the separation between the CEO and chairman with the Tobin's q. De Carvalho and Pennacchi (2009) found evidence that companies that open capital or move to the highest level of governance of BM&FBovespa , have lower underpricing, positive reaction to the stock price after migration, and high liquidity after migration.
3. Data and Descriptive Statistics
This study is based mainly on surveys conducted in 2005 and 2007 sent to all companies listed on BM&FBovespa. Table 1 shows an overview of the companies which participated in surveys conducted in 2005 and 2007. This table shows an increase of the responding companies. In 2005, 116 companies participated in the survey, including 88 Brazilian private firms, 17 from government-controlled firms and 11 from subsidiaries of foreign companies. In 2007, the number of respondents to the questionnaire increased to 172, and among these, 121 companies were privately held national, 21 were from state control and 30 were foreign. Because there are significant differences between the three groups of companies (private, state control and foreign), this work will focus on the analysis of companies in Brazilian private control. Both the 88 and the 121 Brazilian private companies that participated in this survey represent well the Brazilian financial market, as they respond to 28% and 42% respectively of all companies listed on BM&FBovespa. Using the market capitalization of firms with active trading (traded at least 26 days during the year), this sample becomes more significant, with 63% and 65% respectively of the Brazilian stock market. Some companies did not answer to all questions, and these cases will be mentioned during the study.
Table 1 - 2007 - all firms (172 firms; 121 private firms)
Sample Characteristics: All Firms and Responding Firms
Total number of firms and market capitalization for (i) all publicly traded Brazilian firms, (ii) firms with active trading (trading on at least 26 days during 2007), and (iii) firms which responded to the 2007 Brazil CG Survey, separated into firms with Brazilian private control, state control, and foreign control. Data is as of December 2007. Exchange rate as of December 31, 2007 is R$1.77 per US$1.
Number of firms
All Public Firms
Responding
Firms Percent
Actively Traded Firms
Responding
Firms Percent
All Firms 392 172 44% 289 140 48%
private 290 121 42% 209 94 45%
state 35 21 60% 26 17 65%
foreign 67 30 45% 54 28 52%
Market Cap. (R$
billions)
All Firms 2239 1520 68% 2115 1467 69%
private 1337 842 63% 1221 793 65%
state 318 135 42% 316 134 42%
foreign 584 543 93% 578 540 93%
Table 1 - 2005 - all firms (116 firms; 88 private firms)
Sample Characteristics: All Firms and Responding Firms
Total number of firms and market capitalization for (i) all publicly traded Brazilian firms, (ii) firms with active trading (trading on at least 26 days during 2004), and (iii) firms which responded to the 2005 Brazil CG Survey, separated into firms with Brazilian private control, state control, and foreign control. Data is as of January 2005. Exchange rate is R$2.62 per US$1.
Number of firms
All Public Firms
Responding
Firms Percent
Actively Traded Firms
Responding
Firms Percent
All Firms 358 116 32% 229 87 38%
private 313 88 28% 194 66 34%
state 24 17 71% 19 14 74%
foreign 21 11 52% 16 7 44%
Market Cap. (R$
billions)
All Firms 871 441 51% 833 433 52%
private 557 337 61% 523 332 63%
state 167 51 31% 165 50 30%
Table 1 - 2007 overlapping private firms
Sample Characteristics: All Firms and Responding Firms
Total number of firms and market capitalization for (i) all publicly traded Brazilian firms, (ii) firms with active trading (trading on at least 26 days during 2007), and (iii) firms which responded to the 2005 and 2007 Brazil CG Survey, separated into firms with Brazilian private control, state control, and foreign control. Data is as of December 2007. Exchange rate as of December 31, 2007 is R$1.77 per US$1. These informations are referred to the 2007 Brazil GC Survey.
Number of firms
All Public Firms
Responding
Firms Percent
Actively Traded Firms
Responding
Firms Percent
All Firms 392 36 9% 289 29 10%
private 290 36 12% 209 29 14%
Market Cap. (R$
billions)
All Firms 2239 370 15% 2115 361 15%
private 1337 370 28% 1221 361 30%
Table 1 - 2005 - overlapping private firms
Sample Characteristics: All Firms and Responding Firms
Total number of firms and market capitalization for (i) all publicly traded Brazilian firms, (ii) firms with active trading (trading on at least 26 days during 2004), and (iii) firms which responded to the 2005 and 2007 Brazil GC Survey, separated into firms with Brazilian private control, state control, and foreign control. Data is as of January 2005. Exchange rate is R$2.62 per US$1. These informations are referred to the 2005 Brazil GC Survey.
Number of firms
All Public Firms
Responding
Firms Percent
Actively Traded Firms
Responding
Firms Percent
All Firms 358 36 10% 229 24 10%
private 313 36 12% 194 24 12%
Market Cap. (R$
billions)
All Firms 871 124 14% 833 121 15%
private 557 124 22% 523 121 23%
largest firms. These changes may produce some results with bias due to number of small firms in the survey. We will discuss better these results in other sections.
Table 2 - 2007 - all private firms
Sample Characteristics: Brazilian Private Firms, by Size Quartile
Total number of firms and market capitalization for Brazilian private firms which responded and did not respond to the 2007 Brazil CG Survey, divided into quartiles based on market capitalization. Market capitalization is in R$ millions. Data is as of December 2007. Exchange rate is R$1.77 per US$1
Number of firms Market capitalization
Total responding firms
responding as % of quartile All firms in quartile % of total responding firms responding as % of quartile Quartile Size Range in millions of reais R$
1 5,874 to
429,922 72 35 49% 1.156 86% 764 66%
2 1,483 to
5,874 72 33 46% 121 9% 57 47%
3 299 to
1,482 73 29 40% 36 3% 14 39%
4 0 to 298 73 24 33% 24 2% 7 29%
Total 290 121 42% 1.337 100% 842 63%
Table 2 - 2005 - all private firms
Sample Characteristics: Brazilian Private Firms, by Size Quartile
Total number of firms and market capitalization for Brazilian private firms which responded and did not respond to the 2005 and 2007 Brazil CG Survey, divided into quartiles based on market capitalization. Market capitalization is in R$ millions. Data is as of January 2005. Exchange rate is R$2.62 per US$1.
Number of firms Market capitalization
Total responding firms
responding as % of quartile All firms in quartile % of total responding firms responding as % of quartile Quartile Size Range in millions of reais R$
1 1,061 to
86,739 78 32 41% 515,919 93% 322,734 62%
2 172 to
991 78 24 31% 35,151 6% 12,478 36%
3 20 to 158 78 21 27% 5,592 1% 1,666 30%
4 0 to 19 79 11 14% 465 0,1% 54 12%
Table 2 – 2007 - overlapping private firms
Sample Characteristics: Brazilian Private Firms, by Size Quartile
Total number of firms and market capitalization for Brazilian private firms which responded and did not respond to the 2005 and 2007 Brazil CG Survey, divided into quartiles based on market capitalization. Market capitalization is in R$ millions. Data is as of December 2007. Exchange rate is R$1.77 per US$1. These informations are referred to the 2007 Brazil GC Survey.
Number of firms Market capitalization
Total responding firms
responding as % of quartile All firms in quartile % of total responding firms responding as % of quartile Quartile Size Range in millions of reais R$
1 5,874 to
429,922 72 15 21% 1,156 86% 359 31%
2 1,483 to
5,874 72 3 4% 121 9% 5 4%
3 299 to
1,482 73 10 14% 36 3% 4 11%
4 0 to 298 73 8 11% 24 2% 2 8%
Total 290 36 12% 1,337 100% 370 28%
Table 2 - 2005 - overlapping private firms
Sample Characteristics: Brazilian Private Firms, by Size Quartile
Total number of firms and market capitalization for Brazilian private firms which responded and did not respond to the 2005 and 2007 Brazil CG Survey, divided into quartiles based on market capitalization. Market capitalization is in R$ millions. Data is as of January 2005. Exchange rate is R$2.62 per US$1. These informations are referred to the 2005 Brazil GC Survey.
Number of firms Market capitalization
Total responding firms
responding as % of quartile All firms in quartile % of total responding firms responding as % of quartile Quartile Size Range in millions of reais R$
1 1,061 to
86,739 78 16 21% 515,919 93% 120,334 23%
2 172 to
991 78 4 5% 35,151 6% 2,818 8%
3 20 to 158 78 7 9% 5,592 0% 481 9%
4 0 to 19 79 9 11% 465 0% 11 2%
Total 313 36 12% 557,128 100% 123,644 22%
4. Levels list of BM&FBovespa and Cross-Listing
corporate governance for companies that could list voluntarily. Its main features are briefly listed below.
2
Level 1 aims to improve the transparency of companies requiring a free-float of at least 25% of the capital. The company needs to adopt mechanisms that promote the dispersion of capital, provide quarterly reports with financial statements with an accompanying external audit. It is necessary to make disclosure of monthly transactions by controlling shareholders, and disseminate an annual calendar of corporate events. At Level 2, companies must adopt corporate governance practices that promote additional protection to minority shareholders by establishing a two-year term to the board, which must be at least 5 members, of whom at least 20% shall be independent. Disclosure of annual balance sheet shall be made in accordance with USGAAP or IFRS standards. If the shareholders of the control block want to sell their participation, the preferred shares should have at least 80% of price of the control block (tag along). It is given the right to vote for preferred shares granted in some circumstances: transformation, merger, consolidation or spin-off of the company, approval of contracts between the company and other companies within the group and obligation of public offer by the economic value, in addition, it established an arbitrage panel to resolve corporate dispute. In the Novo Mercado only common shares can be issued. In other levels, companies need to use mechanisms that favor capital dispersion, while maintaining a free-float of at least 25% of the capital. The other requirements are similar to those placed on Level 2.
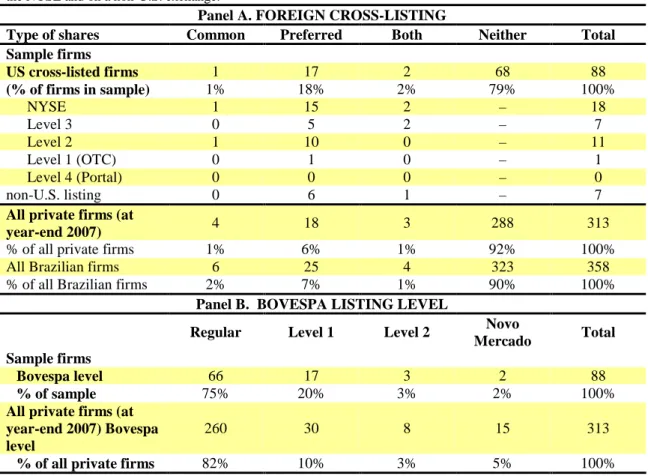
Table 3 provides an overview about listing on foreign exchanges and different BM&FBovespa Levels in the years 2005 and 2007. In 2005 only two of 88 Brazilian private control respondents were listed on the Novo Mercado. In 2007 45 of 121 companies belonged to the Novo Mercado. Addition, 78 of the 110 IPOs that occurred between 2004 and 2008 were in Novo Mercado. The National Association of Investment Banking and Fixed Income (ANBIMA) allows its members to only participate in IPOs of companies that are listed at least Level 1 of corporate governance, except in those IPOs of companies that have shares listed abroad3. In 2005 only 14% of the 36 companies were listed on Level 2 or Novo Mercado, in 2007 46% of companies
2
The full name on BM&FBovespa for Level 1 (2) is Differentiated Level of Corporate Governance 1 (2)
were listed on these levels4. As can be seen there is a trend of migration to the Novo Mercado and Level 2 over time.
Table 3 - 2007 – 121 Brazilian private companies Listing on Foreign Exchanges and Different Bovespa Levels
Firms which have common shares, non-voting preferred shares, or both cross-listed on a foreign stock exchange. Sample is 121 Brazilian private firms which responded to the 2007 Brazil CG Survey. Three firms are listed both on the NYSE and on a non-U.S. exchange.
Panel A. FOREIGN CROSS-LISTING
Type of shares Common Preferred Both Neither Total Sample firms
US cross-listed firms 5 16 2 98 121
(% of firms in sample) 4% 13% 2% 81% 100%
NYSE 5 13 2 – 20
Level 3 3 8 1 – 12
Level 2 0 6 0 – 6
Level 1 (OTC) 1 1 0 – 2
Level 4 (Portal) 1 1 1 – 3
non-U.S. listing 0 1 1 – 2
All private firms (at
year-end 2007) 5 18 2 267 290
% of all private firms 2% 6% 0% 92% 100%
All Brazilian firms 12 18 3 359 392
% of all Brazilian firms 3% 5% 1% 92% 100%
Panel B. BOVESPA LISTING LEVEL
Regular Level 1 Level 2
Novo
Mercado Total Sample firms
Bovespa level 41 24 11 45 121
% of sample 34% 20% 9% 37% 100%
All private firms (at year-end 2007) Bovespa level
159 36 17 78 290
% of all private firms 55% 12% 6% 27% 100%
4 As Table 3 indicates, some Brazilian firms have cross-listed common shares, some have cross-listed
Table 3 - 2005 – 88 Brazilian private companies
Listing on Foreign Exchanges and Different Bovespa Levels
Firms which have common shares, non-voting preferred shares, or both cross-listed on a foreign stock exchange. Sample is 88 Brazilian private firms which responded to the 2005 Brazil CG Survey. Three firms are listed both on the NYSE and on a non-U.S. exchange.
Panel A. FOREIGN CROSS-LISTING
Type of shares Common Preferred Both Neither Total Sample firms
US cross-listed firms 1 17 2 68 88
(% of firms in sample) 1% 18% 2% 79% 100%
NYSE 1 15 2 – 18
Level 3 0 5 2 – 7
Level 2 1 10 0 – 11
Level 1 (OTC) 0 1 0 – 1
Level 4 (Portal) 0 0 0 – 0
non-U.S. listing 0 6 1 – 7
All private firms (at
year-end 2007) 4 18 3 288 313
% of all private firms 1% 6% 1% 92% 100%
All Brazilian firms 6 25 4 323 358
% of all Brazilian firms 2% 7% 1% 90% 100%
Panel B. BOVESPA LISTING LEVEL
Regular Level 1 Level 2
Novo
Mercado Total Sample firms
Bovespa level 66 17 3 2 88
% of sample 75% 20% 3% 2% 100%
All private firms (at year-end 2007) Bovespa level
260 30 8 15 313
Table 3 - 2007 - 36 overlap private firms
Listing on Foreign Exchanges and Different Bovespa Levels
Firms which have common shares, non-voting preferred shares, or both cross-listed on a foreign stock exchange. Sample is 36 Brazilian private firms which responded to the 2005 and 2007 Brazil CG Survey. These informations are referred to the 2007 Brazil GC Survey.
Panel A. FOREIGN CROSS-LISTING
Type of shares Common Preferred Both Neither Total Sample firms
US cross-listed firms 1 10 0 25 36
(% of firms in sample) 3% 28% 0% 69% 100%
NYSE 1 9 0 – 10
Level 3 1 6 0 – 7
Level 2 0 4 0 – 4
Level 1 (OTC) 0 0 0 – 0
Level 4 (Portal) 0 0 0 – 0
non-U.S. listing 0 5 0 – 5
All private firms (at
year-end 2007) 5 12 1 272 290
% of all private firms 2% 4% 0% 94% 100%
All Brazilian firms 12 18 3 359 392
% of all Brazilian firms 3% 5% 1% 91% 100%
Panel B. BOVESPA LISTING LEVEL
Regular Level 1 Level 2
Novo
Mercado Total Sample firms
Bovespa level 13 12 3 8 36
% of sample 36% 33% 8% 22% 100%
All private firms (at year-end 2007) Bovespa level
159 36 17 78 290
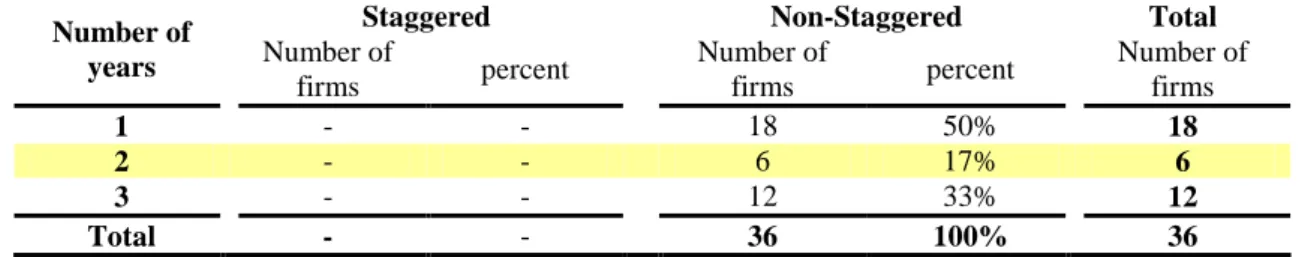
Table 3 - 2005 - 36 overlap private firms
Listing on Foreign Exchanges and Different Bovespa Levels
Firms which have common shares, non-voting preferred shares, or both cross-listed on a foreign stock exchange. Sample is 36 Brazilian private firms which responded to the 2005 and 2007 Brazil CG Survey. These informations are referred to the 2005 Brazil GC Survey.
Panel A. FOREIGN CROSS-LISTING
Type of shares Common Preferred Both Neither Total Sample firms
US cross-listed firms 1 10 0 25 36
(% of firms in sample) 3% 28% 0% 69% 100%
NYSE 1 9 0 – 10
Level 3 1 6 0 – 7
Level 2 0 4 0 – 4
Level 1 (OTC) 0 0 0 – 0
Level 4 (Portal) 0 0 0 – 0
non-U.S. listing 0 5 0 – 5
All private firms (at
year-end 2007) 4 16 1 292 313
% of all private firms 1% 5% 0% 93% 100%
All Brazilian firms 6 25 4 323 358
% of all Brazilian firms 2% 7% 1% 90% 100%
Panel B. BOVESPA LISTING LEVEL
Regular Level 1 Level 2
Novo
Mercado Total Sample firms
Bovespa level 19 12 3 2 36
% of sample 53% 33% 8% 6% 100%
All private firms (at year-end 2007) Bovespa level
260 30 8 15 313
% of all private firms 83% 10% 3% 5% 100%
by signals on corporate governance that is offered to companies that are listed at Level 2 or Novo Mercado. This could reduce the value of the additional signal provided by cross-listing on level 2 or 35.
Table 4
Listing Decisions over Time: Cross-listing and Bovespa Level
Number of Brazilian public companies which are cross-listed outside Brazil (principally in the U.S.) and listed on the indicated Bovespa levels. Some firms with a regular Bovespa listing have public debt but not public equity. Data is provided by Bovespa, and is at year-end except for 2009.
Foreign cross-listing Bovespa listing
Year NYSE or NASDAQ
U.S. (total
cross-listings ) Regular Level 1 Level 2
Novo
Mercado Total
1995 2 23 577 577
1996 3 35 589 589
1997 7 39 595 595
1998 17 53 599 599
1999 19 56 534
these levels were created in 2000
534
2000 22 60 494 0 0 0 494
2001 26 66 450 18 0 0 468
2002 33 72 407 24 3 2 436
2003 34 72 374 31 3 2 410
2004 35 76 343 33 7 7 390
2005 35 79 316 37 10 18 381
2006 32 82 300 36 14 44 394
2007 33 95 293 40 18 82 433
2008 35 103 266 41 20 99 426
2009 33 110 263 37 19 103 422
5. Board of Directors
One of the goals of the board is to protect the wealth of the equityholders. The board must determine the strategies of the company, elect and remove directors, monitor managers and choose the external auditors. Therefore, the board has an important role in the corporate governance of any company. Brazilian law requires the board to have at least three members. The CVM and IBGC recommend that boards have between five to nine members6. Companies listed at Level 2 or Novo Mercado of the BM&FBovespa must have at least five members. In table 5 we can see an increase in the average size of
5
In Table 4, we show cross-listing in the U.S. but not in other countries. Relatively few Brazilian firms cross-list in other countries; of these, all but one (Bradespar, cross-listed in Madrid) also cross-list in the U.S
6 CVM Recommendations on Corporate Governance (2002), § 2.1; IBGC Code of Best Practice of
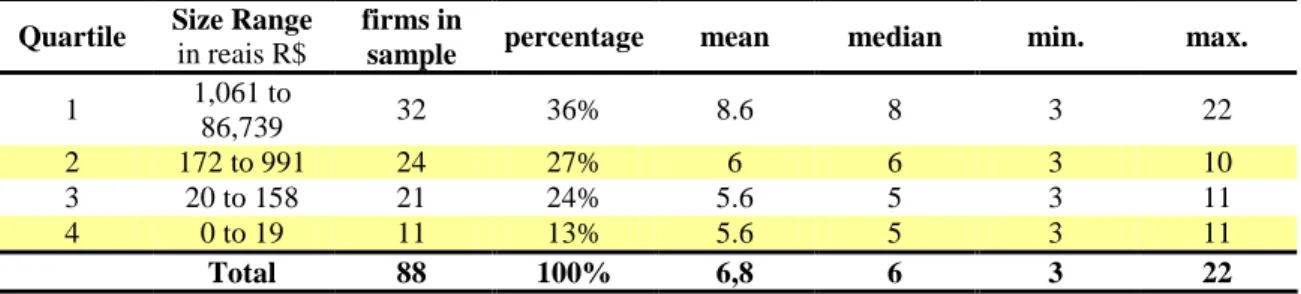
the boards, which can be explained by new IPOs on BM&FBovespa Level 2 and Novo Mercado. If we consider only the 36 companies that responded to both questionnaires, basically no change in the number of members of the board.There is a trend to increase the size of the boards, but as this trend does not occur for firms overlap, this could be a result of entry of new companies in the sample.
Table 5 - 2007 - 121 Brazilian private companies
Size of the Board of Directors
Board size and percentage for 121 Brazilian private firms which responded to the 2007 Brazil CG Survey. Minimum board size under Brazilian law is 3 directors.
No. of Directors No. of firms percentage cumulative percentage
3 10 8% 8%
4 6 5% 13%
5 17 14% 27%
6 24 20% 47%
7 29 24% 71%
8 10 8% 79%
9 11 9% 88%
10 3 2% 91%
11 5 4% 95%
12 to 20 6 5% 100%
mean (median) 7.4 (7)
Table 5 - 2005 - 88 Brazilian private companies
Size of the Board of Directors
Board size and percentage for 88 Brazilian private firms which responded to the 2005 Brazil CG Survey. Minimum board size under Brazilian law is 3 directors.
No. of Directors No. of firms percentage cumulative percentage
3 14 16% 16%
4 3 3% 19%
5 19 22% 41%
6 11 13% 53%
7 15 17% 70%
8 6 7% 77%
9 4 5% 82%
10 4 5% 86%
11 7 8% 94%
12 to 15 4 5% 96%
22 1 1% 100%
Table 5 - 2007 - 36 overlap private firms
Size of the Board of Directors
Board size and percentage for 36 Brazilian private firms which responded to the 2005 and 2007 Brazil CG Survey. Minimum board size under Brazilian law is 3 directors. These informations are referred to the 2007 Brazil GC Survey.
No. of Directors No. of firms percentage cumulative percentage
3 4 11% 11%
4 2 6% 17%
5 2 6% 22%
6 5 14% 36%
7 12 33% 69%
8 3 8% 78%
9 1 3% 81%
10 3 8% 89%
11 3 8% 97%
12 1 3% 100%
mean (median) 7.1 (7)
Table 5 - 2005 - 36 overlap private firms
Size of the Board of Directors
Board size and percentage for 36 Brazilian private firms which responded to the 2005 and 2007 Brazil CG Survey. Minimum board size under Brazilian law is 3 directors. These informations are referred to the 2005 Brazil GC Survey.
No. of Directors No. of firms percentage cumulative percentage
3 5 14% 14%
4 0 0% 14%
5 5 14% 28%
6 4 11% 39%
7 8 22% 61%
8 4 11% 72%
9 3 8% 80%
10 3 8% 88%
11 1 3% 91%
12 1 3% 94%
13 0 0% 94%
14 1 3% 97%
22 1 3% 100%
mean (median) 7.3 (7)
Table 6 - 2007 - 121 Brazilian private companies
Size of the Board of Directors by Size Quartile
Board size and percentage for 121 Brazilian private firms which responded to the 2007 Brazil CG Survey. Minimum board size under Brazilian law is 3 directors. Quartiles are based on market capitalization as of Dec. 2007. Amounts in R$ millions.
Quartile Size Range
in reais R$
firms in
sample percentage mean median min. max.
1 2,852 to
429,922 37 31% 8.1 7 4 20
2 910 to
2,851 34 28% 6.4 6.5 3 12
3 104 to 909 30 25% 6.1 5 3 12
4 0 to 103 20 17% 6.3 6 3 10
Total 121 100% 7.4 7 3 20
Table 6 - 2005 - 88 Brazilian private companies
Size of the Board of Directors by Size Quartile
Board size and percentage for 88 Brazilian private firms which responded to the 2005 Brazil CG Survey. Minimum board size under Brazilian law is 3 directors. Quartiles are based on market capitalization as of Jan. 2005. Amounts in R$ millions.
Quartile Size Range
in reais R$
firms in
sample percentage mean median min. max.
1 1,061 to
86,739 32 36% 8.6 8 3 22
2 172 to 991 24 27% 6 6 3 10
3 20 to 158 21 24% 5.6 5 3 11
4 0 to 19 11 13% 5.6 5 3 11
Total 88 100% 6,8 6 3 22
Table 6 - 2007 - 36 overlap private firms
Size of the Board of Directors by Size Quartile
Board size and percentage for 36 Brazilian private firms which responded to the 2005 and 2007 Brazil CG Survey. Minimum board size under Brazilian law is 3 directors. Quartiles are based on market capitalization as of Dec. 2007. Amounts in R$ millions. These informations are referred to the 2007 Brazil GC Survey.
Quartile Size Range
in reais R$
firms in
sample percentage mean median min. max.
1 2,852 to
429,922 15 42% 8.9 8 7 11
2 910 to
2,851 3 8% 6 6 5 7
3 104 to 909 10 28% 6.3 7 3 7
4 0 to 103 8 22% 4.7 4 3 10
Table 6 - 2005 - 36 overlap private firms
Size of the Board of Directors by Size Quartile
Board size and percentage for 36 Brazilian private firms which responded to the 2005 and 2007 Brazil CG Survey. Minimum board size under Brazilian law is 3 directors. Quartiles are based on market capitalization as of Jan. 2005. Amounts in R$ millions. These informations are referred to the 2005 Brazil GC Survey.
Quartile Size Range
in reais R$
firms in
sample percentage mean median min. max.
1 1,061 to
86,739 16 44% 8.6 8 5 22
2 172 to 991 4 11% 6 6.5 5 7
3 20 to 158 7 19% 6.3 7 3 10
4 0 to 19 9 25% 5.4 5 3 10
Total 36 100% 7.3 7 3 22
5.1 Board Independence
The composition of the board is one of the aspects of great importance in corporate governance. The presence of independent directors is based on the premise of ensuring that the board is not just an extension of the controlling shareholder. Brazilian law has been concerned with this issue, as demonstrated in reform happened in 20017. This reform created new criteria for the composition of the board of directors of public companies, ensuring the election of members of the minority shareholders and/or preferred to have certain percentage of ownership required by law.
Brazil law has only one requirement on the proportion of directors that limits one third the proportion of directors who may be employees of the company8. For the CVM the number of independent directors should be as large as possible, but is not specified what would be that number. The composition of the board, according to the IBGC, can range from five to nine members. Moreover, depending of the organizational structure, their recommendation is that it is mostly composed of independent directors, but this recommendation is rarely followed, as the research data show. According to the rules of governance levels of BM&FBovespa: at least 20% of directors must be independent to enable companies to list at Level 2 or Novo Mercado9. The NYSE rules require that a majority of the board is composed of independent directors. To Dutra and Saito (2002),
7 Law 10.3003. Art.1 8 Law 6404/76, art. 143, § 1 9
the participation of independent directors in the Brazilian represents 21% of the total members, against 64% in the U.S.
Table 7 shows the proportion of independent directors and non-independent from the companies that participated in both surveys 2005 and 2007. The definitions used for this research were:
• Non-independent directors: they are directors or former directors or are members or representatives of a controlling shareholder, shareholder group or controlling family.
• Independent Directors: are people who are not officers or former officers and
are independent of the controlling shareholder, controlling shareholder group, or controlling family.
.
Table 7 - 2007 - 121 Brazilian private companies
Proportion of Independent Directors
Number and percentage of independent directors, for 121 Brazilian private firms which responded to the 2007 Brazil CG Survey and provided data on board composition. In computing proportion of independent directors, percentages are rounded up to next whole number.
No. of Independent Directors number of firms cumulative percent Proportion of Independent Directors number of firms cumulative percent
0 18 15% 0% 18 15%
1 29 39% 1-10% 2 17%
2 37 69% 11-20% 22 35%
3 24 89% 21-30% 23 54%
4 8 96% 31-40% 17 68%
5 5 100% 41-50% 18 83%
51-60% 11 92%
61-70% 9 99%
71% or more 1 100%
mean 1.9 mean 0.3
median 1.5 median 0.25
total 121 total 121
Table 7 - 2005 - 80 Brazilian private companies
Proportion of Independent Directors
Number and percentage of independent directors, for 80 Brazilian private firms which responded to the 2005 Brazil CG Survey and provided data on board composition. In computing proportion of independent directors, percentages are rounded up to next whole number.
No. of Independent Directors number of firms cumulative percent Proportion of Independent Directors number of firms cumulative percent
0 28 35% 0% 28 35%
1 14 53% 1-10% 1 36%
2 16 73% 11-20% 10 51%
3 13 89% 21-30% 9 60%
4 5 94% 31-40% 15 78%
5 0 94% 41-50% 9 89%
6 4 99% 51-60% 5 95%
7 1 100% 61-70% 2 98%
71% or more 1 100%
mean 1.6 mean 0.24
median 1 median 0.2
Table 7 - 2007 - 36 overlap private firms
Proportion of Independent Directors
Number and percentage of independent directors, for 36 Brazilian private firms which responded to the 2005 and 2007 Brazil CG Survey and provided data on board composition. In computing proportion of independent directors, percentages are rounded up to next whole number. These informations are referred to the 2007 Brazil GC Survey.
No. of Independent Directors number of firms cumulative percent Proportion of Independent Directors number of firms cumulative percent
0 7 19% 0% 7 19%
1 6 36% 1-10% 1 22%
2 10 64% 11-20% 7 42%
3 10 92% 21-30% 7 61%
4 1 94% 31-40% 5 75%
5 2 100% 41-50% 4 86%
51-60% 3 94%
61-70% 2 100%
71% or more 0 100%
mean 2 mean 0.29
median 2 median 0.3
total 36 total 36
Table 7 - 2005 - 36 overlap private firms
Proportion of Independent Directors
Number and percentage of independent directors, for 36 Brazilian private firms which responded to the 2005 and 2007 Brazil CG Survey and provided data on board composition. In computing proportion of independent directors, percentages are rounded up to next whole number. These informations are referred to the 2005 Brazil GC Survey.
No. of Independent Directors number of firms cumulative percent Proportion of Independent Directors number of firms cumulative percent
0 12 33% 0% 12 33%
1 3 42% 1-10% 0 33%
2 10 69% 11-20% 3 42%
3 7 89% 21-30% 3 50%
4 1 92% 31-40% 2 56%
5 0 92% 41-50% 9 81%
6 2 97% 51-60% 3 89%
7 1 100% 61-70% 2 94%
71% or more 2 100%
mean 1.9 mean 0.28
median 1.5 median 0.3
total 36 total 36
there is a percentage of independent directors higher in all size quartiles in 2007 versus 2005. There is not a strong trend toward higher percentage independent directors at larger versus smaller firms (within each sample year). This change can also be seen in the sample with 36 companies. In 2005, there were 5 companies (31%) that have no independent directors, in 2007 this number decreased to only 1 company (7%). There are no strong trends of larger companies having more independent directors in relation to small.
Table 8 – 2007 - 121 Brazilian private companies
Board Independence by Size Quartile
Number and percentage of independent directors, by size quartile, for 121 Brazilian private firms which responded to the 2007 Brazil CG Survey and provided data on board composition. Quartiles are based on market capitalization as of Dec. 2007.
Number of independent directors Percentage
Size Quartile
firms in sample
firms with zero
indep. directors
mean median max. mean median
1 37 3 (8%) 2.3 2 5 30 25
2 34 0 (0%) 1.8 2 6 30 30
3 30 7 (23%) 1.9 2 5 34 40
4 20 8 (40%) 1.3 1 5 21 25
total 121 18 (16%) 1.9 1.5 5 30% 25%
Table 8- 2005 - 80 Brazilian private companies
Board Independence by Size Quartile
Board size and percentage for 80 Brazilian private firms which responded to the 2005 Brazil CG Survey. Minimum board size under Brazilian law is 3 directors. Quartiles are based on market capitalizatin as of Jan. 2005. Amounts in R$ millions.
Number of independent directors Percentage
Size Quartile
firms in sample
firms with zero
indep. directors
mean median max. mean median
1 30 8 (27%) 2 2 6 20 25
2 21 9 (43%) 1.4 1 6 17 21
3 18 9 (50%) 1.1 1 4 9 16
4 11 2 (18%) 2 2 7 40 38
Table 8 - 2007 - 36 overlap private firms
Board Independence by Size Quartile
Number and percentage of independent directors, by size quartile, for 36 Brazilian private firms which responded to the 2005 and 2007 Brazil CG Survey and provided data on board composition. Quartiles are based on market capitalization as of Dec. 2007. These informations are referred to the 2007 Brazil GC Survey.
Number of independent directors Percentage
Size Quartile
firms in sample
firms with zero
indep. directors
mean median max. mean median
1 15 1 (7%) 2.3 2 5 27 28
2 3 0 (0%) 2.3 2 3 39 40
3 10 2 (20%) 2.1 2 5 36 31
4 8 4 (50%) 0.9 0.5 3 18 12
total 36 7 (19%) 2 2 5 29% 28%
Table 8 - 2005 - 36 overlap private firms Board Independence by Size Quartile
Number and percentage of independent directors, by size quartile, for 36 Brazilian private firms which responded to the 2005 and 2007 Brazil CG Survey and provided data on board composition. Quartiles are based on market capitalization as of Jan. 2005. These informations are referred to the 2005 Brazil GC Survey.
Number of independent directors Percentage
Size Quartile
firms in sample
firms with zero
indep. directors
mean median max. mean median
1 16 5 (31%) 1.9 2 6 24 24
2 4 1 (25%) 2.7 2.5 6 44 45
3 7 3 (43%) 1.4 1 6 23 13
4 9 3 (33%) 1.8 2 7 31 33
total 36 12 (33%) 1.86 2 7 28% 31%
5.2 Representatives of minority shareholders
Table 9 shows the independent directors who are representatives of minority shareholders (the preferred shareholders or minority common shareholders). The representatives of the minority common shareholders decreased from 42% (22/52) in 2005 to 32% (33/103) in 2007. The representatives of the preferred shareholders also decreased from 42% (20/48) in 2005 to 12% (6/52) in 2007, this large decline may be related to the amount of companies that have preferred stock that has declined over time. In 2005, 84% (74/88) of the companies had preferred shares, while in 2007, this number decreased to 53% (64/121). In the sample of 36 companies there was an increase of the representatives of the preferred shareholders, from 33% (5/15) in 2005 to 42% (10/24) in 2007. The representatives of the minority common shareholders also increased in this period, in 2005, 32% (8/25) of the boards had one or more independent directors representatives of minority common shareholders, while in 2007 , this number increased to 56% (16/29) . We can see that the representation of minorities in these companies has improved over the years. It went from 24% (6/25) in 2005 to 69% (20/29) in 2007, the representation of minorities in these 36 companies; this is related to the many companies that today are listed at Level 2 or Novo Mercado.
Table 9 - 2007 - 103 Brazilian private companies
Whom Do Independent Directors Represent?
Number of directors who represent preferred shareholders or minority common shareholders, for 121 Brazilian private firms which responded to the 2007 Brazil CG Survey, provided data on board composition, and have at least one independent director. Of these firms, 52 have issued preferred shares.
Director represents Number
of Directors
in category
Preferred
shareholders Percent
Minority common shareholders
Percent
Either preferred or
minority common shareholders
Percent
none 46 88% 70 68% 59 57%
1 5 10% 23 22% 31 30%
2 1 2% 7 7% 9 9%
3 0 0% 1 1% 2 2%
4 0 0% 0 0% 0 0%
5 0 0% 1 1% 1 1%
6 0 0% 1 1% 1 1%
Total 52 100% 103 100% 103 100%
one or
Table 9 - 2005 - 52 Brazilian private companies
Whom Do Independent Directors Represent?
Number of directors who represent preferred shareholders or minority common shareholders, for 52 Brazilian private firms which responded to the 2005 Brazil CG Survey, provided data on board composition, and have at least one independent director. Of these firms, 48 have issued preferred shares.
Director represents Number of Directors in category Preferred shareholders Percent Minority common shareholders Percent Either preferred or minority common shareholders Percent
none 28 58% 30 58% 19 37%
1 17 35% 14 27% 16 31%
2 2 4% 7 13% 13 25%
3 1 2% 1 2% 3 6%
4 0 0% 0 0% 1 2%
Total 48 100% 52 100% 52 100%
one or
more 20 42% 22 42% 33 63%
Table 9 - 2007 - 29 overlap private firms
Whom Do Independent Directors Represent?
Number of directors who represent preferred shareholders or minority common shareholders, for 29 Brazilian private firms which responded to the 2005 and 2007 Brazil CG Survey and have at least one independent director in 2007. Of these firms, 24 have issued preferred shares.
Director represents Number of Directors in category Preferred shareholders Percent Minority common shareholders Percent Either preferred or minority common shareholders Percent
none 14 58% 13 45% 9 31%
1 6 25% 11 38% 7 24%
2 2 8% 4 14% 8 28%
3 2 8% 0 0% 4 14%
4 0 0% 0 0% 0 0%
5 0 0% 1 3% 1 3%
6 0 0% 0 0% 0 0%
Total 24 100% 29 100% 29 100%
one or
Table 9 - 2005 - 25 overlap private firms
Whom Do Independent Directors Represent?
Number of directors who represent preferred shareholders or minority common shareholders, for 25 Brazilian private firms which responded to the 2005 and 2007 Brazil CG Survey, and have at least one independent director in 2005. Of these firms, 15 have issued preferred shares.
Director represents Number
of Directors
in category
Preferred shareholders
Percent
Minority common shareholders
Percent
Either preferred or
minority common shareholders
Percent
none 10 67% 17 68% 19 76%
1 3 20% 6 24% 4 16%
2 1 7% 1 4% 0 0%
3 1 7% 1 4% 1 4%
4 0 0% 0 0% 1 4%
Total 15 100% 25 100% 25 100%
one or
more 5 33% 8 32% 6 24%
Until 2006, minority shareholders could elect only one representative member from a list of three names nominated by the controlling shareholder. In 2001, after the last reform of corporate law, preferred shareholders, minority common shareholders, or both together, can vote separately to elect one representative by majority vote of all shares in the indicated group, as follows10:
• Election of a representative of the minority common shareholders, if the minority has at least 15% of total common shares;
• Election of a representative by the preferred shareholders, if the preferred shares totaling at least 10% of total shares11;
• Election of a representative, if none of the above two conditions is satisfied, but all shareholders together have at least 10% of the total shares.
The common shareholders who own at least 10% of all shares can demand the right to cumulative voting. The cumulative voting is not much used in Brazil. Only 17 (14%) who answered the questionnaire in 2007 and 10 (12%) of respondents in 2005 reported
10 Law 6404/76 art. 141, § 4-5, as amended by Law 10.303/2001. These rights are available only to
shareholders who have held shares continuously for the 3 months preceding the meeting
11 Through 2006, the controlling shareholder could require the preferred shareholders to choose their
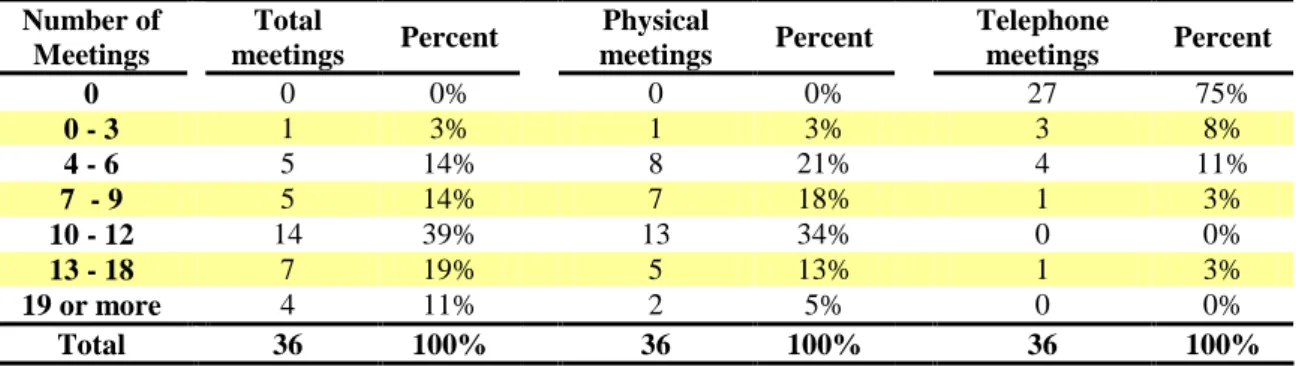
that the cumulative voting was used at least once in the last five years. In 2005, four companies used only once, four companies, only two times, and one company three times. Only one company used the cumulative voting in each year for the past five years. In 2007: seven companies used only once, four companies, two times, six companies used the cumulative voting in each year for the past five years.
Much of the board of Brazilian companies is compounded of non-independent directors. Table 10 presents many companies which have three or more non-independent directors; moreover, there were not many changes from 2005 to 2007. On Table 10 we can check the number of non-independent directors who are employees or former employees, the number of directors who are not employees or former employees, but represent the controlling shareholder and the number who also sit on the boards of one or more related firms. The participation of employees on the board is relatively small, since by law, they can not be more than 1 / 3 of the board. Table 10 shows that much of the board that is not independent is composed of representatives of the family or group controlling of the company. For both samples there was a decrease in the average of the independent directors on the board. In 2005, the average was 5.3 directors non-independent by board, in 2007 that average decreased to 4.9. In the sample of 36 firms, the average in 2005 was 5.6, in 2007 was 5.0. The decrease of the average of the non-independents directors may be related with the increased of representation of minorities on boards.
Table 10 - 2007 - 121 Brazilian private companies
Non-independent Directors
Number of non-independent directors who are (i) officers; (ii) representatives of the controlling shareholder or group, or (iii) also on the boards of one or more related firms, for 121Brazilian private firms which responded to the 2007 Brazil CG Survey (118 responses for board composition and for question about related firms). Percentage is of firms which answered each question.
No. of directors
All non-independent
directors
Percent
Officers or former officers
Percent
Represents controller
(but not officer)
Percent
On the board of
related firm(s)
Percent
0 1 1% 26 22% 39 33% 70 59%
1 4 3% 30 25% 17 14% 9 8%
2 7 6% 25 21% 22 19% 11 9%
3 24 20% 18 15% 12 10% 8 7%
4 23 19% 13 11% 8 7% 5 4%
5 29 25% 5 4% 5 4% 9 8%
6 or more 33 27% 1 1% 15 13% 6 5%
Total 121 100% 118 100% 118 100% 118 100%
mean 4.9 1.8 2.3 1.4
Table 10 - 2005 - 88 Brazilian private companies
Non-independent Directors
Number of non-independent directors who are (i) officers; (ii) representatives of the controlling shareholder or group, or (iii) also on the boards of one or more related firms, for 88 Brazilian private firms which responded to the 2005 Brazil CG Survey (80 responses for board composition; 88 responses for question about related firms). Percentage is of firms which answered each question.
No. of directors
All non-independent
directors
Percent
Officers or former officers
Percent
Represents controller
(but not officer)
Percent
On the board of
related firm(s)
Percent
0 0 0% 14 16% 21 24% 59 67%
1 2 3% 35 40% 9 10% 9 10%
2 4 5% 16 18% 17 19% 4 5%
3 25 31% 12 14% 11 13% 0 0%
4 9 11% 7 8% 7 8% 2 2%
5 10 13% 3 3% 7 8% 3 3%
6 or more 30 38% 1 1% 16 18% 11 13%
Total 80 100% 88 100% 88 100% 88 100%
mean 5.3 1.7 3.1 1.5
Table 10 - 2007 - 36 overlap private firms
Non-independent Directors
Number of non-independent directors who are (i) officers; (ii) representatives of the controlling shareholder or group, or (iii) also on the boards of one or more related firms, for 36 Brazilian private firms which responded to the 2005 and 2007 Brazil CG Survey. Percentage is of firms which answered each question. These informations are referred to the 2007 Brazil GC Survey.
No. of directors All non-independent directors Percent Officers or former officers Percent Represents controller (but not officer) Percent On the board of related firm(s) Percent
0 1 3% 11 31% 14 39% 18 50%
1 1 3% 8 22% 3 8% 3 8%
2 1 3% 6 17% 5 14% 4 11%
3 7 19% 3 8% 5 14% 2 6%
4 5 14% 6 17% 2 6% 3 8%
5 8 22% 2 6% 3 8% 5 14%
6 or more 13 36% 0 0% 4 11% 1 3%
Total 36 100% 36 100% 36 100% 36 100%
mean 5 1.7 2.3 1.7
median 5 1.5 2 1
Table 10 - 2005 - 36 overlap private firms
Non-independent Directors
Number of non-independent directors who are (i) officers; (ii) representatives of the controlling shareholder or group, or (iii) also on the boards of one or more related firms, for 36 Brazilian private firms which responded to the 2005 and 2007 Brazil CG Survey. Percentage is of firms which answered each question. These informations are referred to the 2005 Brazil GC Survey.
No. of directors All non-independent directors Percent Officers or former officers Percent Represents controller (but not officer) Percent On the board of related firm(s) Percent
0 1 3% 6 17% 11 31% 19 53%
1 3 8% 12 33% 2 6% 2 6%
2 1 3% 6 17% 8 22% 4 11%
3 9 25% 6 17% 3 8% 1 3%
4 4 11% 3 8% 2 6% 3 8%
5 4 11% 3 8% 3 8% 4 11%
6 or more 14 39% 0 0% 7 19% 3 8%
Total 36 100% 36 100% 36 100% 36 100%
mean 5.6 1.9 3 1.94
median 5 1.5 2 0
5.3 Chairman and CEO
When CEO and Chairman are the same person, we have a negative aspect mentioned by IBGC that recommends splitting these two positons. CVM also recommends distinction persons occupying the positions of CEO and Chairman12. Based on this characteristic, the recommendations released by the CVM indicate that the board oversees the
management of directors. And, therefore, to avoid conflicts of interest, the chairman should not also be CEO. According to Jensen (1993) "(...) for a board to be effective, it is important to separate the CEO of the Chairman”. In other words, a common governance recommendation is that the CEO and Chairman positions should be split, to prevent the CEO from having too much power over the firm. Most Brazilian companies have different people in these positions, in 2005: 62 of 88 companies (71%) and in 2007: 84 of 121 companies (70%) separated these roles.
5.4 Who composes the board?
The board, according to the CVM, must have five to nine members technically qualified with at least two members with experience in finance and responsibility to monitor more closely the practices adopted13. The IBGC recommends diversifying the board, using criteria such as financial and accounting knowledge. The IBGC also recommends that each company has an audit committee with at least three members, which must have familiarity with finance and accounting practices. In addition, many companies with ADRs are subject to Sarbanes-Oxley Act that establishes requirements for audit committee and a minimum number of independent directors, among others.
The characteristics and experience of directors are summarized in Table 11. It is common to have directors with experience in finance, accounting or law. In both years, the scholars formed smaller numbers: in 2005 only eight of 88 and 2007 only 4 of the 121 companies that responded to this question have one on your board. There is possibly a trend for companies to have more financial experts. Most companies have at least one director who is specialist in finance (74% in 2005 and 80% in 2007). Directors with expertise in accounting are also very popular (57% in 2005 and 58% in 2007). The involvement of politicians or former politicians has increased in 2007 compared to 2005. The decline in participation of foreign directors may reflect the participation of small businesses in the sample. The 36 companies that completed both questionnaires showed similar changes in some aspects of composition of the board in this period.
13