http://dx.doi.org/10.1590/0104-530X2576-15
Resumo: A concentração de propriedade há muito vem sendo estudada para veriicar se impacta no desempenho das empresas. O presente artigo tem por objetivo veriicar se a estrutura de propriedade, mais especiicamente a concentração de propriedade, tem algum impacto no desempenho das empresas do setor elétrico. Embora sejam numerosos os trabalhos que tratam sobre a relação de Desempenho e Concentração de Propriedade, este se propõe a apresentar uma proposta de abordagem metodológica por meio de uma nova combinação de variáveis. O trabalho busca reacender a discussão da concentração de propriedade no Brasil e a identidade desses acionistas em um cenário peculiar de escândalos de má gestão, controle de resultados e corrupção de empresas no Brasil, sob a óptica da relação entre capital privado e público, com a análise sendo feita no setor de energia elétrica. O estudo foi realizado por meio da análise de dados em painel. A amostra compôs-se de 22 empresas brasileiras de capital aberto do setor de energia elétrica analisadas nos anos de 2010 a 2014. Veriicou-se melhor desempenho das empresas privadas em comparação com as públicas, das empresas com ações ordinários nas mãos de apenas um acionista majoritário e relação positiva com o lucro líquido. Por outro lado, as variáveis relativas às ações ordinárias nas mãos de dois maiores acionistas e ativo total apresentaram relação negativa com o desempenho. Palavras-chave: Avaliação de desempenho; Governança corporativa; Econometria.
Abstract: The concentration of ownership has long been discussed in order to assess its impact on business performance. This article aims to verify whether the ownership structure, more speciically the concentration of property, has an impact on the performance of companies of the electricity sector. Although numerous works on the theme have already been produced, this article introduces a new methodological approach by means of a new combination of variables, rekindling the discussion on the concentration of property in Brazil and the identity of these shareholders - in a peculiar scenery of scandals of mismanagement, controlled results, and business corruption in Brazil - from the perspective of the relationship between private and public capital with analysis performed in the electricity sector. The study was conducted through analysis of panel data. The sample analyzed considered 22 Brazilian public companies of the electricity sector between 2010 and 2014. The results show a better performance of the private enterprises in comparison with the public ones; better performance of companies with ordinary shares in the hands of only one majority shareholder; and a positive relationship with net proit. In contrast, the variables concerning common shares in the hands of the two largest shareholders and total assets showed a negative relationship with performance.
Keywords: Performance evaluation; Corporate governance; Econometrics.
Concentration of ownership and performance:
a study in the Brazilian listed companies of the
electric utilities industry
Concentração de propriedade e desempenho: um estudo nas empresas brasileiras de capital aberto do setor de energia elétrica
Naiara Leite dos Santos Sant’Ana1,2 Natália Carolina Duarte de Medeiros3
Sabrina Amélia de Lima e Silva2 João Paulo Calembo Batista Menezes2,4
Caio Peixoto Chain5
1 Departamento de Ciências Contábeis, Universidade Federal de Juiz de Fora – UFJF, CEP 35010-177, Governador Valadares, MG, Brazil, e-mail: [email protected]
2 Programa de Pós-graduação em Administração, Universidade Federal de Minas Gerais – UFMG, Av. Pres. Antônio Carlos, 6627, Pampulha, CEP 31270-901, Belo Horizonte, MG, Brazil, e-mail: [email protected]; [email protected]
3 Departamento de Administração, Centro Universitário de Formiga – UNIFOR, Av. Doutor Arnaldo de Senna, 328, Água Vermelha, CEP 35570-000, Formiga, MG, Brazil, e-mail: [email protected]
4 Departamento de Ciências Contábeis, Universidade Federal dos Vales do Jequitinhonha e Mucuri – UFVJM, CEP 39803-371, Teóilo Otoni, MG, Brazil
5 Programa de Pós-graduação em Administração, Universidade Federal de Lavras – UFLA, Av. Doutor Sylvio Menicucci, 1001, Kennedy, CEP 37200-000, Lavras, MG, Brazil, e-mail: [email protected]
1 Introduction
Studies related to ownership structure have been
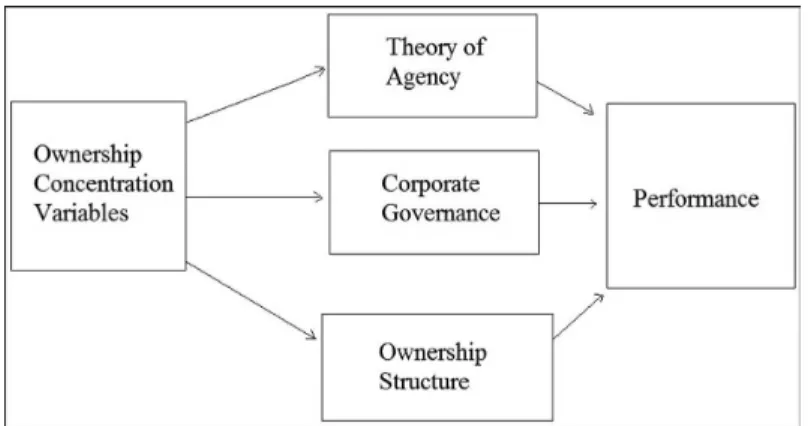
developed, mostly, with the goal of maximizing the company’s value. This work aims at analyzing the concentration of ownership under the scope of the theory of agency and corporate governance, so as to understand its consequences in the company’s
performance. It is understood that the ownership structure
of companies is determined by the concentration of ownership and the identity of its majority shareholder. The concentration refers to the amount of shares held by this majority shareholder. The identity of such majority may be constituted by a family, a bank or other institution, or the government (Campos, 2006; Leal et al., 2002).
The companies present different ownership concentrations. This can cause diverse behaviors displayed by current shareholders, future buyers and the many stakeholders who are interested in the control and ownership of the company, or in its attitudes towards the external environment. Therefore, the structure of ownership is directly linked to concepts that involve the theory of agency and corporate governance – concepts which have a direct impact on the company’s performance.
The theory of agency acknowledges, broadly, the possibility of a divergence of interests between shareholders and managers, where each attempts to maximize their own utility. According to the Brazilian
Institute of Corporate Governance’s (IBGC, 2010)
Code of Better Corporate Governance Practices, there
is a conlict of interests when one of the parts stands
in a biased position in regards to the discussed matter
and still can inluence or make decisions motivated by
interests which are distinct from the organization’s.
In such an environment, Corporate Governance
shows its importance, for it aims at reducing the
informational asymmetry, the conlicts and costs
among agents, and the appearance of errors and frauds, thus making the corporate environment safer for the economic agents that interact with it. Considering this, the present article aims at verifying
the inluence of ownership concentration in the
performance of Brazilian listed companies of the Electric Utilities industry in the years from 2010 to 2014, under the scope of the Theory of Agency and Corporate Governance.
Although a great amount of works have been written about the relationship between performance and ownership concentration, the present article intends to present a new methodological approach through a new combination of variables. This work attempts to revive the discussion on ownership concentration in Brazil and the identity of these holders, in a distinct environment of poor management, control of results and corporate corruption, under the scope of the relationship between private and public capital, with
an analysis centered on the electric utilities industry. There is not a theoretical consensus on the impact of the concentration of ownership in the performance of the companies, therefore the present study attempted
to offer a contribution to the clariication of such
ambiguity by simultaneously estimating positive and negative effects of that concentration.
The choice of this industry sector was motivated by its importance for the country’s economic development and industrial structure, especially in a situation of water rationing in an energy matrix that relies heavily on this resource.
This article begins with this introduction, followed by the literature review which approaches the following sub-topics: Theory of Agency; corporate governance; ownership structure and concentration; ownership structure and performance; electric utilities industry; and similar works. Then, the methodological procedures are presented, followed by the analysis
of the results and the inal considerations.
2 Literature review
2.1 Theory of agency
The relationship between ownership and the
control of the company can conigure itself into a
problem in which the administrator – the one who holds control – could use his power in its own favor, while not prioritizing the company and the interest of its owners, who hold its ownership.
This situation, in which the administrator (agent) acts by maximizing its own utility and not maximizing the owner’s (principal) utility, leading, therefore, the company into having expenses through incentive, monitoring (from the principal) and “concession of
contractual warranties” (from the agent), was deined
by Jensen & Meckling (1976) as constituting the costs
of agency, which come precisely from the conlicts
between agents.
This theory emerged from the works of Alchian & Demsetz (1972) and Jensen & Meckling (1976). Both portrayed the company as a nexus of contracts
between individual production factors. In the theory
of agency, the contracts rule the relationship between principal and agent, in which some decision powers are delegated to the agent through the provision of services to the principal. Considering that the parts seek to maximize their personal satisfaction, in the case that the agent does not act in the best interest of the principal, the principal must surround him or herself of warranties that seek to avoid damage to their interest.
According to Jensen & Meckling (1976, p. 5), the relationship of agency is “[...] a contract in which one or more people – the principal – engage another
person – the agent – to fulill a certain task in their
the agent”. According to the authors, both principal and agent tend to work towards the maximization of their utility, and therefore not always will the agent act according to the principal’s interest.
Still according to Jensen & Meckling (1976),
the divergences between these two parts can be mitigated by two actions taken by the principal and one by the agent. The principal can take two actions which are costly, and can be effected separately or adjoined: a) establishing incentives for the agent to act according to the principal’s interests; and/or b) monitoring the agent’s actions. A kind of action that can be taken by the agent is the concession of contractual warranties. Nevertheless, even with these actions of incentive and monitoring, divergences may still occur between the decisions taken by the agent and those that maximize the principal’s well-being,
which are deined as residual loss.
According to Fama & Jensen (1983), it is not
possible for monitoring and the offering of incentives
to exist without costs. For Eisenhardt (1989), the theory of agency brought two speciic contributions to the organizational thought: the irst is the handling
of information. According to the author, information is dealt with as a commodity within the theory of agency, having a cost and offering the possibility of
being bought. Organizations must invest in information
systems in order to control the agents’ opportunism. The second contribution regard the costs involved with the future of the organization. The future, controlled only partially by the organization’s members, can involve prosperity, bankruptcy or intermediary results.
Other environment-related effects, such
as legislation changes, new competition, and technological innovations, can also affect the future of the organization. These uncertainties are seen by the theory of agency as an exchange between risks and rewards. The implication is that the uncertainties of results, when related to the willingness of taking
risks, must inluence the contracts between agent and principal. For Jensen (1986), managers are encouraged
to lead their companies to a growth beyond optimum size, because the addition of resources under their control leads to a growth in their power and a raise in their compensation. These authors also noticed that
the most common conlict of agency, when installed,
occurs between controlling shareholders and minority
shareholders. In the United States, where a large
portion of the big corporations have their ownership pulverized among several shareholders, when agency
conlicts happen, most of the times, it is in the form
of the expropriation of the shareholders’ wealth by the managers.
According to Young et al. (2008) it must also be
considered that the Agent-Principal problem is more common in developed economies. According to these
authors, the conlict between distinct principal groups,
that is, between controllers and minority shareholders, is more recurring in emerging economies, due to the concentration of ownership in the company and the lack of effective mechanisms of external governance.
The theory of agency has been constantly rethought. The main aspects of this theory under review are related to the notion that, under certain circumstances, it can be the owner who exploits the company and compromises the long-term interests, while the agents use the access to information to provide gains to the company and its shareholders
(Miller & Sardais, 2011).
2.2 Corporate governance
According to Andrade & Rossetti (2004), a single
concept of Corporate Governance has not been used, but rather key-words which link most concepts, such as: shareholder rights, rights of other interested
parts, conlicts of agency, system of values, system
of government, among others.
The irst example of a non-inancial company with diffuse capital was the Dutch East India Company
(Vereenigde Oostindische Compagnie), founded in 1602, in which over a thousand investors put their money and quickly faced corporate governance problems. According to Frentrop (2002, p. 46) and
Morck (2005, p. 21), this was the irst case of a clear conlict between shareholders and managers.
The business world was shaken by crisis that
undermined the inancial market between 2001 and
2003, especially by the corporate scandals which
arose in Europe and in the USA, involving major
companies such as Adelphia, Aol, Enron, Global
Corssing, Merck, Parmalat, Royal Ahold, Tyco,
Vivendi, Warnaco, Wase Management, WorldCom, among others.
Rossoni & Machado-da-Silva (2010) noticed how
the importance of Corporate Governance evolved after the corporate scandals which envolved major companies which were respected up to that point. These scandals led to the disappearance of important business organizations and to the destruction of billions of shareholders’ dollars and thousands of jobs, which caused the adoption of corrective measures, among
which was the approval of the Sarbanes-Oxley Act
by the American Congress.
There was a notable development starting in the 1980’s,
when a movement of institutional investors appeared, mainly associated to North-American pension funds
such as the California Public Employees Retirement System (Calpers) and the Teachers’ Insurance and Annuity Association – College Retirement Equities Fund (TIAA-CREF), trying to make sure that the
Frentrop (2002) argues that the Centre for European
Policy Studies (CEPS) attempted to clarify the term,
but that even for speakers who have English as their
irst language that is no easy task. For the author, the
term has two components: corporate, which refers to the corporation or to big companies, and governance,
which is deined as the act, fact or way of governing. The second component may be the most conlictual
aspect. Due to the correlation between the word
governance with government, public elements get confused with something that belongs completely to the private sector.
Inside academia, different authors offer different deinitions of the term. For Shleifer & Vishny (1997,
p. 737), corporate governance “[...] refers to way in which the companies’ resource suppliers assure that
they will obtain inancial return from their investments”.
According to La Porta et al. (1999), corporate governance is “a set of mechanisms through which external investors can protect themselves from expropriation from the internal”. According to the
Brazilian Commission of Securities (Comissão de Valores Mobiliários, or CVM) (CVM, 2002, p. 1), in
their Guidebook of Recommendations on Corporate Governance, the Governance can be deined as
“[...] the set of practices that aim at optimizing the performance of a company in protecting all interested parts, such as investors, employers and creditors, facilitating the access to capital”.
The good practices of Corporate Governance must be followed by all companies. Among the good Governance practices are concepts of transparency when publicizing the company’s information, equity
among shared information, thus avoiding a conlict
between agents.
According to Silva (2006), from the moment that the Brazilian Institute for Corporate Governance was
created in 1995, this theme became more pervasive in Brazil, and was therefore more discussed.
Silva & Saes (2007) claim that, in order to reach an eficient governance structure, ineficient structures
must be expelled. The time that will be expended and
the dificulties that will be faced will depend on the
company’s rules – formal or informal ones –, which end up privileging certain structures.
Almeida & Almeida (2009) write that the distinct levels of Corporate Governance were created by
the São Paulo Stock Market (BM&FBovespa) in 2008, with the objective of reducing informational
asymmetry and making the publicized information and companies’ operations more transparent. Correia et al. (2011) argue that shareholders wish their investments
to be protected by the companies. In this sense,
governance plays an important role, for it strengthens the protection of the shareholders’ interests against the risk of despoliation by opportunistic managers.
The creation of BM&FBovespa’s classiication of
Corporate Governance levels determines the framing of the company, with the intent of inspiring trustfulness in investors, according to Barbedo et al. (2009). Currently, BM&FBovespa features six segments in their listing: Bovespa Plus [Bovespa Mais], Bovespa Plus level 2, New Market, Level 2, Level 1 and Traditional. Almeida & Almeida claim that after the great business scandals in the last years, the attentions have been turned to companies with trustworthy, faithful and transparent information.
Chhaochharia & Laeven (2009) afirm that the
process of adopting good Corporate Governance practices becomes expensive for the company, and this is one of the reasons why many companies prefer not to conform to these practices or conform only to those which are legally mandatory.
2.3 Structure, ownership concentration and performance
The separation between ownership, represented by shareholders, and the control of the companies, represented by the managers, was initially approached
by Adam Smith in his 1776 The Wealth of Nations
(Smith, 2003). This work highlighted the concerns
with the company’s ownership structure, since it discussed the potential cost for the company in the fact that the manager, not the owner, would have at his or her disposal a money which wasn’t theirs.
Berle & Means (1932) brought the topic of ownership structure back into the light in their work
The Modern Corporation and a Private Property, in which they observed, already at that time, the growth
of companies and the resulting dificulty in keeping
them in the hands of a single proprietor or family. The authors worked on the notion of a pulverization of ownership, reaching initial concepts of a separation between ownership and control.
La Porta et al. (1999) found in their study of shareholding composition, which was based on twenty seven countries including Brazil, that the concentrated ownership structure model is the most frequently seen in the world (they observed a great concentration in the hands of family groups
and of the State), questioning the prevalence of the
pulverization of shareholding preached by Berle & Means (1932). The studies reached the conclusion that few countries present companies with diffuse capital – this model exists mainly in big corporations
in Anglo-Saxon countries such as the United States
and the United Kingdom. Countries such as France,
Italy and Germany are characterized by a strong
concentration of ownership and control.
It can be said that the companies’ ownership structure
may be deined as the mix of capital chosen by the
company to make its investments (Teixeira & Nossa,
2010). In another analysis, Brigham & Houston (1999,
p. 354) state that the expected capital structure can be composed by the “[...] proportion of third-party capital, preferential shares and ordinary shares which will maximize the share price of the company”.
According to Pedersen & Thomsen (1997), the concentration of ownership can be divided as follows: dispersive, when the majority shareholder holds less than 20% of the control; dominant, when the majority shareholder holds between 20% and 50% of control; and majority, when the majority shareholder holds more than 50% of control.
According to Morck (2005), the ownership of most
companies in the USA and in the UK is considerably pulverized. In other parts of the globe, on the other
hand, such as Brazil, for example, one is faced with a reality based on the concentration of ownership, in which very few shareholders hold a considerable portion of the company’s ownership rights. Certain relationships between ownership and control of the company may lead to problems, given that the manager who holds control might effect maneuvers in his own favor, not necessarily prioritizing the interests of the
company and of those who hold ownership (Shleifer & Vishny, 1997; Renders & Gaeremynck, 2012).
For Jensen & Meckling (1976), when a company features a concentrated ownership structure, it can display a better performance, given that it will be
able to more eficiently monitor the agent’s actions.
With concentrated shares under the possession of a shareholder, the company transfers a lot of power to this majority, enabling him or her to better monitor business at a lower cost.
Claessens et al. (2002) found a negative relation between ownership concentration and performance.
This negative relation happens due to conlicts between
majority and minority shareholders. The excessive power in the hands of the biggest shareholders might also lead them to expropriate the companies’ cash
low in order to beneit themselves, and in doing so
might make bad decisions regarding projects and investments for the company, motivated by personal interests.
Leech & Leahy (1991), however, highlight the fact that the concentration of ownership increases the presence of shareholders in the decision-making processes, directing the owners interests and diminishing the agency’s problem, while the shareholders’ identity
in speciic entities allows for the preferences to be shaped by speciic results, better aligning the interests
and mitigating the agency costs.
In a meta-analytic review, Sánchez-Ballesta & García-Meca (2007) conirmed that the empirical
results regarding the relationship between ownership
concentration and performance are conlicting. Their
research was made up of dozens of works published
in the most relevant journals in the ield of inance.
2.4 The electric utilities sector
According to Damasceno et al. (2013), the Brazilian National Electric Energy Agency (ANEEL) has listed in 2012 the rights and duties of consumers and
electric energy distributors, and deined the following
concepts: terms and parameters involved in energy bills; billing modalities; the division of consumers in classes and bands based on the tension of the provision; the instructions for the requirement of new connections and the instructions on how to acquire data and the emission of energy bills.
According to the Brazilian Electric and Electronic
Industry Association (ABINEE, 2015), the electric
utilities industry – comprising of generation, transmission and distribution – has made in 2012 a
total of R$ 15.3 billion, 17% more than in 2011. Apart from that, according to the Inter-Union Statistics and Social-Economic Studies Department, in 2011
the Brazilian electric utilities industry presented a total of 123,013 formal jobs, a number 15.6%
greater than what was registered in 2004 (DIEESE,
2013). When facing this favorable situation, it is important to emphasize that the electric utilities
sector has beneited since 2001 from a great amount
of loans and funding, especially from the Brazilian
National Development Bank (BNDES). According to Siffert et al. (2009), from 2001 to 2002, in the
period that followed the energy rationing in Brazil, the electric utilities companies presented restrictions
in their inancial indicators, and this led the BNDES
to offer emergency loans.
According to Bahnemann (2013), from 2003 to
2012 the BNDES has given a total of R$121.7 billion
in funding for projects in the eletric utilities sector. These projects represented total investments of
R$ 204.7 billion, which turns BNDES into the
preponderant agent in the funding of projects of expansion and energetic infrastructure in Brazil, assuring loans around 60% and 70% of the necessary
capital (Ventura, 2013). Still according to the author, in 2011 alone the funding reached R$10.5 billion. In 2012, this amount reached R$37.48 billion, a number
which owes greatly to the funding of the Belo Monte power plant, in the state of Pará, which will be the largest hydro-electric power plant in the country.
Ventura (2013) argues that the resources made available to the electric utilities sector are compatible with the necessary investments for the expansion of
the national electric system. In this sense, the author
claims that the electric utilities industry does not
face inancial restrictions in the short and mid-term.
that it starts with the 1934 Water Code, through the
Decree 24,643. In 1993 this legislation was revised,
and deep changes were introduced through acts and
decrees. The concessions act number 8,987/1995 was enacted, regulating article 175 of the 1988 Federal
Constitution and instituting rules for the concession biddings, the fees and the concession contracts. Later, the act 9,074/1995 was sanctioned, stipulating a maximum term of 20 years for the concessions.
Siffert et al. (2009) emphasize that the new
regulatory framework of the electric /utilities sector
was created through the act 10,848, in March 15th,
2004, and effected by the Decree 5,163, in July 30th,
2004. The new model for the sector was considered an advance, for it sought to attract both public and private capital, as well as improving the institutional environment for the introduction of new projects,
with a inancial structure based on Project Finance,
which is a form of division of risks with stakeholders. According to Assunção et al. (2015), after 1995 several extensions of the concessions were granted, already within the frames of the act 9,074/95, which caused the expiration of these terms beginning in 2015.
Confronted by this scenario, the Provisional Act
579/2012 was decreed in September 2012, creating
the possibility of an extension of the concessions for up to 30 years. This measure dealt with generation, transmission and distribution concessions, aiming
at reducing the inal cost of electric energy (Brasil,
2012). For the companies of the sector to renew their concessions, they had to submit to the fare’s remuneration that was calculated by ANEEL. This fact caused a great movement in the market, which led to speculations regarding the reduction of the companies’ revenue, even after the government stated its commitment to compensate the companies for the fare’s reduction (Assunção et al., 2015).
When facing this situation which occurred during the period of research for this work, it is worth mentioning that it has not caused interferences in the results, given that studies like that by Assunção et al.
(2015) show that the fulillment of the Provisional Act
579/2012 can be considered a relevant information for the energy sector, but only with the capacity of altering the behavior of the return of the shares only on the day it becomes public.
2.5 Similar works
Souza et al. (2015), in their article “Corporate
Governance and performance of the stocks of companies from the Brazilian electricity sector listed in Bovespa”, investigated the relationship between Corporate Governance and the behavior of the stocks of the companies from the electric utilities sector listed in BM&FBovespa, by means of analyzing the
indicators of Beta Coeficient (volatility) and the
Electric Energy index (Market Value). The period
of analysis was divided into two moments, the irst
ranging from January 1st, 2009 to June 30th, 2011, motivated by the beginning of the USA’s real state
crisis (subprime) and the imminence of the European
inancial crisis. The second moment is deined by the
period after the crisis.
The authors concluded that governance is capable of controlling the volatility of the energy companies’ shares, given that tit keeps them less volatile, even in periods of international crisis; and, furthermore, the variability of these companies’ market value is as much a cause as it is a symptom of said volatility.
Brugni et al. (2012), in their article “IFRIC 12, ICPC 01 and Regulatory Accountability: inluences in the formation of Electric Energy Sector Fees”
[IFRIC 12, ICPC 01 e Contabilidade Regulatória:
Inluências na Formação de Tarifas do Setor de Energia Elétrica], investigated whether or not the
accounting characteristics of IFRIC 12 and ICPC 01 could signiicantly inluence the formation of fees in the Brazilian Electric Energy sector. In justifying
their choice of sector for their analysis, the authors mentioned its economic relevance, its importance to the country’s development and, especially, the
presence of a speciic regulatory accountability. In their results, the authors demonstrated that the
pricing model might be altered, based on the norms, what renders its effective application a complex task in the environment regulated by the National Electric Energy Agency (ANEEL). The work suggests that the main characteristic which substantiates the creation of a regulatory accountability by ANEEL is the impossibility of accounting, by international norms, of the so-called regulatory assets and liabilities, demonstrating how the Brazilian electric utilities
industry is one of the sectors that will have its inancial
demonstrations most affected by the conversion of accounting norms into the international standard.
Oliveira et al. (2015), in their work “Do Governance Practices and Sustainability Inluence Corporate Value?
An Analysis of the Companies of the Brazilian Electric
Sector” [Práticas de Governança e Sustentabilidade Inluenciam o Valor Corporativo? Uma Análise em Companhias do Setor Elétrico Brasileiro], started with a hypothesis that suggested that the creation of a corporate value is positively associated to good governance practices and business sustainability. Thus, their work aimed at analyzing the relationship between performance and social responsibility and governance practices, under the scope of the Theory of Agency
and of the Stakeholders Theory. The research was done on Electric Utilities companies listed in the São Paulo Stock Market, a sector of high environmental
For the data analysis, linear regression models
were estimated with panel data by Random Effects and by Generalized Moments Method – Systemic (GMM-Sys). The results of the research suggested
that companies with adequate governance and social responsibility practices feature a better market value. Among the explanatory variables which presented a positive relation with corporate value are the size and independence of the administration committee, the use of stock options as an incentive plan, the size of the company, as well as its participation in
BM&FBovespa’s Sustainability Index. Nevertheless,
the share concentration and control, and the total value of the incentives plan presented a negative relation with the generation of value. Lastly, the authors concluded that the adoption of such practices, apart from conforming to ethical, legal and social principles, contributes to the generation of corporate value.
Almeida et al. (2013), in their article “Composition of the Administration Committee of the Electric
Energy Sector in Brazil” [Composição do Conselho de Administração no Setor de Energia Elétrica no Brasil], attempted to assess whether or not the composition of committees in the electric utilities sector affects the value and performance of companies. For that end, a bibliographical mapping was done, with an application in the study of an empirical case of said sector. The authors used secondary data based on a
sample of 38 major companies in the period ranging
from 2005 to 2010, which have their shares negotiated at BM&FBovespa. The results of the panel regressions pointed that the size of the administration committee and its independence presented a positive relation, while the percentage of women in the committee did not present a positive relation with the performance variables.
Lima et al. (2013), in their “Social-Environmental Investments and the Financial-Economic Performance of Companies: And Empirical Study of the Electric Energy Sector Companies listed in BM&FBovespa”
[Investimentos Socioambientais e o Desempenho
Econômico-Financeiro das Empresas: Estudo Empírico nas Companhias Abertas Listadas na BM&FBovespa no Setor de Energia Elétrica], investigated the impact of social-environmental investments in the
companies’ inancial performance, represented by the inancial-economic indicators (ROA, ROE, ROM, Ros, net proit, EBITDA and net income). To investigate
this theme, the authors used a quantitative research of a descriptive character, through a bibliographic
and documental procedure. In the data collection, they researched social balances, IBASE models, and inancial-economic information extracted from
Economática, from 40 publicly held companies listed in BM&FBovespa, energy sector, in exercise in 2011. The statistics technique which was used was multiple linear regression, considering as independent
variables the internal, external and environmental social-environmental indicatiors presented on the social balance, and as dependent variables the revenue, net
proit, EBITDA and net income. The results showed
that internal social-environmental investments
positively inluence the inancial economic indicators of net proit, EBITDA and net revenue. They ind not statistically signiicant relation with other indicators.
Bernardino et al. (2014), in the work “Corporate Governance and Company Value: A study of Brazilian companies of the electric sector” [GOVERNANÇA
CORPORATIVA E VALOR DA FIRMA: um estudo de empresas brasileiras do setor elétrico], analyzed the effects of the adoption of corporate governance mechanisms by listed companies of the Brazilian electric utilities industry in their market value, in the
period between 2008 and 2012. For that end, they
created an index of governance quality, through the method of Main Components Analysis, involving twelve variables which are representative of the governance mechanisms acknowledged by the Theory of Agency. The results revealed a negative
and signiicant relation, that might by related to the
particularities of the electric utilities sector, to the little development of the Brazilian capitals market, or even to the companies’ reduced liquidity level.
Bernardino et al. (2015), in the article “Governance
and Eficiency in Companies of the Brazilian Electric Sector”, aimed at relating corporate governance to organizational eficiency. As a result, the authors realized
that the relation between the governance index and
the eficiency score is positive and signiicant, as well a the governance index and the LAJIRDA variable (an indicator of inancial performance), indicating that well governed companies are more eficient.
3 Methodological procedures
3.1 Sample and data source
The sample consisted of publicly held Brazilian companies of the electric utilities sector listed in BM&FBovespa. The data was extracted from annual
inancial statements corresponding to period between
2010 and 2014.
The data was collected from Economática,
BM&FBovespa, External Disclosure System of the Commission of Securities (DIVEXT/CVM). Software R was used for the estimation of parameter
and the conduction of tests, and the data was tabbed on electronic spreadsheets.
According to BM&FBovespa (2015), there are listed 65 companies in the electric utilities industry,
29 (44.62%) of which are classiied in the levels of
corporate governance: (NM) New Market Company [Cia.
Corporativa], (MA) Bovespa Plus [Bovespa Mais], (M2) Bovespa Plus Company Level 2 [Cia. Bovespa
Mais Nível 2] and (MB) Traditional Organized Over-the-Counter Company [Cia. Balcão Organizado Tradicional]. Apart from that, it is relevant to mention that the electric chain of production constitutes of generation, transmission and distribution companies. Transmission and distribution are regulated activities and generation is a competitive activity.
The article aimed at analyzing the population of the electric utilities sector after 2010 through the methodology of panel; however, for it not to become unbalanced, we have chosen, after conferences, to use companies which had all the information needed in the years from 2010 to 2014.
In this interval, the representation of the sample was veriied considering some aspects, such as:
contemplated levels of governance, activities conducted by the company, and its importance for the sector. To check these aspects, information and rankings of the BM&FBovespa’s and the National Electric energy Agency’s websites were used.
On Corporate Governance, of the 29 companies in the population with a classiication in the governance levels, 13 classiied companies were obtained in the sample, constituting 44.83% of the data. It is
noticeable that this percentage is considerably similar to the one previously presented on the percentage of the population of companies with a governance level among the listed companies.
In regards to the activities conducted by the sampled
companies – that is, production, transmission and distribution –, it was possible to verify that 14 companies are present in only one of the segments, 5 develop activities in two segments and only 3 companies are
present in all segments deined by ANEEL. It must
also be emphasized that there is a predominance of
the production and distribution segments, identiied
in 62% of the companies, while only 29% act in the transmission segment – a fact that evidences a tendency to overlook the transmission segment. Finally, we used ANEEL’s 2014 ranking of continuity of service, which is divided into two groups: large and small distributors. The large distributors are those that feature an electric energy market larger than 1TWh a year, while the small distributors are
those that feature a market with an equal or lower value. By assessing the sample, more than 50% of the
companies studied are classiied as large distributors
according to this ranking.
After the previous considerations, we consider that the sample of 22 companies represents well, considering the established criteria.
3.2 Deinition of the variables
The variables analyzed in this article were distributed in four parts, and aiming at reducing possible problems caused by the lack of relevant variables, the research uses the main variables which are pertinent to the
theory of agency and corporate governance. The irst
part is constituted by the variable “performance”; the second by the variable “dummy”, concerning the nature of the companies (public or private); then, the variables related to ownership concentration; and
inally, the control variables: Size and Net Proit. In order to measure performance (“response”
variable), an approximation of Tobin’s Q was used as proxy. According to Famá & Barros (2000), this variable is held as a proxy for a company’s performance. According to Chung & Pruitt (1994)
and Shin & Stulz (2000) apud Famá & Barros (2000),
given the dificulties in obtaining certain inancial data, it is suggested to use simpliied procedures for
the calculation of the “approximate q”. Thus, they
deine the “approximate q” as such Equation 1:
VMA D q
AT
+
= (1)
where: VMA = Market Value of the shares which are negotiated in stockmarkets; D = VCPC – VCAC + VCDLP, where: VCPC = Accounting value of the company’s circulating liabilities; VCAC = Accounting
value of its circulating assets; VCE = Stocks’ accounting
value; VCDLP = Accounting value of the long-term debts; AT = company’s total assets.
Initially, we have proceeded with an analysis of
the variable Tobin’s Q response, through dispersion Graph 1.
Graph 1 presents the calculated value for Q’s Tobin, used as a proxy for the companies’ performance. The horizontal line on the graph represents the variable’s
average for the period under analysis. It can be noted
that the greatest part of information is concentrated between 0.25 and 1.75. Two negative observations were registered, and the observed peak is 3.19.
In order to verify the normality of the response variable, we present the QQ-Plot and the Shapiro
Wilk test to prove the graphic evidence, in Graph 2. Based on the proximity of the data to the transverse normality line, there is evidence that the variable Tobin’s Q is normally distributed. To prove it, we
have conducted the Shapiro Wilk Normality Test, in which the null hypothesis afirms that the sample
comes from a normal population. The ascertained
W statistic was 0.986, while at 5% signiicance the
critical W is 0.974. Therefore, the null hypothesis that the sample comes from a Normal population is not rejected.
A dummy variable was used concerning the nature of the companies (public or private), as suggested in
a pioneer study conducted by Silvestre et al. (2010)
which cite instability and political discontinuity as a hindering factor for public companies of the electric utilities industry. Therefore, private companies are expected to present a superior performance in relation to public ones.
In order to verify the impact of ownership
concentration on the performance of the listed Brazilian
companies of the energy sector, we used variables related to the percentage of ordinary shares in the hands of the greater shareholder and of the two greatest shareholders. The choice of considering only ordinary stocks is due to the fact that the Brazilian companies raise funds on the stock market, in general, through the emission of shares that do not grant voting rights to its owners, and even though the concentration of
ownership positively inluences the market value since there is a more eficient managing monitoring
of the controlling shareholder, according to a study
conducted by Caixe & Krauter (2013). In this sense,
it is expected for the performance of the companies with ordinary actions in the hands of the greatest shareholder to be better than those which have more than one shareholder with ordinary shares.
As a way of mitigating the problems caused by variables which are not a part of the model, control
variables concerning the inancial-economic situation were included, speciically the size of the companies and their net proit. The larger the company, the larger
the agency problems and the monitoring costs, which reduces their market value. According to Caixe &
Krauter (2013), in this manner the net proit will also
be affected, since it is a determinant variable for the trade-off between selling, buying or keeping shares.
Chart 1 presents the variables used and the sign expected by the researchers and the Figure 1 presents the conceptual structure of this paper.
Graph 2. QQ-Plot of the Dependent Variable Tobin’s Q from 2010 to 2014. Source: Developed by the authors (2015).
Chart 1. Variables used in the research.
Group Variable Description Expected
Sign Performance Variable
(Dependent) QTob Approximated Tobin’s Q +
Dummy Variable
(Independent) PRPU Dummy variable: Value 1 is attributed to private compaies and 0 to public ones +
Concentration Variables (Independent)
ORD1 Percentage of ordinary shares in the hands of the greatest shareholder +
ORD2 Percentage of ordinary shares in the hands of the 2 greatest shareholders
-Control Variables
(Independent) LOGAT Size – calculated by the natural logarithm of the total asset
-LL Companies’ Net Proit +
3.3 Data handling and analysis
The Panel Data have the characteristic of presenting a characteristic that contemplates two dimensions: time and space. Thus, a better investigation of the dynamic of the shifts in the variables can be perceived, making it possible to consider the effect of the non-observed variables. According to Maddala
(2003, p. 308), the term “panel data” refers to the
set of data obtained on the same individual over the course of several time periods.
According to Gujarati (2006), there are two forms
of panel data: balanced and unbalanced. On a balanced
panel, the same T periods can be observed for the
same units of the N transverse cut. In an unbalanced
panel, on the other hand, some units of the transverse cut do not have some periods of analysis.
According to Wooldridge (2006), for the handling
of panels, one must highlight the ixed effects and
the random effects. The forme is applied directly to unbalanced panels. This model allows the interception to vary in relation to each unit of the transverse cut,
taking into consideration the speciic characteristics of each one, but assuming that the angular coeficients are the same among them. The estimator of ixed effects
considers an arbitrary correlation, characteristics which are not observed of each unit of the transverse cut, and the independent variables on any period of time. The generic Equation 2 is presented as follows:
0 1 1 2 2 3 3
it i it it it it
Y =β +βX +β X +β X +u (2)
When dealing with random effects, as opposed
to ixed effects, it is assumed that the non-observed
characteristics are correlated to the explicative variables. The generic Equation 3 can be represented thus:
0 1 1 2 2 3 3
it it it it it
Y =β +βX +β X +β X +w (3)
The difference between the two models is that in
the case of ixed effects, each unit of the transverse
cut has its own interception value, in every N value
for N units of the transverse cut. On random effects, the interception β0 represents the average value of
all the interceptions of the transverse cut and the error element represents the random deviation of the individual interception from its average value
(Gujarati, 2006). In order to decide which model to
use, the Hausman test is applied
4 Results
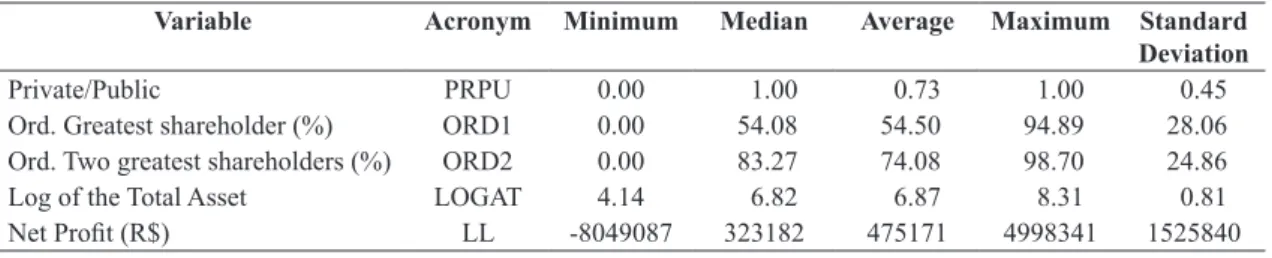
Table 1 presents the descriptive analysis of the variables which were used in this study. The goal
of Descriptive Statistics is to summarize the main
characteristics in a set of data. When confronted with a vast list of data, descriptive tables help grouping information in a way that allows them to be analyzed. Through measures or numeric summaries we can obtain important information regarding the set of data, such as: the central tendency, variability, symmetry, extreme values and discrepant values.
The “public private” variable is a dummy, and the average of 0.73 reveals a greater concentration of private companies. Concerning concentration
of ownership, it can be veriied that, in average,
54.50% of the shares are in the hands of a single
shareholder, and 74.08% are held by the two greatest shareholders. As for the variable “net proit”, an
elevated standard deviation can be noticed, with an
average of R$475,171.00.
Table 2 presents the correlations between the regressing variables, where, as expected, greater
correlations between ORD1 and ORD2 can be noticed (67.87%). In general, there were presented small corrections. It must be emphasized that tests of correlation of signiicance to the pairs were conducted.
The data was organized in a balanced panel, and
the models of ixed effects and random effects were
adjusted. The Hausman test is structured on the following hypothesis and it is used to choose between the models; H0: random effects model is preferable;
H1: ixed effects model is preferable. The p-value for
the test was 0.0364, indicating the rejection of the null
hypothesis. Therefore, through the Hausman test, it is
considered that the ixed effects model is better than
the random effects. Thus, the estimated regression model takes the following form of Equation 4:
0 1 2
3 4 5
1
2
QTOB PRPU ORD
ORD LOGAT LL
= + + +
+ + +
β β β
β β β ε (4)
After the evaluation, the following results are presented:
It can be noted from Table 3 that all variables in
the model were signiicant at 5% (p-value lower than 0.05). The interception’s signiicance displays the
existence of performance even when the explicative variables are zeroed. The relation between the dummy
for the classiication of the companies in public or
private indicated that the fact that a company is private implicates in an increase of 0.4264 units of
performance, corroborating Silvestre et al. (2010). On ownership concentration, the variable ORD1
had the expected positive result, indicating that by increasing the concentration of shares held by a single shareholder, performance is enhanced. The hypothesis considered for such result point to the fact of ownership concentration reducing agency costs, given that there
is a mitigation of the conlict of interests between
owner and manager, in which the former exercises a
direct control over the latter. Variable ORD 2, on the other hand, presents a negative coeficient, showing
that the lower the ownership concentration, the worse is the performance, given that there is an increase in monitoring costs.
LOGAT was used as a control variable, displaying a
negative sign, corroborating the results of Gugler et al.
(2008) and Caixe & Krauter (2013), who state that
a company’s size impacts negatively in its market
value, pointing out that large corporations are subject to greater agency problems and, consequently, higher monitoring costs, which reduce their performance.
As for Net Proit, the positive sign was expected, given that an increase in it points out, as a irst indicative,
a maximization of the company’s results.
The determination coeficient which was obtained
was of 51.33%, indicating the percentage of the variable response which the regressing explain. As a more
robust indicator, the adjusted R2 was used, which takes
into consideration the amount of degrees of liberty in the model, and in it the percentage of variation
which was explained was of 48.53%. The F Test of general signiicance of the model presented a p-value approximately null, indicating its insigniicance.
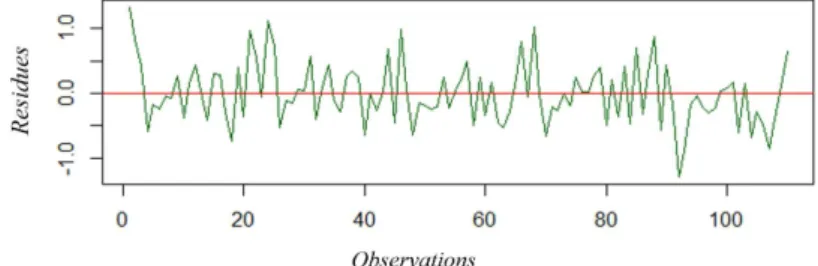
For the validation of the proposed regression model, we proceeded with the analysis of the normality of
residues via Shapiro-Wilk, Heterocedasticity and Serial Self-correlation. Graph 3 shows the distribution of residues in the model, where the horizontal line represents the series’ average, null, as desired.
Graph 4 shows the density curve of a normal distribution alongside the residues’ histogram.
In order to conirm the indications of normality
provided by the graphic analysis, we proceeded to
Table 1. Descriptive statistics of the regressing variables.
Variable Acronym Minimum Median Average Maximum Standard
Deviation
Private/Public PRPU 0.00 1.00 0.73 1.00 0.45
Ord. Greatest shareholder (%) ORD1 0.00 54.08 54.50 94.89 28.06
Ord. Two greatest shareholders (%) ORD2 0.00 83.27 74.08 98.70 24.86
Log of the Total Asset LOGAT 4.14 6.82 6.87 8.31 0.81
Net Proit (R$) LL -8049087 323182 475171 4998341 1525840
Source: Elaborated by the authors (2015).
Table 2. Correlation between regressing variables.
PRPU ORD1 ORD2 LOGAT LL
PRPU 1.0000
ORD1 0.2624 1.0000
ORD2 0.0703 0.6787 1.0000
LOGAT -0.3487 -0.1142 -0.2288 1.0000
LL -0.0095 -0.1271 -0.2499 0.0826 1.0000
Source: Developed by the authors (2015).
Table 3. Coeficient results and P-value.
Variables Coeficient P-value
Interception (β0) 3.2196 0.0000
PRPU(β1) 0.4264 0.0004
ORD1(β2) 0.0116 0.0033
ORD2(β3) -0.0122 0.0169
LOGAT(β4) -0.3392 0.0004
LL(β5) 6.2878 0.0464
conduct the Shapiro-Wilk test, in which the rejection
of the null hypothesis indicates that residues do not follow a normal distribution. The calculated test
statistic was of 0.9869, with a p-value of 0.3623,
indication the non-rejection of Ho, that is, the residues are normal.
The Breusch-Pagan test is widely used to test the null hypothesis that the variations of the errors are equal (homocedasticity). The calculated test statistic was of 13.9952, with a p-value of 0.1564, indicating
that at a signiicance level of 5%, the variation of the
errors is homocedastic.
At last, the self-correction residues test of Breusch Godfrey is elaborated on the hypothesis of the terms
of error not presenting self-correction of irst order, with an evaluated p-value of 0.5068, what indicates the
absence of self-correlation due to the non-rejection of the null hypothesis. Graph 5 presents the correlogram
which reafirms the test’s result.
5 Final considerations
This article aimed at verifying the inluence of
ownership concentration on the performance of listed Brazilian companies of the electric utilities industry,
in the years between 2010 and 2014, under the scope of the Theory of Agency and Corporate Governance.
In what concerns ownership concentration, it was
possible to verify a large concentration of ordinary shares in the hands of the two greatest shareholders. This scenario can, in itself, affect the company’s performance, evaluated in this work by using the metric of the approximated Tobin’s Q, which allowed us to analyze a positive relation when held by one shareholder and negative when held by two shareholders. Conceptually, ownership concentration is something which should be avoided, according to the Good Practices of Corporate Governance, for several reasons, among which are the informational asymmetry, transparency, results management, frauds and accounting errors. However, when analyzed
under the scope of the Theory of Agency, Ownership
Concentration tends to enhance the company’s Performance, due to the reduction of agency costs in what concerns the reduction of the Monitoring Costs of the Principal towards the Agent.
When confronting Corporate Governance with the Theory of Agency in this work, with face a
possible ideal margin of Ownership Concentration
Graph 3. Residues of the adjusted Fixed Effects Model. Source: Developed by the authors (2015).
Graph 4. Residues’ histogram of the adjusted Fixed Effects Model. Source: Developed by the authors (2015).
for the data of this study. This can be inferred
by the result of the relation between Ownership
Concentration and Performance, for the sample in
question, which resides between 54.50% and 74.08%.
Another possible explanation for the inversion of
the Performance-Ownership Concentration relation
might be anchored on the increase of the number of
conlicts of interests at the moment when another majority shareholder is added. These conlicts are a
result of the diverging interests when it comes to the maximization of each of their own utilities.
The literature presents ambiguous discussions, and so do the results of empirical works on the subject of
Ownership Concentration and Performance. Positive
and negative relations can be perceived between ownership concentration and performance, and both
are coherently justiiable in the literature. It is also
worth mentioning the relationship between companies of the sector which feature a structure composed
by the State, in the analysis we veriied a superior
performance in the predominantly private companies,
as opposed to the indings regarding the public ones,
which presented an inferior performance, probably, according to the literature, due to the instability and political discontinuity. Much has yet to be studied
in order to reach some parameters. In these studies,
one must pay attention to the legislation and to the cultural differences between the countries, as well as
the characteristics and peculiarities of the sector. It is
suggested that other works be conducted, aiming at
comparing the inluence of ownership concentration
among different sectors. The importance of more studies concerning the Electric Utilities sector in Brazil is noticeable, given the current water crisis faced by the country.
References
Alchian, A., & Demsetz, H. (1972). Production, information costs and economic organization. The American Economic Review, 62(5), 777-795.
Almeida, J. E. F., & Almeida, J. C. (2009). Auditoria e earnings management. estudo empírico nas empresas abertas auditadas pelas Big Four e Non Big Four. Revista Contabilidade e Finanças, 20(50), 52-74.
Almeida, R. S., Klotzle, M. C., & Pinto, A. C. F. (2013). Composição do conselho de Administração no setor de energia elétrica do Brasil. Revista de Administração da UNIMEP, 11(1), 156-180. http://dx.doi.org/10.15600/1679-5350/rau.v11n1p156-180.
Andrade, A., & Rossetti, J. P. (2004). Governança corporativa: fundamentos, desenvolvimento e tendências. São Paulo: Atlas.
Associação Brasileira da Indústria Elétrica e Eletrônica – ABINEE. (2015). Desempenho setorial. São Paulo: ABINEE. Recuperado em 22 de agosto de 2015, de http://www.abinee.org.br/abinee/decon/decon15.htm
Assunção, T. N., Takamatsu, R. T., & Bressan, V. G. F. (2015). Os impactos da medida provisória 579 nos retornos das ações de companhias de energia elétrica. Revista de Gestão, Finanças e Contabilidade, 5(2), 38-53. http://dx.doi.org/10.18028/2238-5320/rgfc. v5n2p38-53.
Bahnemann, W. (2013, 19 de setembro). BNDES prevê desembolsar R$ 19 bi para elétricas em 2013. São Paulo: Exame.com. Recuperado em 12 de agosto de 2015, de http://exame.abril.com.br/economia/noticias/ bndes-preve-desembolsar-r-19-bi-para-eletricas-em-2013 Barbedo, C. H., Silva, E. C., & Leal, R. P. C. (2009).
Probabilidade de informação privilegiada no mercado de ações, liquidez intra-diária e níveis de governança corporativa. Revista Brasileira de Economia, 63(1), 51-62. http://dx.doi.org/10.1590/S0034-71402009000100004. Berle, A. A., & Means, G. C. (1932). The modern corporation and private property. New Brunswick: Transaction Publishers.
Bernardino, F. F. M., Peixoto, F. M. & Ferreira, R. N. (2015). Governança e eficiência em empresas do setor elétrico brasileiro. Pretexto, 16(1), 36-51.
Bernardino, F. F. M., Peixoto, F. M., & Ferreira, R. N. (2014). Governança corporativa e valor da firma: um estudo de empresas brasileiras do setor elétrico. Revista Eletrônica de Ciência Administrativa, 13(2), 185-202. http://dx.doi.org/10.5329/RECADM.2014014. BM&FBovespa. (2015). Empresas listadas. São Paulo:
BM&FBovespa. Recuperado em 20 de junho de 2015, de http://www.bmfbovespa.com.br/pt_br/produtos/ listados-a-vista-e-derivativos/renda-variavel/empresas-listadas.htm
Brasil. (2012, 12 de setembro). Medida Provisória nº 579, de 11 de setembro de 2012. Dispõe sobre as concessões de geração, transmissão e distribuição de energia elétrica, sobre a redução dos encargos setoriais, sobre a modicidade tarifária, e dá outras providências. Brasília, DF: Diário Oficial da República União. Recuperado em 5 de janeiro de 2013, de http://www.planalto.gov.br
Brigham, E. F., & Houston, J. F. (1999). Fundamentos da moderna administração inanceira. Rio de Janeiro: Campus.
Brugni, T. V., Rodrigues, A., Cruz, C. F., & Szuster, N. (2012). IFRIC 12, ICPC 01 e contabilidade regulatória: influências na formação de tarifas do setor de energia elétrica. Sociedade, Contabilidade e Gestão, 7(2), 104-119. Caixe, D. F., & Krauter, E. (2013). A influência da
estrutura de propriedade e controle sobre o valor de mercado corporativo no Brasil. Revista Contabilidade & Finanças, 24(62), 142-153. http://dx.doi.org/10.1590/ S1519-70772013000200005.
Jensen, M. C. (1986). Agency costs of free cash flow, corporate finance and takeovers. The American Economic Review, 76(2), 323-329.
Jensen, M. C., & Meckling, W. H. (1976). Theory of the firm: Managerial behavior, agency costs and ownership structure. Journal of Financial Economics, 3(4), 305-360. http://dx.doi.org/10.1016/0304-405X(76)90026-X.
Kronbauer, C. A., Souza, M. A., Ott, E., & Collet, C. J. (2010). Evidenciação e análise de carga tributária: um estudo em empresas brasileiras do setor de energia elétrica. Revista de Contabilidade e Organizações, 3(7), 3-24. La Porta, R., Lopez-De-Silanes, F., & Shleifer, A. (1999).
Corporate ownership around the world. The Journal of Finance, 54(2), 471-518. http://dx.doi.org/10.1111/0022-1082.00115.
Leal, R. P. C., Silva, A. L. C., & Valadares, S. M. (2002). Estrutura de controle das companhias brasileiras de capital aberto. Revista de Administração Contemporânea, 6(1), 7-18.
Leech, D., & Leahy, J. (1991). Ownership structure, control type classifications and performance of large British companies. The Economic Journal, 101(409), 1418-1437. http://dx.doi.org/10.2307/2234893.
Lima, A. A. P., Mello, L. C. O., Pessoa, M. N. M., Cabral, A. C. A., Rebouças, S. M. D. P., & Santos, S. M. (2013). Investimentos socioambientais e o desempenho econômico-financeiro das empresas: estudo empírico nas companhias abertas listadas na BM&F Bovespa no setor de energia elétrica. In Anais do XX Congresso Brasileiro de Custos. São Leopoldo: ABC.
Maddala, G. S. (2003). Introdução à econometria (3. ed.). Rio de Janeiro: LTC.
Miller, D., & Sardais, C. (2011). Angel agents: agency theory reconsidered. The Academy of Management Perspectives, 25(2), 6-13. http://dx.doi.org/10.5465/ AMP.2011.61020798.
Morck, R. K. (2005). A history of corporate governance around the world. Chicago: The University of Chicago Press.
Oliveira, I. G. S., Silva Neto, E. R., Cardoso, S. P., & Campos, G. M. (2015). Práticas de governança e sustentabilidade influenciam o valor corporativo? Uma análise em companhias do setor elétrico brasileiro. In Anais do VI Congresso Nacional de Administração e Contabiliade – AdCont. Rio de Janeiro: AdCont. Recuperado em 15 de janeiro de 2016, de http//: adcont. ppgcc.ufrj.br
Pedersen, T., & Thomsen, S. (1997). European patterns of corporate ownership: a twelve-country study. Journal of International Business Studies, 28(4), 759-778. http:// dx.doi.org/10.1057/palgrave.jibs.8490118.
Renders, A., & Gaeremynck, A. (2012). Corporate governance, agency conflicts and firm value in European listed companies. Corporate Governance: An International Review, 20(2), 125-143. http://dx.doi.org/10.1111/j.1467-8683.2011.00900.x.
Chhaochharia, V., & Laeven, L. (2009). Corporate governance norms and practices. Journal of Financial Intermediation, 18(3), 405-431. http://dx.doi.org/10.1016/j. jfi.2008.10.001.
Chung, K., & Pruitt, S. (1994). A simple aproximation of Tobin’s Q. Financial Management, 23(3), 70-74. http:// dx.doi.org/10.2307/3665623.
Claessens, S., Djankov, S., Fan, J. P. H., & Lang, L. H. P. (2002). Disentangling the Incentive and Entrenchment Effect of Large Shareholdings. The Journal of Finance, 57(6), 2741-2771. http://dx.doi.org/10.1111/1540-6261.00511.
Comissão de Valores Mobiliários – CVM. (2002). Recomendações da CVM sobre governança corporativa. Rio de Janeiro: CVM. Recuperado em 8 março de 2015, de http://www.ecgi.org/codes/documents/cartilha.pdf
Correia, L. F., Amaral, H. F., & Louvet, P. (2011). Um índice de avaliação da qualidade da governança corporativa no Brasil. Revista Contabilidade & Finanças, 22(55), 45-63. http://dx.doi.org/10.1590/S1519-70772011000100004. Damasceno, D. D., Meireles, R. S., & Moscoso, M. N.
(2013). A qualidade de energia elétrica e eficiência energética: “um estudo de caso no Hospital Divina Providência”. Revista de Engenharia Elétrica do Instituto de Estudos Superiores da Amazônia, 1(1), 1-8. Recuperado em 01 de dezembro de 2015, de wwwe. iesam-pa.edu.br/ojs/índex.php
Departamento Intersindical de Estatística e Estudos Sócio-econômicos – DIEESE. (2013). Boletim do Setor Elétrico. São Paulo: DIEESE. Recuperado em 22 de agosto de 2015, de http://www.dieese.org.br/estudosetorial/2013/ boletimsetoreletricon1.pdf
Eisenhardt, K. M. (1989). Agency Theory: an assessment and review. Academy of Management Review, 14(1), 57-74. Fama, E. F., & Jensen, M. C. (1983). Separation of ownership
and control. The Journal of Law & Economics, 26(2), 301-325. http://dx.doi.org/10.1086/467037.
Famá, R., & Barros, L. A. B. (2000). Q de Tobin e seu uso em finanças: aspectos metodológicos e conceituais. Caderno de Pesquisas em Administração, São Paulo, 7(4), 27-43.
Frentrop, P. (2002). A history of corporate governance: 1602-2002. Amsterdam: Deminor.
Gugler, K., Mueller, D. C., & Yurtoglu, B. B. (2008). Insider ownership, ownership concentration and investment performance: an international comparison. Journal of Corporate Finance, 14(5), 688-705. http://dx.doi. org/10.1016/j.jcorpfin.2008.09.007.
Gujarati, D. (2006). Econometria básica. Rio de Janeiro: Elsevier.
Silvestre, B. S., Hall, J., Matos, S., & Figueira, L. A. P. A. (2010). Privatização: bom ou ruim? Lições do setor de distribuição de energia elétrica do nordeste brasileiro. Revista de Administração de Empresas, 50(1), 94-111. Smith, A. (2003). The wealth of nations. Bantam Classics. Souza, G. H. S., Lima, N. S., Barbosa, F. B., Coutinho, A.
C., & Albuquerque, A. (2015). Corporate governance and performance of the stocks of companies from the Brazilian electricity sector listed in Bovespa. Revista de Negócios, 20(1), 13-28. http://dx.doi.org/10.7867/1980-4431.2015v20n1p13-28.
Teixeira, E. A., & Nossa, V. (2010). Sinalizando responsabilidade social: relação entre o índice de sustentabilidade empresarial e a estrutura de capital das empresas. In Anais do 4º Congresso ANPCONT. Blumenau: FURB.
Ventura, A., Fo. (2013). Energia elétrica no Brasil: contexto atual e perspectivas.Interesse Nacional, 6(21), 9-16. Wooldridge, J. M. (2006). Introdução à econometria: uma
abordagem moderna. Pioneira Thomson Learning.
Young, M. N., Peng, M. W., Ahlstrom, D., Bruton, G. D., & Jiang, Y. (2008). Corporate governance in emerging economies: a review of the principal-principal perspective. Journal of Management Studies, 45(1), 196-220. http:// dx.doi.org/10.1111/j.1467-6486.2007.00752.x. Rossoni, L., & Machado-da-Silva, C. L. (2010). Institucionalismo
organizacional e práticas de governança corporativa. Revista de Administração Contemporânea, 14, 173-198. http://dx.doi.org/10.1590/S1415-65552010000600008. Sánchez-Ballesta, J. P., & García-Meca, E. (2007). A
meta-analytic vision of the effect of ownership structure on firm performance. Corporate Governance: An International Review, 15(5), 879-892. http://dx.doi. org/10.1111/j.1467-8683.2007.00604.x.
Shin, H., & Stulz, R. (2000). Shareholder wealth and irm risk (Dice Center Working Paper, 2000-19). Columbus: Ohio State University.
Shleifer, A., & Vishny, R. W. (1997). A Survey of corporate governance. The Journal of Finance, 52(2), 737-783. http://dx.doi.org/10.1111/j.1540-6261.1997.tb04820.x. Siffert, N. F., Fo., Alonso, L. A., Chagas, E. B., Szuster, F.
R., & Sussekind, C. S. (2009). O Papel do BNDES na expansão do setor elétrico nacional e o mecanismo de Project finance. BNDES Setorial, 29, 3-36.
Silva, C. L., & Saes, M. S. M. (2007). Governance structure and transaction cost: relationship between strategy and asset specificity. Nova Economia, 17(3), 443-468. http://dx.doi.org/10.1590/S0103-63512007000300004. Silva, E. C. (2006). Governança corporativa nas empresas: