THE
RELATIONSHIP
BETWEEN
SCHOOL
VIOLENCE
AND
STUDENT
PROFICIENCY
E
DSONR.
S
EVERNINIS
ERGIOF
IRPOOutubro
de 2009
T
Te
ex
xt
to
os
s
p
p
a
a
ra
r
a
D
Di
is
sc
cu
us
ss
sã
ão
o
TEXTO PARA DISCUSSÃO 236• OUTUBRO DE 2009 • 1
Os artigos dos Textos para Discussão da Escola de Economia de São Paulo da Fundação Getulio
Vargas são de inteira responsabilidade dos autores e não refletem necessariamente a opinião da
FGV-EESP. É permitida a reprodução total ou parcial dos artigos, desde que creditada a fonte.
Escola de Economia de São Paulo da Fundação Getulio Vargas FGV-EESP
Edson R. Severnini
Department of Economics, UC Berkeley
Sergio Firpo
Escola de Economia de São Paulo, EESP-FGV
MARCH 2009
Abstract
School violence has recently become a central concern among teachers, students, students' parents and policymakers. Violence can induce behaviors on educational agents that go against the goals of improving the quality of education and increasing school attendance. In fact, there is evidence that school environmental characteristics and student performance and behavior at school are related. Although school violence may have a direct impact on students’ performance, such impact has not yet been quantified. In this paper, we investigate this issue using Brazilian data and show that, on average, students who attended more violent schools had worse proficiency on a centralized test carried out by the Brazilian Ministry of Education, even when we controlled for school, class, teachers and student characteristics. We also show that school violence affects more the students from the bottom of the proficiency distribution. Furthermore, we find out that besides the direct effect on student proficiency, it seems that school violence has an indirect effect on it operating through teacher turnover. Indeed, we show that the occurrence of violent episodes in a school decreases the probability of a class in that school having only one teacher during the academic year, and increases the probability of that class having more than one teacher (teacher turnover).
Keywords
1. Introduction
Recently, teachers, students, students' parents and policymakers have been extremely
worried about school violence. This concern is fair, since violence can induce some kinds of
behavior on educational agents, which go against the goals of improving the quality of
education and increasing school attendance. In fact, there is psychological evidence that
school environmental characteristics and student performance and behavior at school are very
related (Haller, 1992; Fowler and Walberg, 1991; Pittman and Haughwout, 1987), and that
exposure to violence in the neighborhood and emotional and behavioral outcomes in children
and youth are closely connected (Bowen and Bowen, 1999; Sampson, Raudenbush, and Earls,
1997; Berton and Stabb, 1996; Bowen and Chapman, 1996; Hill, Levermore, Twaite, and
Jones, 1996; Cooley-Quille, Turner, and Beidel, 1995; Richters and Martinez, 1993). On the
one hand, the lack of safety in schools sometimes obliges principals and teachers to reduce the
requirements in the educational process. On the other hand, students can have difficulty
concentrating during classes and eventually quit school. Indeed, a survey carried out by
UNESCO in 2000 in fourteen Brazilian capitals showed that nearly half of teachers lose their
motivation to work due to school violence, one third of them diminishes the rigorousness with
which they lead their pedagogical activities, one fourth has difficulty concentrating and show
unwillingness to work, and one fifth responds to the threats and/or violent events by asking to
get transferred to another school, thus generating teacher turnover. Furthermore, roughly half
of the students have concentration problems because of violence within and around schools,
one third of them feels nervousness in face of violent acts and, finally, one third reacts with
unwillingness to go to school.
Although school violence directly affects human capital accumulation, its effects on
student performance has almost not been studied. Neither the literature on educational
production function nor the literature on the economic consequences of crime have mentioned
the effects of school violence on student achievement. The main reason is the lack of data.
Grogger (1997) was the pioneer in analyzing the effects of school violence on economic
outcomes. This author showed that that violence had important effects: moderate levels of
violence reduced the likelihood of high school graduation by 5.1 percent and diminished the
probability that a student would attend college by 6.9 percent. Lazear (2001) studied this issue
theoretically and showed that the presence of disruptive students in a classroom could reduce
the performance of their peers. Figlio (2005) and Kinsler (2006) found evidence supporting
In this paper, we take advantage of the SAEB 2003, a unique dataset provided by the
Brazilian Ministry of Education which contains indicators of violence within and around
schools and educational variables, to give evidence of the direct relationship between school
violence and student proficiency and of the indirect relation between them, which seems to
operate through teacher turnover. We follow Grogger’s strategy for measuring violence with
aggregate indicators. Nevertheless, while that author analyzes the impact of school violence
on educational attainment (quantity of education), we investigate the effect of such violence
on student proficiency (quality of education). We therefore intend to contribute to the
understanding of school violence and to the formulation of public policies.
Our main results indicate that students who attend more violent schools usually have a
worse performance on proficiency tests, even when the attributes of students, classes, teachers
and schools were controlled for. We also find evidence that violence affects more students at
the lower tail of the proficiency distribution. Besides the direct relationship between school
violence and proficiency, there seems to be an indirect association between these variables
operating through increase in teacher turnover. For all these results, one should emphasize the
deleterious effect of the presence of drugs at schools: drug dealing and/or consumption seems
to undermine the motivation of both students and teachers.
This paper is structured as follows. In the next section, we describe the database and
the main characteristics of our sample, especially concerning school violence. In Section 3,
we explain our empirical strategy: how we construct our variables of interest and what our
econometric model looks like. In Section 4, we present our results and, finally, we conclude
in Section 5.
2. Data
2.1. Database and sample
The data used in this study were obtained from the National Basic Education
Evaluation System (SAEB), conducted by the National Institute of Educational Studies and
Research Anísio Teixeira, accredited with the Brazilian Ministry of Education (INEP/MEC).
SAEB collects information about students, teachers and school principals from a sample of
public and private Brazilian schools every two years. Each selected student does a test – either
on Portuguese or on Mathematics –, and answers a questionnaire about his/her study habits
questionnaires about their profiles and their teaching practices, about management
mechanisms and about the school’s infrastructure.
Even though there are available data since 1995, in the present paper, we use only the
2003 database, because it was the first one that contained information on school violence. In
addition, we work only with public schools as violence episodes tend to occur more often in
public schools, as shown in Table 1 by the difference of means tests for indicators of violence
in public and private schools. In that table, each indicator shows the occurrence (1) or not (0)
of a violent event at a given school during the academic year. Indicators of attempt on life,
theft, robbery and physical assault consider both students and teachers as victims, as we
believe an unsafe environment that produces distorted incentives is a result of violent actions,
irrespectively of the victim. The indicator of presence of weapons considers the concealed
carry of firearms and/or of stabbing weapons (knives, pocket knives, stylets, etc.) by school
members. Finally, the indicators of presence of drugs (consumption and/or dealing) and gang
attacks consider these events both in and out of the school environment due to the
underreporting of violence, as explained in the subsequent section.1
SAEB provides information about fourth graders in elementary school, eighth graders
in middle schools, and senior high school students. However, we focus our analysis on
students of these two latter grades because we believe that the age range of them is the most
susceptible to violent behaviors. In fact, according to the report issued by Rezende and Tafner
(2005) young individuals are overrepresented among victims and offenders. In 2003, for
instance, youngsters aged 15 to 24 years accounted for 39% of homicide victims in Brazil,
according to the Ministry of Health database (also known as DATASUS).
Table 1: Difference of means of school violence indicators
Mean Test Variable
Public schools Private schools Difference EP
Attempt on life 0.0631 0.0104 0.0527*** 0.0045 Theft 0.2928 0.1945 0.0983*** 0.0113
Robbery 0.0285 0.0177 0.0108*** 0.0039 Physical assault 0.3010 0.1440 0.1570*** 0.0106
Presence of weapons 0.2143 0.0578 0.1565*** 0.0083 Presence of drugs 0.4573 0.2737 0.1836*** 0.0126 Gang attacks 0.1841 0.0814 0.1027*** 0.0085 Source: SAEB 2003.
***significant at 1% **significant at 5% *significant at 10%
1
After the exclusions described above, our sample of interest consists of nearly 80,000
students, 6,000 teachers, 3,000 school groups and 1,800 schools. For our estimates, one
should recall that observations with missing data were excluded. The original SAEB 2003
sample consists of approximately 220,000 students, 17,000 teachers and 6,000 schools.
2.2. Descriptive statistics of school violence
The main concerns with violence noticed by Brazilian schools in 2003 were presence
of drugs, physical assault, theft, carry of arms by school members and gang attacks, in this
strict order (Table 1). Attempts on life, despite the small number of schools that reported such
problem, are also significant owing to the severity of episodes.
Nevertheless, one should bear in mind that indicators of school violence –our main
variables of interest – are reported by school principals. Therefore, there are two limitations:
planning of answers and subjective perception and notification of violence. The first
limitation was established by Grogger (1997). He emphasizes that, on the one hand, school
principals can answer questions strategically, by giving answers that explain students’ low
performance, thus causing the effects of violence to be overestimated. On the other hand,
school principals might not want to reveal the actual level of violence in their schools so that
they are not seen as incompetent, causing the effects of violence to be underestimated.
In a recent analysis of the survey into school violence in Brazil, Sposito (2001) affirms
that the reports of violence by Brazilian schools vary considerably, depending on the
predominant behavior observed in the public education system. She mentions that sometimes
the notification of violent actions shows the probable weaknesses in pedagogical work, and
that sometimes notification may yield additional gains to the schools, such as larger material
and human resources or some wage benefits to the teachers that work in risky areas. Since we
did not observe the predominant behavior in public schools, we cannot categorically state how
measurement error in violence indicators behaves and how this influences our estimates.
However, three violence indicators from the SAEB questionnaire are reported separately for
school premises and for schools’ neighboring areas and, therefore, the significant difference
in these indicators may provide evidence of notification problems. Table 2 seems to indicate
Table 2: Violence indicators for public schools
Violence indicator Within school
Around
school Difference SE
Consumption of
drugs 0.0514 0.2460 -0.1946*** 0.0105 Drug dealing 0.0282 0.1780 -0.1498*** 0.0091 Gang attacks 0.0293 0.0761 -0.0468*** 0.0068 Source: SAEB 2003.
***significant at 1% **significant at 5% *significant at 10%
Because of that finding, our indicators of presence of drugs (consumption and/or
dealing) and gang attacks at schools contemplate these events both within and around schools.
In fact, it seems unreasonable that 25% of schools have drug consumption in their
surroundings and that only 5% of them have drug consumption within their premises.
Table 3: Violence indicators in Brazil per state – 2003†
State Homicide rate
Attempt
on life Theft Robbery
Physical
assault Weapons Drugs Gang attacks
Acre 24.48 0.14 0.49 0.01 0.37 0.45 0.57 0.32
Alagoas 35.61 0.03 0.15 0.01 0.11 0.13 0.30 0.12 Amapá 34.59 0.23 0.46 0.07 0.47 0.52 0.43 0.30 Amazonas 18.41 0.13 0.51 0.03 0.29 0.27 0.60 0.20 Bahia 16.11 0.02 0.17 0.02 0.27 0.15 0.31 0.09 Ceará 20.13 0.07 0.17 0.01 0.27 0.20 0.32 0.08 Distrito Federal 33.88 0.28 0.63 0.05 0.50 0.50 0.77 0.41 Espírito Santo 50.12 0.14 0.49 0.09 0.36 0.18 0.54 0.12 Goiás 25.37 0.16 0.32 0.02 0.39 0.28 0.56 0.25 Maranhão 13.48 0.02 0.08 0.01 0.10 0.18 0.42 0.17 Mato Grosso 34.25 0.13 0.34 0.03 0.31 0.24 0.50 0.24 Mato Grosso do
Sul 32.49 0.09 0.42 0.03 0.31 0.40 0.55 0.27 Minas Gerais 20.83 0.07 0.26 0.04 0.28 0.29 0.46 0.27
Pará 21.35 0.08 0.34 0.02 0.25 0.18 0.48 0.20
Paraíba 17.48 0.06 0.20 0.05 0.17 0.14 0.42 0.11 Paraná 25.55 0.06 0.34 0.03 0.33 0.26 0.51 0.23 Pernambuco 55.34 0.03 0.14 0.04 0.29 0.20 0.38 0.15 Piauí 10.19 0.05 0.16 0.01 0.12 0.09 0.24 0.10 Rio de Janeiro 52.55 0.03 0.26 0.03 0.26 0.06 0.37 0.08 Rio Grande do
Norte 14.02 0.04 0.30 0.05 0.29 0.23 0.44 0.15 Rio Grande do
Sul 18.13 0.06 0.46 0.03 0.37 0.27 0.50 0.21 Rondônia 38.88 0.17 0.44 0.03 0.34 0.42 0.49 0.24 Roraima 29.67 0.10 0.50 0.00 0.39 0.33 0.63 0.23 Santa Catarina 11.79 0.05 0.48 0.02 0.37 0.32 0.57 0.28 São Paulo 35.91 0.05 0.39 0.04 0.45 0.19 0.62 0.23 Sergipe 25.02 0.13 0.20 0.06 0.25 0.15 0.46 0.12 Tocantins 16.50 0.08 0.12 0.01 0.20 0.13 0.42 0.13
Brasil 28.86 0.06 0.29 0.03 0.30 0.21 0.46 0.18
Sources: DATASUS and SAEB – 2003.
† The homicide rate in the first column was obtained from DATASUS and the violence indicators in the other
The second limitation of violence indicators reported by school principals – the matter
of subjectivity – arises from the design of the SAEB questionnaire itself. School principals
must answer whether a given violent episode occurred or not in their schools during the
academic year. Some events are remarkable and therefore a case for notification (e.g.:
attempts on life). On the other hand, some other events rely on the perception of violence by
the school principal or on his/her involvement in the school community, as in cases of
physical assault and presence of drug use and/or dealing within or near schools.
On account of this scenario, it is quite understandable that there is difference in the
violence indicators obtained by SAEB as opposed to those provided by other sources. In fact,
while the states of Pernambuco and Rio de Janeiro, for instance, have a higher rate of
homicide victims per 100,000 inhabitants, according to DATASUS data, these are the states
with the lowest number of public schools that report on the presence of drugs within their
premises or in their surroundings (Table 3). The states of Santa Catarina and Rio Grande do
Sul, however, have very low homicide rates, but a quite large number of public schools that
report on violence compared to other Brazilian states, as also shown in Table 3. These
examples show how subjective indicators are. In the first situation, it is as if violence were an
integral part of people’s daily lives and thus its evidence goes unnoticed by school principals.
In the second situation, however, we perceive school principals give better attention to violent
episodes, perhaps due to the lack of safety indicated by uncommon events.
Even though the violence indicators reported by school principals do not accurately
measure the dimension of this problem in Brazilian schools, they show the sensitivity of such
schools to the problem. Therefore, our aim is to assess the relationship between violence
perception and school outcomes, since sensitivity to violent events causes changes in
students’ behavior and consequently affects their performance in school.
3. Empirical Methodology
The aim of this study is to assess how violence in schools affects the proficiency of
students. Thus, the dependent variable is the student’s performance in Mathematics or in
Portuguese, depending on the subject he or she was evaluated in, and the regressors of interest
are violence indicators or variables that possibly increase or reduce the correlation with it:
teacher’s qualification, differences between teacher and student in terms of sex and race,
number of students in class, percentage of boys, percentage of non-white students, lag
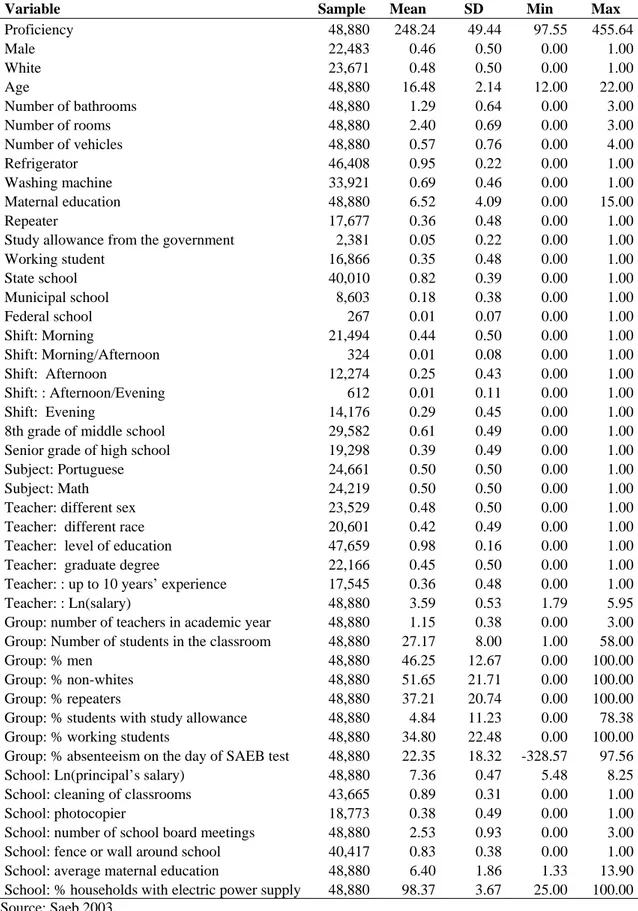
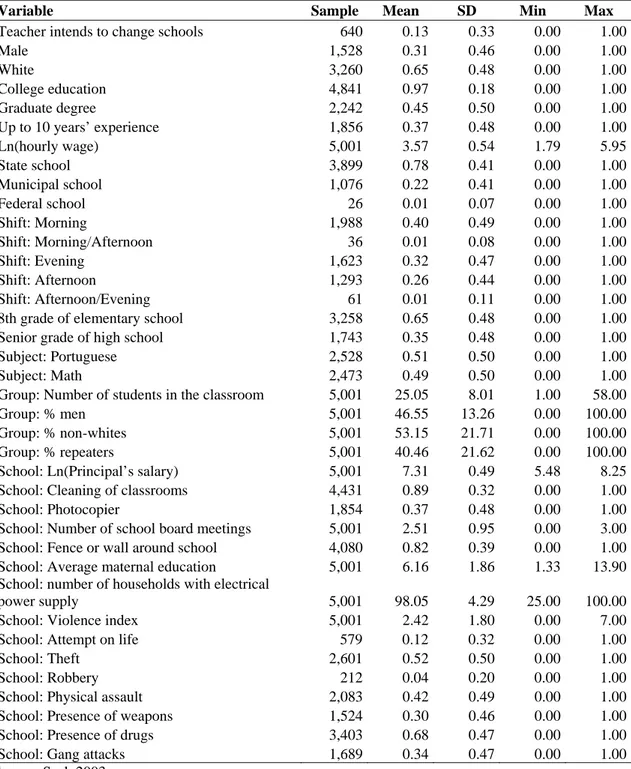
Obviously, we controlled for several characteristics regarding students, teachers, classes and
schools. The descriptive statistics of all variables used are shown in Table A1 in the
Appendix.
In what follows, we describe how we built the variables of interest and we explain
why we included them. First, we built a school violence index, our major variable in this
study. For simplification, we just added the several violence indicators.2 As each indicator
assumes value zero or one and we have seven indicators, our index ranges between zero and
seven, where zero represents the lowest level and seven stands for the highest level of school
violence. Note also that teacher’s qualification was represented by three indicators: college
education, graduate education, and experience (if he or she has more or less than 10 years of
experience). We included these variables to capture the direct positive effects of teacher’s
qualification and to investigate whether more qualified teachers manage to reduce the
negative correlation of violence with proficiency, either by means of implementing innovative
pedagogical projects or by approaching and dealing with violence problems at school.
The difference between teacher and students’ characteristics was represented by two
indicators: sex difference and racial difference. Each indicator assumes value one when any
difference exists and value zero, otherwise. We included these variables for two reasons: (i) to
check whether the difference in these dimensions causes detachment between teacher and
student, compromises student learning and consequently, worsens student proficiency, as
demonstrated in the literature,3 and (ii) to assess whether this difference increases the negative
correlation of violence, since it may trigger conflicts between the parties involved.
The number of students in class on the day of the SAEB4 survey was included in order
to contemplate the widely investigated effect of class size5 and to check whether a larger
number of students in class increase the negative correlation of violence with proficiency due
to the probable formation of rival subgroups and occasional conflicts between them.
The percentage of boys in class was included for two reasons: (i) to assess the direct
effects of male students on the individual proficiency of students, as boys often show poorer
interest and disrupt the class environment more often, and (ii) to check whether the presence
2
Alternatively, we have also constructed an indicator that is a weighted average of school violence indicators, where the weights were chosen based on principal component analysis. However, results tended to be quite similar to those based on the simple sum of indicators.
3
For further details, see Ehrenberg, Goldhaber and Brewer (1995), Ferguson (1998) and Dee (2004, 2005). 4
Class size is measured in two different ways: the amount of students on the roll call and the number of students that attended class on the day of the SAEB survey. We used the second one because it contemplates possible changes in class size throughout the year, which arise from enrollment or dropout. Nevertheless, we are aware of the problem regarding school absenteeism, which may be included in this measure.
5
of more boys in class increases the negative effect of violence on proficiency due to the fact
that male individuals seem to be more aggressive. Actually, if we raise the rather strong
hypothesis that the characteristics of homicide victims represent those of murderers
themselves, we have the following violence pattern, according to DATASUS data: 93.62% of
the homicide victims aged between 15 and 24 years, in 2003, were male. The percentage of
non-white students in class, however, was taken into consideration (i) to check whether the racial composition of class has a direct effect on the individual proficiency of students, as
highlighted by the literature on social interaction,6 and (ii) to investigate whether this
percentage increases the negative effects of violence on student performance, since the social
stereotype produced by interracial prejudice can trigger conflicts in the classroom.
We also included the percentage of repeaters in class. Our goals were (i) to tackle the
deterioration in student performance caused by the lag between age and grade in the
classroom, as pointed out by the literature,7 and (ii) to check whether classes consisting of
different-aged students (repeaters are older for obvious reasons) increase the negative
correlation of violence with proficiency due to conflicts that could arise from different
interests.
Finally, we included the percentage of students with a poor family background,
represented by two variables: the percentage of students who benefit from the study
allowance granted by the government (cash transfer program called “Bolsa-Escola”), and the
percentage of working students. We included these variables (i) to investigate whether the
socioeconomic level of students influences their individual performance, as suggested by the
literature on social interactions8, and (ii) to check whether the sociocultural distance of the
class from the syllabuses taught in schools increases the negative correlation of violence due
to the conflicts of interest that might arise in this situation. In fact, Brazilian schools often
prioritize encyclopedic syllabuses in the educational process that are not directly applicable to
the work environment, and quite often, too far from students’ everyday life.
As our goal is to show the association between school violence and student
proficiency and as some regressors of interest interact with violence, we estimated the
following equation:
(1) ln(Yics)= X'ics.α+β.Vs +I'ics.γ +δ.(Vs*Iics)+εics
6
See, for instance, Card and Rothstein (2007), for recent evidence. 7
See, for instance, Ferrão, Beltrão and Santos (2002) and Machado (2005). 8
where )ln(Yics is the logarithm for the proficiency of student i , of class c and of
school s; Xics represents all the control variables: characteristics of students, teachers,
groups and schools; V is the index of school violence; and s Iics stands for all regressors
described above: teacher’s qualification, teacher-student differences in terms of sex and race,
number of students in the group, percentage of boys, percentage of non-white students, lag
between age and grade in the class, and percentage of students with a poor family
background. Since our objective was to check how each explanatory variable is related to
student proficiency, both in the mean and in certain quantiles of proficiency distribution, we
estimated the coefficients of equation (1) using linear regressions and quantile regressions.
The coefficients of greater interest are β, γ and δ. Each coefficient of δ measures the
impact of a regressor of interest on the correlation of school violence with student
proficiency.
If we restrict the coefficients of interactions to zero and if β is negative, then students
from schools with higher violence rates or from more violent neighborhoods show worse
proficiency. By letting coefficients δ free, if β decreases in absolute values or becomes
nonsignificant and some coefficient of interaction is significant and positive, then that
variable that interacts with violence reduces the negative correlation between violence and
proficiency. Suppose that the variable of interaction is teacher’s qualification. Thus,
coefficient δ measures the impact of a qualified teacher on the correlation of school violence
with student proficiency. If the coefficient of this interaction is positive and significant, then
better qualified teachers are able to implement teaching projects that minimize the negative
correlation between violence and proficiency. On the other hand, if β increases in absolute
values and some coefficient of interaction is significant and negative, then that variable which
interacts with violence enhances the negative correlation between violence and proficiency.
Consider, for instance, the interaction of the number of students in a class with violence. If the
coefficient of this interaction is negative and significant, then the deleterious effects of
violence are bigger in larger classes, enhancing the negative correlation.
However, one should highlight that the coefficient of the violence rate must be
interpreted with caution. Actually, there might be an endogeneity problem between school
same time, the worst performance stimulates violent actions in the school environment. The
rationale for the latter argument is as follows: students with poor school performance tend to
have fewer opportunities in the job market; consequently, they feel more encouraged to
engage in criminal acts and, therefore, performing violent actions at school is just one more
criminal behavior.
With regard to the omission of relevant variables, one should recall that the admission
of students to a school is a non-random family decision process, and that the maintenance of
students in school depends on how attractive the school is. Parents who are more concerned
with the education and safety of their children may prefer to enroll them in better and safer
schools, despite the higher fees,9 and can participate more actively in school management.
Furthermore, safer schools with better teaching quality tend to attract and maintain highly
motivated students. Nevertheless, we should note that students who do mind about violence
and who cannot attend these schools wind up quitting. This makes the worst schools, with
higher violence rates and poorer teaching quality, concentrate the least diligent students and
those who are less sensitive to violence. In econometric terms, parent’s preference for better
teaching quality and for safer schools and the attraction of best students to safer schools bring
about an endogeneity problem, because this affects both school violence indicators and
student proficiency. In other words, better and safer schools tend to concentrate students with
higher proficiency and better violence indicators. This eventually overestimates the negative
correlation between violence and proficiency. Nonetheless, the dropout of students from the
most violent schools, who are more sensitive to violence, tends to minimize the correlation
between violence and proficiency. Because there seems to be more factors in favor of the
concentration of more proficient students in safer and more attractive schools, we believe
overestimation must be a predominant feature.
Even though we do not manage to deal with the simultaneity problem, we have sought
to ease the problem with omitted variables by including five SAEB 2003 variables that may
be used as proxies for school management, parent’s participation in this process and in the
school life of their children, and school attractiveness. The variables are the following:
number of times the school board meets during the year,10 presence of fences or a wall around
the school, average level of education of students’ mothers at a given school, percentage of
households with electrical power supply, and percentage of students of a group that miss on
9
At first, this argument seems inappropriate for public schools, but we may think, for instance, of the cost of attending a school that is located farther away.
10
the day of tests. The frequency of school board meetings demonstrates the quality of school
management: the more the school board members – principals, teachers and parents – meet to
discuss and try to solve the problems faced by the school, the better the parent’s follow-up of
the teaching-learning process will be and the more efficiently resources will be allocated. As a
matter of fact, the presence of fences or a wall around the school may reflect parent’s pressure
for investments in safety. The mothers’ educational background denotes the participation of
mothers in decisions at the school level and in the follow-up of the school life of their
children: we believe better educated mothers tend to be more demanding in parent’s meetings,
for instance. The percentage of households with electrical power supply reflects the level of
social commitment of the community to which the student belongs: the more pressure for
public services is brought to bear by the community, the more comprehensive and the better
the services will be. According to the spillover effect, local schools are expected to come
under this social pressure. Finally, the percentage of students who fail to attend school on the
day of SAEB test indicates how unattractive the school is. Schools with the worst teaching
quality and with little concern about the academic follow-up of students are expected to suffer
more terribly from dropout and/or school absenteeism. By including these variables, we hope
the correlation between violence and proficiency will have a closer effect to the real effect of
violence on schools.
Besides showing the association between school violence and student proficiency, we
also want to demonstrate the relationship between school violence and teacher turnover. That
is, we want to show that not only does school violence has a direct effect, but that it is also
indirectly associated with student performance as a result of teacher turnover. By the way, a
study undertaken by UNESCO in 2000 clearly revealed that one of the possible consequences
of school violence on the quality of teaching arises from teacher turnover (Abramovay and
Rua, 2004). As teachers seek to get transferred to safe schools, there are job openings at the
most violent schools, which consequently lead to detrimental discontinuity of the
teaching-learning process. This results in worse student performance.
Since the number of teachers a given class has had throughout the year (variable
included in the database) is a potential proxy for turnover, then we can estimate how our violence variables are related to this number. It should be highlighted that, although the
distribution of this variable across public and private schools is quite similar, we use only
information on public schools. Only in them we can associate the number of teachers
throughout the academic year with turnover, as only in these schools does only one teacher
more than one teacher: one example is Portuguese, which can be taught by three teachers –
one who teaches grammar, one who teaches literature and one who teaches writing. After
these remarks, we built a dependent variable categorized as follows:
– 0, if the class did not have a teacher during the academic year;
– 1, if the class had only one teacher during the academic year (normal circumstance);
and
– 2, if the class had more than one teacher during the academic year (turnover).
We used the multinomial logistic model to estimate how violence indicators are
associated with the probability of a class having no teacher, one teacher, or two or more than
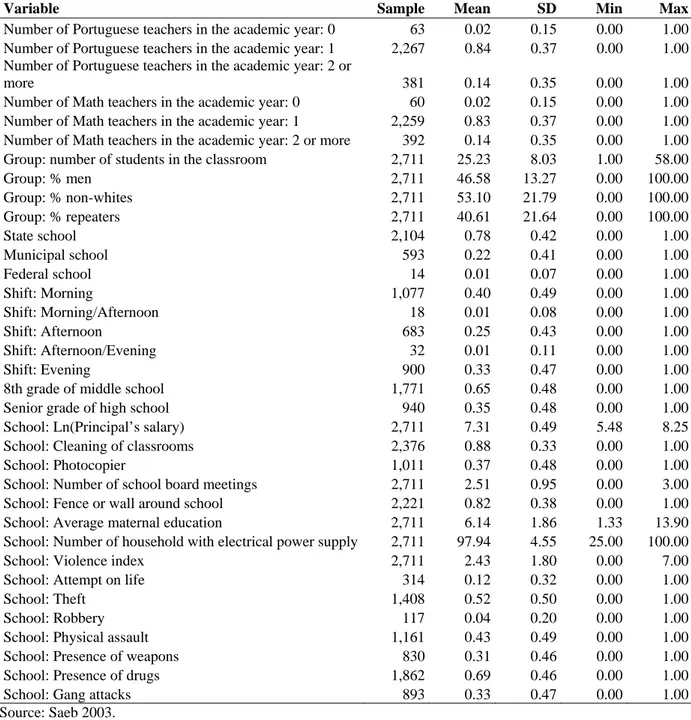
two teachers during the academic year. Again, we controlled for the characteristics of the
class and of the school, as shown in Table A2 in the Appendix. The probabilities in the
multinomial logistic model are outlined below:
(2)
∑
= + = 2 , 1 ) ' ( 0 1 1 ) ( j x j e xP β ,
∑
= + = 2 , 1 ) ' ( ) ' ( 1 1 ) ( j x x j d e e x P β β and∑
= + = 2 , 1 ) ' ( ) ' ( 2 1 ) ( j x x j i e e x P β βWe calculated the impact of marginal changes in violence indicators on
probabilitiesP . The marginal effects (percentage variations in the probability of an event j
occurring when a given independent variable is modified) are calculated based on the
estimated coefficients (βˆ), as shown in what follows:
(3) (x) X P k j ∂ ∂ = ⎟⎟ ⎠ ⎞ ⎜⎜ ⎝ ⎛ −
∑
=1,2
ˆ ) ( ˆ ) ( j j j j
j x k P x k
P β β ∀j= 0, 1 and 2
When the variable is discrete as, for example, a school violence indicator, the marginal
effect measures the difference between the probability of violence having occurred or not at
that school. On the other hand, when the regressor is continuous, the marginal effect measures
4. Results
4.1. Direct relationship between violence and proficiency
In table 4, we provide the estimation results for equation (1) using the school violence
indicator. We specified four models. In the first one, we controlled for the characteristics of
students, teachers, classes and schools, but we did not deal with omitted variables. In the
second one, we added variables that aimed to minimize this problem: the number of times that
the school board met during the year, the presence of fences or walls around the school, the
average level of maternal education at a given school, the proportion of students’ households
with electric power supply, and the percentage of students that missed class on the day of the
test. In these two models, we did not include interactions of violence index. Our goal was to
capture the correlation of violence without worrying about possible factors that could either
mitigate or stimulate it. In the third model, we included interaction of the violence index with
teacher’s attributes. Here, we were interested in knowing whether the teacher-student
difference and teacher’s qualification influenced the correlation coefficient of school violence
with student proficiency. Finally, in the fourth model, we excluded the interactions of the
violence index with the teacher’s attributes and included the teacher’s interactions with class
attributes. Our aim was to verify how the number of students and class configuration could
Table 4: School violence and student proficiency
Ln(proficiency) Model 1 Model 2 Model 3 Model 4
Teacher-student difference in terms of sex -0.00571** -0.00557** -0.00481 -0.00550* (0.00284) (0.00284) (0.00502) (0.00283) Teacher-student difference in terms of race -0.01523*** -0.01553*** -0.01465*** -0.01551*** (0.00315) (0.00314) (0.00511) (0.00314) Teacher with college education 0.00805 0.00082 0.00615 0.00263 (0.00771) (0.00780) (0.01206) (0.00783) Teacher with graduate degree 0.00954*** 0.00827** 0.01083** 0.00767**
(0.00329) (0.00328) (0.00548) (0.00328) Teacher with less than 10 years’ experience 0.00082 0.00315 0.00385 0.00295 (0.00329) (0.00329) (0.00549) (0.00329) Number of students in the class 0.00030 -0.00019 -0.00020 0.00059*
(0.00021) (0.00023) (0.00023) (0.00032) Percentage of boys in the class -0.00002 -0.00016 -0.00016 0.00023
(0.00012) (0.00012) (0.00012) (0.00019) Percentage of non-whites in the class -0.00104*** -0.00085*** -0.00085*** -0.00091*** (0.00011) (0.00011) (0.00011) (0.00014) Percentage of repeaters in the class -0.00035*** -0.00023** -0.00023** -0.00051***
(0.00010) (0.00010) (0.00010) (0.00016) Percentage of students with “Bolsa-Escola” -0.00027* -0.00015 -0.00015 0.00012
(0.00016) (0.00016) (0.00016) (0.00021) Percentage of working students -0.00059*** -0.00042*** -0.00042*** -0.00024
(0.00013) (0.00013) (0.00013) (0.00016) School violence index -0.00526*** -0.00474*** -0.00095 0.00942*
(0.00092) (0.00092) (0.00482) (0.00502) Interaction of violence index with :
Difference in terms of sex -0.00036
(0.00166)
Difference in terms of race -0.00030
(0.00168)
College education -0.00294
(0.00474)
Graduate degree -0.00099
(0.00176)
Less than 10 years’ experience -0.00029
(0.00171)
Number of students -0.00031***
(0.00011)
Percentage of boys -0.00017***
(0.00007)
Percentage of non-whites 0.00003
(0.00004)
Percentage of repeaters 0.00010**
(0.00004)
Percentage of students with “Bolsa-Escola” -0.00010
(0.00006)
Percentage of working students -0.00007*
(0.00004)
Correction for omitted variables No Yes Yes Yes
Number of observations 48,880 48,880 48,880 48,880
F( k-1, n-k) 146.62 140.13 131.08 129.48
Prob > F 0.0000 0.0000 0.0000 0.0000
As shown in Table 4, the main coefficient of interest – school violence – is negative
and significant in the specifications estimated without the interactions. The coefficient shows
us that, on average, the occurrence of an additional violent event at a given school is
associated with a reduction of approximately 0.47% in student proficiency. Actually, before
we correct the omitted variables problem, the coefficient was a bit higher (0.53%), supporting
our assumption about the overestimation of the effect of school violence due to the
concentration of the most proficient students at safer and more attractive schools.
At first, the correlation between school violence and student proficiency seems to be
negligible. However, given that the index encompasses seven violence indicators, this means
that the deterioration in proficiency between the least violent school and the most violent one
corresponds to approximately 3.3%. Still, as the effects found in the literature of the impact of
educational inputs on student performance are too small, violence seems to be relevant. This
result is in line with the findings of the study conducted by UNESCO, showing that school
violence contributes to worsening student performance. They also indicate that, apart from
affecting the level of education, as pointed out by Grogger (1997), violence also undermines
the quality of learning for those who stay in school.
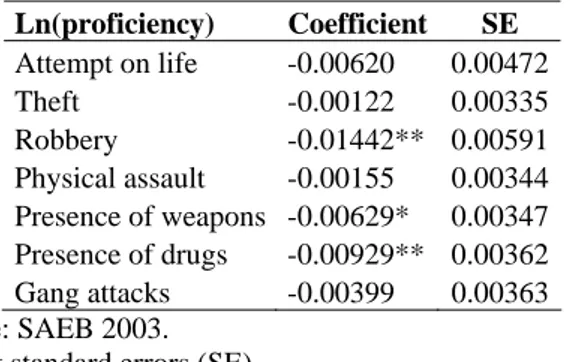
It is interesting to examine which violence indicators have the most harmful effects on
student performance in Brazilian public schools. Table 5 provides the coefficients for the
estimation of the second specification (with correction for the omission of relevant variables)
by replacing the violence rate with the indicators it comprises. By using these estimates and
the descriptive statistics in Table 3, we show that the main problem at schools regarding
violence is the presence of drug dealing and/or consumption in their premises. As a matter of
fact, students who attend schools that face such problem tend to have a 1% lower proficiency,
and nearly half of Brazilian schools have notified this problem, and in some states this
accounts for 60% of schools, as is the case of São Paulo (see Table 3). Therefore, fighting off
drug dealing at schools must be one of the major concerns of public policymakers. Another
indicator that has a quite detrimental effect on student proficiency is the presence of weapons
at schools, with a coefficient of -0.6%. As 21% of school principals report concealed carry of
firearms and/or of stabbing weapons (knives, pocket knives, stylets, etc.) by school members,
this is also alarming. So, policies targeted at disarming the population may have good effects
on student learning, and may also deter homicides and other types of violence. Finally, we
have the robbery indicator, whose coefficient is the highest (-1.4%). Nevertheless, as only 3%
of Brazilian public schools have reported on this type of violence (3%), this seems to be a
Table 5: School violence indicators and student proficiency
Ln(proficiency) Coefficient SE
Attempt on life -0.00620 0.00472 Theft -0.00122 0.00335 Robbery -0.01442** 0.00591 Physical assault -0.00155 0.00344 Presence of weapons -0.00629* 0.00347 Presence of drugs -0.00929** 0.00362 Gang attacks -0.00399 0.00363 Source: SAEB 2003.
Robust standard errors (SE).
***significant at 1% **significant at 5% *significant at 10%
It should be stressed that this negative correlation of violence with proficiency might
reflect both the offending behavior of youths and their status of victims. We know that in the
eighth grade of middle school several students make decisions about job opportunities: if they
do not get a job in the conventional job market, they might indulge in illegal activities such as
drug dealing, for instance. If they opt for this, they begin to act violently and, consequently,
they start committing offenses even at school, compromising their learning and that of their
peers. In an attempt to separate the aggressive status from that of victim in our estimates, we
performed the same regressions for the fourth grade of elementary school. We believed that
violent behavior would be less likely in this age group and therefore, if there was any harmful
effect of violence, this would be that of victim. The coefficient for school violence in this
school grade was absolutely lower than that found for the eighth grade and for the senior
grade of high school, but it was positive, contrary to our expectations, and significant.11
Despite the unexpected sign, this coefficient seems to indicate that there is no victim status in
our estimates for the eighth grade and for the senior grade of high school: young people’s
aggressiveness and its spillover effect appear to determine our results, as in the model
proposed by Lazear (2001).
When we interacted the violence index with teacher’s attributes – teacher-student
difference in terms of sex and race, college education, graduate education and experience –,
none of the coefficients was statistically significant, as shown in Table 4. In other words, we
did not find any evidence that sex or racial differences between teachers and students
maximize the deleterious effect of violence, or that teacher’s qualification might reduce the
11
negative correlation between school violence and student proficiency. Moreover, the
coefficient for the violence index was no longer significant.
Even though the correlations of the violence index with teachers’ attributes are not
significant, Table 4 shows that these attributes have direct effects on student performance.
Students who attend classes taught by teachers with a graduate degree, for instance, have a
1% higher proficiency. The teacher-student differences in terms of sex and race, on the other
hand, hamper student performance by 0.5% and 1.5%, respectively, being consistent with the
evidence provided by Ehrenberg, Goldhaber and Brewer (1995), Ferguson (1998) and Dee
(2004, 2005). The explanation for this phenomenon lies in what the literature denominates
passive and active effects of a teacher. Passive effects arise from the simple identification
between teacher and students resulting from their belonging to the same race, sex and/or
socioeconomic background: they do not involve any kind of behavior on the part of the
teacher. The presence of a teacher from a different race, for example, might influence
students’ expectations and motivations and hinder the healthy interaction between teacher and
students that stimulates learning. At the same time, the relationship between a male teacher
and a female student, for instance, might cause unease due to stereotypes and undermine
teaching-learning interactions. In turn, active effects arise from different behaviors of teachers
towards students of a different race, sex and/or socioeconomic background. Prejudice often
leads teachers to segregate some students, interfering with the teaching-learning process. With
regard to public policies, this means that the qualification of teachers from the same
community to which students belong, for example, may be efficient in improving education.
When we correlated the school violence index with class size and class characteristics,
in the fourth specification of Table 4,12 we found strong evidence that the number of students
in the classroom and the percentage of male students intensify the deleterious effect of
violence, although the coefficients are not so important economically. Thus, evidence
seemingly suggests that the larger the number of students in the classroom, the most likely the
formation of subgroups and the existence of conflicts between them and, consequently, the
stronger the correlation in absolute terms between violence and school performance. Another
possible mechanism whereby the size of a classroom may potentiate the harmful effect of
school violence on proficiency is the difficulty teachers have controlling very big groups.
Regarding the role of the percentage of male students in the classroom in strengthening the
negative correlation between violence and proficiency, recall the data provided by
12
DATASUS, according to which 93.62% of homicide victims aged 15 to 24 years, in 2003,
were male. Assuming again that the characteristics of homicide victims reflect the attributes
of murderers, perhaps a very plausible hypothesis, we can say that boys are more aggressive
and therefore it is natural that the larger number of male students ends up enhancing the
detrimental effect of violence.
Another remarkable correlation in the fourth specification in Table 4 concerns the
school violence index with the percentage of working students. Despite its small economic
importance, this percentage also seems to increase the deleterious effect of violence. A
possible explanation to this fact is the existence of competing interests between working
students and teachers with respect to the syllabuses taught in class. In general, workers want
classes that are more closely linked to the working environment whereas teachers would
rather teach more propaedeutical classes. Another explanation is the problem students have
juggling studies and work: these students may show difficulty keeping up with the class due
to their feeling tired and not being understood by their teachers. Both conflicts of interest may
encourage discussions and fights at schools and, as a result, heighten the harmful effect of
violence. The last significant interaction concerns the percentage of repeaters. However, the
coefficient sign was different from that which we expected. We expected the number of
repeaters in a class to be associated with greater disruptive behavior, as these students usually
happen to be the most undisciplined, and consequently, this would increase the negative
correlation between violence and proficiency. In fact, estimates indicate quite the contrary:
they suggest that the percentage of repeaters lessens the effect of school violence. Maybe this
is due to the experience these students acquire for having flunked, a hypothesis we regard as
plausible but not so defensible. To conclude this analysis, the correlations of the school
violence index with the percentage of non-whites and with the percentage of students who
benefit from the study allowance granted by the government (“Bolsa-Escola”) were not
statistically significant.
It is interesting to have a look at the close relationship between the characteristics of
the class and students’ proficiency. Curiously enough, we did not find striking evidence for
the widely documented class size effect, nor for the expected negative correlation between the
percentage of male students and proficiency. Among the analyzed attributes, only the
percentage of non-white students, of repeaters, and of working students yielded significant
coefficients. Albeit economically nonsignificant, these negative coefficients suggest the
presence of harmful peer effects arising from racial, educational and economic issues. The
teachers, as we explained previously, causing educational losses to the whole class. On the
other hand, the spillover effect of the percentage of repeaters can be justified by the low
educational background of these students, by the fact that they are potentially more
undisciplined and by the difficulty the teacher has in conducting a teaching project that meets
the interests of students whose age differences are quite large. The peer effects arising from
the percentage of working students can be explained by the conflict of interests between
teachers and students. As we argued previously, working students prefer classes that are more
closely related to their working environment whereas teachers often follow strictly
propaedeutical teaching manuals. Furthermore, as these students juggle work and study as
part of their daily routine, they might have some difficulty keeping up with classes and
accomplishing the tasks requested by the teacher. This combination of factors results in
rowdier and slower classes, which is eventually negative to the whole group.
Another characteristic of the class that deserves attention is the percentage of students
who benefit from the study allowance granted by the government (“Bolsa-Escola”). Albeit
weak, there is evidence that the presence of several of these students in a classroom may be
detrimental to the performance of the group as a whole. A possible explanation to this fact is
the conflict of interests between students who have just joined the schooling system and those
who have already been attending school. As newcomers often do not understand the subject
matter due to their poor background, the classes may have a slower pace and negatively affect
the learning of other students. In this situation, make-up classes for students who benefit from
the study allowance granted by the government may help circumvent the problem. Another
plausible explanation refers to the violent reaction of students who have just entered school to
the stigma they suffer because of their low socioeconomic background. As described by
Sposito (2001), these stigmatized students may start to tease other students, obtruding
themselves by instigating fear or physical force, turning the classroom into a less than
adequate environment for learning.
All the results presented above are average. However, there may be heterogeneity in
students’ response to violence. Better motivated students tend to be less influenced by factors
that negatively affect learning. In order to investigate these possible differences in the
association between violence and student proficiency in the proficiency distribution, we
carried out quantile regressions using a specification that includes all controls (attributes of
students, teachers, schools and groups), including also the variables that try to make up for the
omission of relevant variables, and the violence index. As shown in Table 6, violence seems
Table 6: Impact of school violence on student proficiency in the proficiency distribution
Quantile
(proficiency) Coefficient SE
0.05 -0.00577*** 0.00201 0.10 -0.00497*** 0.00149 0.25 -0.00464*** 0.00095 0.50 -0.00526*** 0.00083 0.75 -0.00408*** 0.00083 0.90 -0.00354*** 0.00086 0.95 -0.00409*** 0.00100 OLS -0.00474*** 0.00092 Source: Saeb 2003.
Robust standard errors (SE).
***significant at 1% **significant at 5% *significant at 10%
In fact, the negative correlation of violence with proficiency decreases by
approximately 29% when we move from the first to the last decile. This means that, in the
first decile of the distribution, there is a proficiency difference of 3.5% when we compare the
most violent school with the least violent one and, in the last decile, this difference drops to
2.5%. Thus, violence appears to increase the inequality observed in student performance.
4.2. Indirect relationship between violence and proficiency: teacher turnover
When we assessed the direct relationship between violence and student proficiency in
the previous section, we included, in the regression, the average number of Portuguese and
Math teachers that each eighth grade and senior grade of high school had throughout the
school year. Our goal was to check whether there was some harmful effect of teacher turnover
on student performance. Even though the coefficient turned out to be negative in the four
specifications estimated, it was not statistically significant in either of them. Notwithstanding,
we decided to investigate whether there existed some association between school violence and
teacher turnover. If there were a negative correlation, then violence could also affect student
proficiency in an indirect manner. As we explained in the Methodology section, we used the
number of teachers the classes had throughout the year as turnover parameter and we
analyzed our problem by estimating a multinomial logistic model.
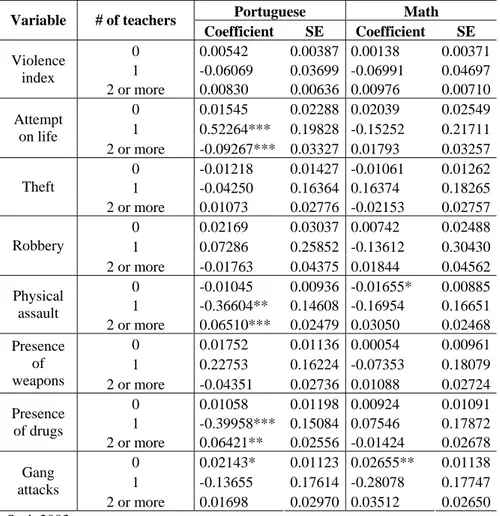
As shown in Table 7, the marginal effects of the violence index suggest that school
violence is associated with a lesser probability of groups having only one teacher and with a
greater probability of having two or more teachers, although these effects were not
comprises, we find strong evidence of the association suggested by the violence index.
Actually, the presence of physical assault at schools during the academic year and the
presence of drug dealing and/or consumption in their premises reduce the probability of
classes having just one Portuguese teacher during the academic year by approximately 38%,
and increase the probability of teacher turnover by around 6.5%. These rates confirm the
findings of the study conducted by UNESCO that school violence negatively affects teachers’
motivation and may prompt them to leave violent schools.
Table 7: Impact of school violence on teacher turnover
Portuguese Math
Variable # of teachers
Coefficient SE Coefficient SE
0 0.00542 0.00387 0.00138 0.00371 1 -0.06069 0.03699 -0.06991 0.04697 Violence
index
2 or more 0.00830 0.00636 0.00976 0.00710
0 0.01545 0.02288 0.02039 0.02549 1 0.52264*** 0.19828 -0.15252 0.21711 Attempt
on life
2 or more -0.09267*** 0.03327 0.01793 0.03257
0 -0.01218 0.01427 -0.01061 0.01262 1 -0.04250 0.16364 0.16374 0.18265 Theft
2 or more 0.01073 0.02776 -0.02153 0.02757
0 0.02169 0.03037 0.00742 0.02488 1 0.07286 0.25852 -0.13612 0.30430 Robbery
2 or more -0.01763 0.04375 0.01844 0.04562
0 -0.01045 0.00936 -0.01655* 0.00885 1 -0.36604** 0.14608 -0.16954 0.16651 Physical
assault
2 or more 0.06510*** 0.02479 0.03050 0.02468
0 0.01752 0.01136 0.00054 0.00961 1 0.22753 0.16224 -0.07353 0.18079 Presence
of
weapons 2 or more -0.04351 0.02736 0.01088 0.02724
0 0.01058 0.01198 0.00924 0.01091 1 -0.39958*** 0.15084 0.07546 0.17872 Presence
of drugs
2 or more 0.06421** 0.02556 -0.01424 0.02678
0 0.02143* 0.01123 0.02655** 0.01138 1 -0.13655 0.17614 -0.28078 0.17747 Gang
attacks
2 or more 0.01698 0.02970 0.03512 0.02650 Source: Saeb 2003.
Robust standard errors (SE).
***significant at 1% **significant at 5% *significant at 10%
Teachers’ reaction to threats to their physical well-being seems natural, but their
reaction to the presence of drugs at schools is surprising. Besides the deleterious effect on
student learning, as pointed out in the previous section, drug dealing and/or consumption
seems to strongly interfere on teachers’ daily work. In fact, if students are involved in drug
dealing or if they are customary drug users, they feel more powerful to coerce teachers to
meet their demands. Moreover, curfews, shootouts and riots are quite common in
neighborhoods ruled by drug pushers, rendering working conditions too risky.
Another school violence indicator with remarkable marginal effects concerns attempt
on life, but the signs of these effects are different from those expected. At first, it seems
unreasonable that the presence of this violent event at a given school will increase the
probability of a group having only one teacher throughout the academic year and reduce the
probability of teacher turnover, but given the severity of the episode, we can understand this
result. The threat to someone’s physical well-being at a given school tends to discourage
attendance to that school: teachers, for example, may ask to get transferred and may not be
replaced due to violent events. Therefore, there must an increase in the probability of a group
not having any teacher during the academic year, as the marginal effect suggests, although it
is not significant, but not in the probability of that class having several teachers throughout
the year.
It should be highlighted that violence indicators only had a remarkable impact on the
turnover of Portuguese teachers. Initially, we assumed the existence of a driving force acting
in this direction and another force acting in favor of the turnover of Math teachers. The
former is the largest relative percentage of women among Portuguese teachers, as women
appear to be more sensitive to violence, as suggested by the DATASUS data on victims. The
latter concerns the lack of Math teachers in the job market, which gives these teachers a
greater bargaining power and eventually motivates them to change schools. Both the larger
relative percentage of women among Portuguese teachers and the lack of Math teachers are
supported by real-world situation, as will be outlined ahead, but apparently the first effect
predominates.
As shown in Table 8, the percentage of women among Portuguese teachers exceeds
80%, whereas this rate falls to 55% among Math teachers. According to DATASUS, 93.62%
of homicide victims aged 15 to 24 years, in 2003, were male. Assuming again that the
characteristics of homicide victims mirror the attributes of murderers, which is perhaps a
strong though plausible hypothesis, we may say that women are more sensitive to violence
and, therefore, it is natural that they respond more often to violent events. In this specific case,
they respond by changing schools.
Subject % men % women
Portuguese 17.32 82.68
Math 44.07 55.93
Source: SAEB 2003.
The lack of Math teachers can be described as follows: if the cost in terms of diligence
required from a undergraduate course in Mathematics is higher and if the salary paid to public
school teachers is the same for all subjects, a rational individual is expected to choose to teach
any other subject, unless his/her preferences and skills in Math are sufficiently strong. Thus,
wage equality of public school teachers implies that the only variable of adjustment in this
market for Math teachers refers to the quality of working conditions. That is, if this scarcity
were actually present, Math teachers would have more options to move from more violent
schools to less violent ones and consequently there would be a greater turnover of these
teachers. As we do not have enough data on the number of Math and Portuguese teachers in
the Brazilian job market, we used two indirect indicators. The first one consisted of the total
number of undergraduate students about to graduate in Languages and in Mathematics in
2003 (data from INEP-Provão), representing a flow indicator: 34,600 versus 15,025, a
difference of 130%. The second indicator consisted of the total number of candidates enrolled
in the competition exams for middle and high school teachers in the state of São Paulo in
2003, representing a stock indicator: 60,631 for Portuguese versus 39,091 for Math, a
difference of 55%. As, in general, the number of Portuguese and Math classes is the same in
elementary schools, both indicators confirm our hypothesis of the lack of Math teachers.
However, as we could already observe, the relative percentage of women among Portuguese
teachers seems to predominate.
Finally, in order to check whether there is actually a relationship between school
violence and a higher probability for teachers to get transferred from schools, we ran a logit
whose dependent variable corresponds to each teacher’s desire to change schools and the
covariates are their own characteristics, characteristics of the groups they teach and of the
schools where they work and some school violence variable.13 The marginal effects show that
the violence index is positively related to the teachers’ probability to change schools. But
when we replace this index with the indicators it comprises, we note that attempt on life and
presence of drugs guide the result of the violence index, as shown in the table below.
13
Table 9: Impact of school violence indicators on the probability of a teacher changing schools
Variable Coefficient SE
Violence index 0.00823* 0.00492 Attempt on life 0.04898* 0.02793 Theft -0.02386 0.02040
Robbery 0.05077 0.04552 Physical assault -0.01384 0.02044
Presence of weapons 0.00515 0.02066 Presence of drugs 0.03972** 0.01931 Gang attacks 0.00817 0.02056 Source: Saeb 2003.
Robust standard errors (SE).
***significant at 1% **significant at 5% *significant at 10%
Once again, we note the effect of drug dealing and/or consumption on teachers’ lack
of motivation. As previously outlined, the presence of drugs at schools seems to strongly
interfere with teachers’ daily work routine.
5. Final remarks
More often than not, the mass media report on the occurrence of several violent events
within or outside school premises. Is there any direct relationship between violence in these
schools and worse student performance, controlling for characteristics of the students and of
the teaching staff and for the infrastructure of these schools? Moreover, is there any indirect
association between violence in these schools and student performance, which includes
teachers’ loss of motivation? In this study, we investigated these questions and showed that
students who attended more violent schools usually had a worse performance on SAEB 2003
tests, even when the attributes of students, classes, teachers and schools were controlled for.
We also found evidence that violence affects more students at the lower tail of the proficiency
distribution. In addition, we found out that, besides this direct relationship between school
violence and proficiency, there seems to be an indirect association between these variables
that operates by means of teacher turnover. We showed that the occurrence of violent events
at a school is negatively correlated with the probability of groups having only one teacher
during the academic year, and positively associated with the probability of these groups
having problems with teacher turnover. For all these results, one should emphasize the
deleterious effect of the presence of drugs at schools: drug dealing and/or consumption seems
Nevertheless, it is important to highlight that these associations should be interpreted
with caution: as we pointed out, there may be endogeneity in the association between school
violence and student proficiency arising from the simultaneity of relationships between these
variables and/or by the omission of relevant variables, such as parent’s preference to enroll
their children in less violent schools. Thus, it is necessary to consider the limitations of the
results obtained in this study regarding the proposition of public policies against school
violence. Bearing this in mind, we can only say that policies that try to reduce school
violence, such as the Escolas de Paz (Schools of Peace) program in Rio de Janeiro, or the
Escola da Família (School for the Family) program in São Paulo, might be efficient in improving the quality of teaching. Also, policies targeted at combating drug dealing may
improve student learning, either due to the direct effects on the school environment or by the