AURELIO VITTORIO BONOLDI
Distressed Situation and Renegotiation Plan: a Case Study
AURELIO VITTORIO BONOLDI
Distressed Situation and Renegotiation Plan: a Case Study
SÃO PAULO 2014
Dissertação apresentada à Escola de Administração de Empresas de São Paulo da Fundação Getúlio Vargas, como requisito para obtenção do título de Mestre Profissional em Gestão Internacional.
Campo do Conhecimento:
Bonoldi, Aurelio Vittorio.
Distressed Situation and Renegotiation Plan: a Case Study / Aurelio Vittorio Bonoldi. - 2014.
58 f.
Orientador: Lauro Emilio Gonzalez Farias
Dissertação (MPGI) - Escola de Administração de Empresas de São Paulo.
1. Administração financeira. 2. Passivos (Contabilidade). 3. Dívida - Renegociação. 4. Planejamento estratégico. I. Farias, Lauro Emilio Gonzalez. II. Dissertação (MPGI) - Escola de Administração de Empresas de São Paulo. III. Título.
Distressed Situation and Renegotiation Plan: a Case Study
Dissertação apresentada à Escola de Administração de Empresas de São Paulo da Fundação Getúlio Vargas, como requisito para obtenção do título de Mestre Profissional em Gestão Internacional.
Campo do Conhecimento:
Economia e Finanças Internacionais
Data de Aprovação: 19/12/2014.
Banca Examinadora:
_________________________________ Prof. Dr. Lauro Emilio Gonzalez Farias
_________________________________ Prof. Dr. Edgard Elie Roger Barki
PlywoodCo. O objetivo deste trabalho é de entender porque a PlywoodCo. chegou na atual situação de estresse e, baseado nisso, propor um plano de renegociação de passivos compatível com esta situação com o objetivo de tornar a PlywoodCo. em uma empresa viável. Uma introdução é feita, a fim de colocar o leitor em contato com a PlywoodCo., apresentado as suas atividades, principais produtos, posição de mercado, bem como brevemente introduzindo sua atual situação. Após a introdução, a revisão bibliográfica é apresentada, descrevendo a teoria relacionada e utilizada neste trabalho. Mais adiante, a metodologia é apresentada, seguida por mais informações a respeito das operações da PlywoodCo., informações financeiras, relacionamento com stakeholders, índices operacionais,
demonstrações financeiras, cronograma de pagamento da dívida e depreciação. Depois, as premissas, analises e projeções não apresentadas, consistindo de duas partes: (1) uma seção de diagnóstico endereçando a atual situação da empresa; e (2) uma seção de projeção, que será dividida em duas partes: (a) projeções financeiras da PlywoodCo. na atual situação; e (b) projeções financeiras da PlywoodCo. no novo plano proposto. Finalmente, se conclui que a empresa precisará de esforços além da renegociação de passivos a fim de superar sua situação de estresse financeiro. Após a renegociação da dívida, a empresa precisará de R$ 23 MM até o fim de 2013.
Retraração: apesar de este ser um caso real, o nome da companhia não foi revelado. O trabalho foi produzido baseado em informações que refletem as operações da empresa até 31 de dezembro de 2012, enquanto as projeções estão baseadas em informações datadas até 30 de setembro de 2012.
objective of this work is to understand why PlywoodCo. got in its current distressed situation and, based on that, propose a financial renegotiation plan compatible to that situation in order to turn PlywoodCo. into a viable company. An introduction is made, in order to put the reader in touch with PlywoodCo., presenting its activities, main products, market position as well as
briefly introducing the company’s current situation. Following the introduction, the literature review is displayed, describing the theory related to and applied in this work. Later, the methodology is presented, followed by further information on PlywoodCo.’s operations and financials, highlighting the company’s relationship with stakeholders, operational indexes, financial statements, debt schedule and depreciation schedule. Than the assumptions, analysis and projections are presented, consisting of two parts: (1) a diagnose section addressing
PlywoodCo.’s current situation; and (2) a projections section, which will be divided in two further micro parts: (a) PlywoodCo.’s financial projections in the current debt schedule it is in; and finally (b) the financial situation of PlywoodCo. under the new proposed plan. Finally, it is concluded that PlywoodCo. will need further efforts besides the debt renegotiation in order to overcome its distress situation. After renegotiating the debt, the company will need R$ 23 MM until the end of 2013.
Disclaimer: although this is a real case, the real name of the company was not disclosed. The
work is developed based on information reflecting the company’s operations until December
31st of 2012, while the projections are based on information up to September 30th of 2012.
1 INTRODUCTION ... 8
2 LITERATURE REVIEW ... 9
2.1 Literature review on financial and corporate distress ... 9
3 METHODOLOGY ... 16
4 THE COMPANY: PLYWOODCO. ... 19
4.1 Restructuring plan design ... 19
4.2 PlywoodCo.’s Operations ... 21
4.3 PlywoodCo.’s relationship with its stakeholders ... 24
4.4 PlywoodCo. financial statements and other information ... 26
4.4.1 Revision on financial statements analysis and modeling ... 26
4.4.2 PlywoodCo.’s financial and other information ... 28
4.4.3 Other important information ... 31
4.5 The Origin of PlywoodCo.’s current situation origin ... 33
5 PLYWOODCO.’S PROJECTIONS ... 39
5.1 Main assumptions ... 40
5.2 Summary of the projections: with current debt schedule ... 43
5.3 Summary of the projections: refinancing debt ... 45
6 CONCLUSION ... 49
7 REFERENCES ... 50
8 APPENDIXES ... 53
8.1 PlywoodCo. projected balance sheets: 2012-2013 ... 53
8.2 PlywoodCo. projected balance sheets: 2013-2017 ... 54
8.3 PlywoodCo. projectedincomestatements: 2012-2013 ... 55
8.4 PlywoodCo. projectedincomestatements: 2013-2017 ... 56
8.5 PlywoodCo.projected cash flow statement: 2012-2013 ... 57
1
Introduction
PlywoodCo. was the only Brazilian plywood producer entirely focused on the civil construction industry in 2012, delivering in Brazil and abroad. Its products are considered to be high-end and with greater quality than its competitors. They consist of several types and several thickness of plywood covered with phenolic film, and are mainly used to shape the concrete during the construction of a building. PlywoodCo. also develops custom made cuts on the plywood to shape non –standard segments of the construction.
In order to benefit from the civil construction boom experienced in Brazil between the years of 2006 and 2010, especially in São Paulo, PlywoodCo. decided to expand its production capacity and, therefore, began to build a new production site in early 2008, with new and imported machinery. To do that, PlywoodCo. accessed several banks asking for loans, which were almost instantly approved. Most of the loans to build the new factory were obtained through the BNDES (Brazilian National Development Bank), using a credit line called FINAME, in which commercial banks are the intermediaries between BNDES and the lender, extending loans at a relatively (for Brazilian standards) low rate for the company to buy new machinery.
Approaching the end of the new plant’s construction, PlywoodCo. began to experience its first problems. Several internal and external factors contributed to the situation that was gaining form: (1) the boom of civil construction that Brazil had experienced was
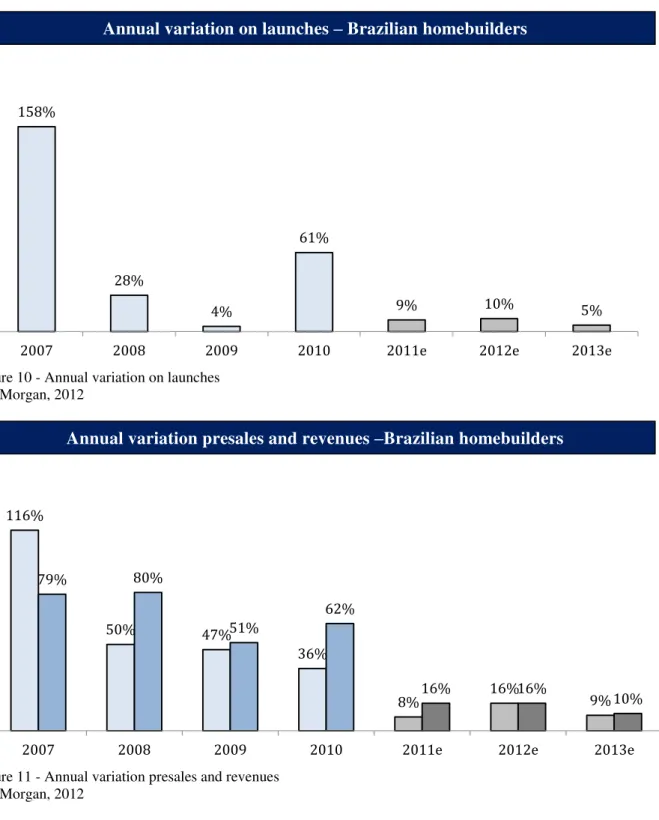
fading lowering PlywoodCo.’s expected future revenues. Figures 10 and 11 display that the annual variation of new launches in the Brazilian homebuilders sector in 2011, and the annual variation of presales and revenues of the sector, portraying that the expected levels of launches, presales and revenues for the years to come were decreasing (J.P. Morgan, 2011). (2)
There was a project problem during the new plant’s construction, which meant that parts of
the construction had to be rebuilt while all the money from the loans had already been spent. Summarizing, PlywoodCo. was in a situation where its revenues were not growing as planned, it did not have enough money to finish the plant, which would generate new revenues, and had a debt due in the short term that its current operation, cash flows and statements could not support.
viable company through the debt refinancing, this is pursued side by side with the company’s
plan to finish building its new plant.
PlywoodCo. is in distress. The renegotiation plan has to take into consideration that PlywoodCo needs time to regain its margins and profitability, and to be able to finish its
new factory. It’s hypothesized that PlywoodCo. can get out of its distressed situation with the help of a financial renegotiation, but will need further efforts (such as capital injection) to become a viable company in the long term.
2
Literature review
The literature in corporate distress and turnaround strategies is vast and fragmented in different approaches regarding the distressed situation the companies face>. Saudarsanam & Lai (2001) base their study on the effectiveness of such strategies on four different perspectives of corporate turnaround strategies: (1) managerial restructuring perspective; (2) operational restructuring perspective; (3) asset restructuring perspective; and (4) financial restructuring perspective (perspective which was used in this work to further detail what is financial distress).
In this section a review of the literature on corporate distress will be conducted, putting emphasis on the financial restructuring perspective, as that is the aim of this work.
2.1 Literature review on financial and corporate distress
As previously stated, research on strategies to overcome corporate distress have been assessed from four different perspectives of restructuring practices. In this section literature on each of these four approaches will be introduced, emphasizing the literature on financial restructuring approach.
Managerial restructuring perspective
seen by the market (meaning bankers, investors, employees and other stakeholders), as it is a
tangible change in the company’s routines in the eyes of its stakeholders (Slater, 1984).
In this subject, authors have also emphasized the role and the importance of the Chief Financial Officer in the implementation of the turnaround strategies (Periodical Reviews, 1984; Gray, 2001), who will be responsible for executing financial strategies during the whole process of company’s restructuring, ranging from accessing available and payable
financing, evaluation of company’s profitability and plan to strengthen it, and controlling the
company’s cash.
Although top management shift has been seen as a first step to overcome a financial distress situation, the relationship between top management movements and a distressed company performance on the stock market has been dubious. There have been works providing conclusions on positive, neutral or negative relation to top management changes in distressed companies (Saudarsanam & Lai, 2001 as cited in Bonnier and Bruner, 1989; Khanna and Poulsen, 1995; Warner, Watts and Wruck, 1988; Weisbach, 1988), leaving the prior affirmed consensus a different light, even if this dubiousness is only identified when analyzing the stock market performance.
Regarding CEO turnover in a context of distress, Evans III, Luo and Nagarajan (2014) have compared the CEO’s incentive problems of distressed firms in the 1980s with
distressed firms in the 1990s, with the goal of understanding the causes and consequences of CEO turnover. From that comparison, the authors have found that the retention of highly skilled CEOs has been possible due to the increasing bargaining power of the creditor (which take an important role in that retention), which were able to provide incentives to improve the
company’s performance.
Operational restructuring perspective
As presented by different authors (Saudarsanam & Lai, 2001; Slater, 1984; Pearce II, 2007) the operational restructuring perspective in turnaround literature is related to the
objectives of restoring the company’s profitability (basically either by enhancing sales or reducing costs), improving the company’s margins and efficiency.
Saudarsanam & Lai (2001) state that often, the operational restructuring actions are the first to be implemented in a company in a turnaround scenario, whereas they are the fastest measures to be implemented and the fastest to provide tangible figures on the
The operational restructuring approach has been widely studied and proven to have an impact on the success of a turnaround process, although understood not to be the only approach that lead to that success (Saudarsanam & Lai, 2001 as cited in Finkin, 1985;
Hambrick and Schecter, 1983; John, Lang and Netter, 1992; O’Neill, 1986; Pearce II and
Robbins, 1993).
Asset restructuring perspective
Asset restructuring is connected to strategic decisions related to the company’s
operating and non-operating assets, focusing in reorganization of business units, divestments and investments (on assets per se or acquiring businesses) (Saudarsanam & Lai, 2001).
From the divestment perspective and from the portfolio standpoint, the restructuring occurs by selling the assets and business units that are not profitable to the company (meaning they are cash consumers rather than cash generators) and/or are not related
to company’s core activities. That way, by divesting, the company is not only saving cash, but it is also generating some through the sale (Slater, 1984).
Although spending cash on investments may not have the highest priority when in a distress situation, companies that have not fully deteriorated yet may find capital expenditures (meaning buying or building new plants and equipment, for example) and acquisitions to be contributive to future cash generators to the firm. These investments can improve efficiency, reduce costs, generate synergies, which can all lead to a medium term cash generations(Saudarsanam & Lai, 2001).
Financial restructuring perspective: detailing what is financial distress
A financial restructuring is needed when a company finds itself in a financial distress situation. Several authors have defined the concept of financial distress: according to Gentry et al. (1990) when a company’s cash inflows are lower than the company’s cash
outflows is a situation of financial distress. Brigham et al. (1999), on the other hand, states
that the situation of financial distress occurs when the company is not able to honor its obligations (or give this impression to the market).
with its debt obligations. From a different perspective, Jantadej (2006) understands that a company with three consecutive periods of losses is in financial distress.
For Trussel (2013) the condition of being financially distressed is related to the consequences of the distress situation. He states that “financial distress is a condition in which
an organization is experiencing financial problems that could lead to a variety of undesirable consequences including reducing or eliminating programs, eliminating workforce, missing
debt service, or, ultimately, ceasing to exist”.
In addition the definitions of financial distress, authors have also enumerated several signals that are given by companies in this situation. Kordestani, Biglari and Bakhtiari (2011 as cited in Banks, 2005) present several indications that signal to a financially
distressed situation: “increase in the cost of capital, stricter requirements by creditors and
suppliers to finance the company, decrease in the cash flow, increase of financial leverage, and regular change of the key employees”.
Reasons for being in a situation of financial distress have also been studied by several authors, both from external (macroeconomic disturbance, shifts on market’s demand, change on county’s legal and economic policies) and internal (high debt, capital structure, management practices) origins (Madrid-Guijarro, García-Pérez-de-Lema and van Auken, 2011 as cited in Pompe and Bilderbeek, 2005; Denis and Denis, 1995; Sheppard and Chowdhury, 2005; Segarra and Callejón, 2002).
Madrid-Guijarro, García-Pérez-de-Lema and van Auken (2011) have studied 1006 Spanish manufacturers to understand external factors (through Porter’s five competitive
forces model) and internal factors (through resource base view strategic variables) associated with financial distress. Their results show that low technology firms, when in a context of high competition, have higher probability of experiencing financial distress. Also to low technology firms, high bargaining power of buyers and high rivalry were positively associated with financial distress. On the other hand, in high technology industries the external factors did not influenced the financial situation of the firm.
financing activities; (2) negative cash flow from operations, negative cash flow from investments and positive cash flow from financing activities; (3) positive cash flow from operations, negative cash flow from investments and negative cash flow from financing activities; and finally (4) negative cash flow from operations, negative cash flow from investments and negative cash flow from financing activities. The authors conclude that, in the Iranian case, cash flow composition can be useful for management to foresee a distressed situation ahead of them, as the four compositions presented above were significantly related to future financial distress.
According to Saudarsanam & Lai (2001) there has not been extensive study and focus on financial restructuring on the theme of corporate turnarounds, being one of the key elements on their study. In their work they define financial restructuring to be “the reworking
of a firm’s capital structure to relieve the strain of interest and debt repayments and is separated into two strategies: equity-based and debt-based strategies”.
The most relevant information on the equity-based strategies, as proposed by the authors, are related to dividends. When in financial distress and not being able to pay its debts, it would be a very negative sign to the creditors if the owners of the company are withdrawing
cash in terms of dividends in detriment of honoring the company’s obligations.
As shown by DeAngelo and DeAngelo (1990), it is common for companies in a situation of distress to cut or omit their dividend policy and distribution. The reasons for that can be either internal to the company, as its cash flows can no longer sustain a heavy and frequent dividend distribution; or external to the company, in order to strengthen the
company’s side in a discussion with the firm’s creditors.
The debt-base strategies, which will be the main direction on the financial renegotiation plan proposed in this work, are related to the restructuring of a company’s debt,
which is pursued in order to avoid a full or partial default of its obligations– which could be already happening or projected to happen in the short term.
that recovery firms made more use of asset strategies, which involved investments and acquisitions, in order to get out of the distress situation.
On the theme of debt restructuring, Pustylnick (2012) has studied the financial restructuring of a project (not a whole company itself), finding out that restructuring debt, in the case of a project, has more advantages than changing the project management and contractors. Although the analysis conducted by the author is done on a simple model, the
author argues that “the best solutions for negative NPV problems are deferring of payments and restructuring of cash disbursements as a part of the project financial agreement”
(Pustylnick, 2012).
An interesting case on financial distress and restructuring, which is similar (despite the differences in the companies’ sizes) with PlywoodCo.’s case is the Thai Petrochemical Industry case. The company, which was established in 1978, started facing problems and financial distress in mid-1997. The reasons for that were very similar of the ones PlywoodCo. encountered.
Thai Petrochemical Industry had accessed the market in order to borrow a great amount of money with the objective of building upstream units for its integrated petrochemical complex. Due to the macro-economic problems – the downturn suffered by the industry at that time due to the Asian crisis – and internal problems the company started facing financial distress. More specifically, the company was in that situation due to (1) increase in working capital needs due to the ramp up phase of these new units; and (2) petrochemical industry downturn, which led to a decrease in sales for Thai Petrochemical Industry (Vikalpa, 2013).
The literature related to financial distress in Brazil has connection with the theme
of “Recuperação Judicial”, which is the equivalent of a chapter 11 in the United States, with
few but relevant differences. The Recuperação Judicial law (11.101) is fairly new in the
country, as it started being practiced in 2005.
The 11.101/2005 law was created to substitute the previous law (7.661/1945) as the later was not successful in guaranteeing the recovery and further sustainability of the failing company. The new law has been considered to be better than the previous one as it provide higher basis for the failing companies to overcome the distress phase and, later, recover from it.
filing for 11.101 law is only the first solution when the situation of a company achieves a heavily deteriorated situation, in which the debt renegotiation will not viable in the short, medium or long term (Kirschbaum, 2009; Fux, 2012; Ayoub&Cavalli, 2013).
The financial instrument of debentures was widely used in by Brazilian companies in order to renegotiate its debts. A study conducted by Rodrigues and Junior (2013) has shown that especially through the decades of 2000s, almost all debentures issued were destined to the refinance of a company’s debt. Figure 3 below, with information retrieved from that study, show that until 2009 almost all debentures issued had that objective, with the percentage falling in the following years, reaching approximately 20% in 2012.
Figure 1 – Percentage of debentures emissions in Brazil destined to refinance a company’s debt
Rodrigues and Junior, 2013
One case to exemplify the information provided by Rodrigues and Junior in their study is the refinancing of Rodovias do Tietê debt through the issuance of a debenture. Rodovias do Tietê is a Brazilian highway concessionary company with 406 km under concession, which was trying to access the market to collect R$ 650 million in May 2012. These funds were needed in order to fully pay the company’s liabilities due in the short term
(Pinheiro, 2012).
Lopes and Assis (2009) wrote a book on management of financial crisis and turnaround, in which they list five situations that would lead the person in charge of the business to conclude it is in distress. The list is: (1) drop on profits or repetitive losses; (2) accumulation of tax liabilities; (3) increase in bank debts; (4) delay of supplier’s payments; (5) delay of workforce payments.
100%
82%
95% 100% 100% 100%
62%
72%
18%
0% 20% 40% 60% 80% 100% 120%
In their book, the authors also provide that, in order to get out of the distressed situation, the company must work towards two different actions: first the CEO or the entrepreneur must focus on enhancing its operational results (or EBITDA), by searching for better margins, rearranging its product mix and cutting costs. Second, the person in charge must seek a liabilities renegotiation, with the purpose of stopping the struggle with financial problems on the day-to-day activities, and permitting the focus on the company’s operations.
Corporate financial distress has yet to be further studied in the Brazilian context, as there are very few studies on financial and liabilities renegotiation outside the recuperação judicial context in Brazil.
3
Methodology
The methodology used in this work is of a single case study. A case study is
defined “as a form of research, (…) defined by interest in individual cases, not by the methods of inquiry used” (Stake, R., 1998 as cited by Johansson, R., 2003). The case to be studied has to have three features, according to Johansson (2003): (1) “has to be a complex functioning unit”; (2) “has to be investigated in its natural context with a multitude of methods”; and (3)
has to be contemporary.
Johansson (2003) also puts that “the essence of a case study methodology is triangulation”, which is a term the author uses as a short for “the combination of different levels of techniques, methods, strategies, or theories” in order to develop the given case study
methodology. In the case of this work, this multitude will be understood as tools.
Moreover, in his paper, the author proposes a discussion on the generalization and reasoning of a case study, in the terms of its methodology. Taking the four different procedures presented by the author (hypothesis testing, theory generating, naturalistic generalization and synthesizing a case), the procedure to be used in this work is of synthesizing a case.
Johansson (2003) described this procedure as a synthesizing of a case “from facts in the case and a principle (theory)”. The mode of reasoning in this perspective is abductive,
meaning that the mode of reasoning is originated from a “very curious circumstance, which
would be explained by the supposition that it was a case of a certain general rule, and
As part of the methodology, and as previously stated, there were four tools that were part of this work, used in order to achieve what was proposed in the objective section; that is, first understand why PlywoodCo. reached in its current distressed situation, than propose a financial renegotiation plan compatible to that situation in order to turn PlywoodCo. into a viable company.
The first tool that was used in this work was of financial restructuring and turnaround, most specifically the theory presented by Lopes and Assis (2006) in order to diagnose if PlywoodCo. is currently in a distressed situation. The five situations described by the authors as signs of financial distress served as base to determine whether PlywoodCo. is in distress or not.
The second tool that was used was of financial statement analysis. This was necessary in order to help understand and diagnose if PlywoodCo. is really distressed, giving support to the analysis proposed by Lopes and Assis (2006), as described in the paragraph above, and later to understand how the company got in the current distressed situation.
The third tool that was used was of financial statements modeling. This tool was
highly relevant in order to project the company’s viability in the short and long term with and without the liabilities restructuring. The main objective here was to project the company’s
operational activities and investments needs in order to understand PlywoodCo.’s payment
capacity, and to understand if the company will be able to support its financial renegotiation through its operational cash flows or it will need further efforts (as detailed in the fifth section of this work) to do so.
The fourth tool that was used were the conversations and interactions with the
company’s main executives and employees. This tool was relevant to support all other tools as well as better understand the company’s operations, as more detailed information about the
company’s day-to-day and relationship with the market (meaning relationship with banks, suppliers, clients and other stakeholders) was collected from them.
The participants of the analysis consist of the company itself and its key employees. Regarding the company, it was necessary to understand its financial situation to date and project the expected future financial situation for the following years. Not only its
financial situation, but also the company’s production situation to date is relevant to the
the outputs of the management’s financial and operational decisions, but also is the base of the forecasts in the valuation modeling.
Regarding the key employees, they consist of: (a) the main partner and CEO of
PlywoodCo.; (b) PlywoodCo.’s CFO; (c) PlywoodCo.’s commercial director; (d) PlywoodCo.’s Production Planning and Control manager. Their input was essential to the work because they live the company on a daily basis, and not only know some of the details related to each of their areas, but they know better about the product they sell, the market they are in, the new markets they could enter, their competition and other important information,
essential to better understanding the company’s history and to project its future. The
justification for choosing these employees as participants is that they were the decision makers of the company, meaning that no relevant decision (decisions important enough to lead the company’s trajectory) was taken by other employees led the company to its current situation.
Further participants to the analysis were PlywoodCo.’s suppliers, bankers and
clients. These participants weren’t easy to be accessed, and just a few were interviewed. Their contributions to the work were of giving an external view of the company, that is, how people from outside see PlywoodCo. and its current situation.
The company’s main partner and CEO provided information on the company’s
relationship with its stakeholder (mainly banks, suppliers and clients), pointing out how this communication with these various stakeholders had evolved during previous years and how was it now. Moreover, the CEO provided information on the projected market the company could be able to reach in terms of sales, helping on the producing of the sales forecasts and projections presented on this work. Due to its size and rapid growth, PlywoodCo.’s CEO was
the main sales force of the company, as they had not developed a formal sales team. Therefore,
as the main contact with clients since PlywoodCo.’s begginings, the company’s CEO had
acquired knowledge and a very experienced view of the market. It is important to highlight, however, that the sales projections might be affected by the CEO’s overestimations, but the numbers projected were part of PlywoodCo.’s sales targets, being demanded from the
company’s unstructured sales force (including the company’s CEO).
PlywoodCo.’s CFO did not actually filled the role of a CFO, performing a role
PlywoodCo.’s financial information to date, such as the balance sheets, income statements, cash flow statements and detailed information on the company’s debt schedule and
depreciation schedule.
PlywoodCo.’s commercial director provided a more detailed view of the
company’s relationship with smaller clients, as the big homebuilders were addressed by the company’s main partner and CEO. Also, the commercial director was responsible for the relationship with the log producers, one of the main raw materials used by the company in terms of participation on costs. He was responsible for providing the information of the costs difference between Mafra and União da Vitória plants.
The Production Planning and Control manager was responsible for providing almost all production indexes of the company. These were essential on the development of the
company’s projections. The production indexes were mainly used in order to properly calculate the company costs.
Finally, the banks, suppliers and clients were relevant to the analysis as they
provided a different perspective of the company’s relationship with the market, telling their side of the story. On the banks side, moreover, they provided the assumptions for the
possibilities regarding the refinancing of PlywoodCo.’s debt. It is important to highlight, in a usual process of debt restructuring, when asking for a debt refinancing, the natural way is that the debtor (PlywoodCo.) proposes a refinancing schedule compatible with its payment capacity to the banks. In this case, due to the poor relationship with the company (as it is detailed further in this work), the banks provided what would be an acceptable schedule, leaving to the company with the burden of trying to reach the payment capacity needed to fully pay its debt in that given schedule.
4
The company: PlywoodCo.
4.1 Restructuring plan design
In order to fulfill the objective of the thesis and, therefore, propose a plan to help PlywoodCo. renegotiate its liabilities and end its distress situation, it is important to propose a plan not only good for the company itself, but also its creditors. Therefore, the plan should focus and be designed in a way it does not only in protect PlywoodCo.’s assets and reduce its
debts costs, but also protect the creditors interests (Krueger, 2002). As previously stated, this
The work will be divided in two macro parts beginning with (1) a diagnose
section addressing PlywoodCo.’s current situation; followed by (2) a projections section,
which will be divided in two further micro parts: (a) projections of PlywoodCo.’s financial
projections in the current debt schedule it is in; and finally (b) the financial situation of PlywoodCo. under the new proposed plan.
In the diagnose section, first an analysis of the company’s “financial history” and “operational history” was conducted, understanding chronologically the financial and operational outputs of the decisions made by the managers, also understanding the
consequences and impacts of these decisions on the company’s current distressed situation. In this section was also highlighted why the company needed the debt to sustain its negative flows (caused by poor operational results or by investments). Also important, it was distinguished the difference between the company’s symptoms and causes of its situation. Symptoms are signs or clues of what could or could not be right with the company, while causes have a direct connection with management actions (Slatter & Lovett, 1999).
In the projection of the current situation section, based on the financial history, operational history, historic data, financial statements of the company as well as the inputs
from the conversations with the company’s main team, a financial model was made, in order
to understand the company’s payment capacity. It will be presented in the work the outputs of this financial model based on the company’s current debt schedule (meaning its current debt
outflows), suppliers due outflows, taxes financing outflows, working capital needed and production capacity. Based on it, and as a result it was able to present the company’s capital
needs to support the negative cash outflows. In a natural process of financial renegotiation, this analysis would be the support to the financial renegotiation proposition, as in the renegotiation with the banks and suppliers we cannot ask for more than the company needs,
otherwise they won’t see the real necessity of stretching the due dates of payables, changing
the payments dates, giving the company grace periods or even a goodwill, and probably will not do it; also, this renegotiation can only be only be supported by a model that shows that the
current situation is not viable to the company and will result in a “Recuperação Judicial”
(equivalent to a Chapter 11 in USA), or bankruptcy.
In the financial model after the renegotiation plan proposition, it will be presented
for the same reasons. It is also important to show that the company is able to sustain this new situation and, therefore, is able to honor its liabilities.
4.2
PlywoodCo.’s Operations
As previously stated, PlywoodCo. is a plywood producer located in Brazil. The company has currently three operational units, as displayed and detailed on figure 2 below. The process of producing the plywood (the company’s workflow), from the wood log to sales, as well as which factory is responsible for each stage of production, is represented in figure 3 below. It is possible to see the two final product sold by PlywoodCo.: (1) Plywood covered with phenolic film (plywood) and (2) Concrete forms and/or pre-cut concrete forms covered with phenolic film (forming systems). The difference between product 1 and product 2 is that in the first the shapes and sizes are standard, while in the later PlywoodCo. cuts the plywood as requested by its clients.
Figure 3–PlywoodCo.’s workflow
Elaborated by the author
PlywoodCo.’s workflow starts at the laminating and drying section. First, the raw log is cooked, in order to peel its skin off and make the laminating process possible, which is the second stage of the workflow. In this stage the log is cut in very thin peals of wood, which will be further pressed together to form the laminate. After this stage, the laminated sheets of wood are put to dry at an oven.
After that the plywood production stage begins. The first step is to glue the sheets of wood together in order to form the laminate. In this stage, several thicknesses of laminates are fabricated, which depends on the amount of sheets of wood that are glued together. Following the gluing phase, the laminates are pressed and, later, receive the finishing, which includes applying the phenolic film and trimming the laminate board.
At this point in the workflow, one of the company’s products is finished: the
plywood covered with phenolic film, which will be partially directed to sales in the domestic and external markets. The other part will be directed to the second product of the company, as a raw material. With the plywood, the company produces its concrete forms and precut concrete forms, which are basically the plywood covered with phenolic film but cut to fit a
client’s specific (not standard) needs. The sale of this product can be done by internal sales team and third parties.
important to highlight that, although Mafra is a less productive plant in comparison to União
da Vitória, it’s being used for laminating due to raw material availability. Log prices are lower as log producers are abundant in the region.
For the production of plywood stage, União da Vitória has a capacity of producing 4,500 m³ of plywood, but is currently producing 3,500 m³ per month. In Mafra, due to its unfinished building, is not possible to produce any plywood. Finally, for the concrete forms stage of production, PlywoodCo.’s Barueri plant has the capacity of producing 60,000 m² of
concrete forms, but is only producing 42,000 m² per month.
Figure 4–PlywoodCo.’s production indexes
Elaborated by the author/PlywoodCo.
Figure 4 above describes in detail the laminating and drying phase, comparing both factories: Mafra and União da Vitória. The understanding of this detailed information will be relevant for producing a more detailed financial model for the company.
Going by the path through União da Vitória, we can see that 1m³ of log will become 0.70 m³ of dry laminates – this happens because 0.30 m³ of log is lost due to bark removal and perfectly rounding the log. When those 0.70 m³ of laminates are cut, glued and pressed together, they become 0.56 m³ of plywood – at this point resign and film are added to the plywood.
Now going by the path through Mafra, we will understand why this is a less productive facility when compared to União da Vitória. Differently from União, in Mafra 1 m³ of log will become 0.65 m³ of dry laminates (7% less than União). The next stage numbers are based on estimates, as Mafra has never produced plywood. By the company’s estimative,
Laminating and Drying
Energy Work Force
Rent
1m³ of Log
M afra
0.70 m³ of dry laminates
1m³ of Log
0.65 m³ of dry laminates
Resin Film
Energy Purchase Shipping
Nail Sawn Wood
Energy
Purchase Shipping Rent Fixed Work Force
0.56 m³ of
plywood 0.52 mplywood ³ of
26 m² of forming systems
Selling of
Plyw ood Selling of Plyw ood
the 0.65 m³ of dry laminates will become 0.52 m³ of plywood - the conversion rate is the same as in União da Vitória, being 80%.
As highlighted in the workflow explanation above and detailed in the previous
sections of this work, one of the problems PlywoodCo. was facing was that its Mafra’s factory
needed more resources than previously predicted to be completed. As of the end of 2012, the Mafra factory could only produce laminates. The additional investment needed for the
factory’s completion is of approximately R$ 6 MM. Without that investment, the plant is only
producing dry laminates, not being able to produce any plywood.
4.3
PlywoodCo.’s
relationship with its stakeholders
PlywoodCo.’s relationship with the banks as a client was highly damaged,
especially with the banks with higher risk (with higher sums of money lent to the company). The reason were two: first the banks had already noticed that PlywoodCo. was not performing well and had delayed some of its payments due in the last months; and secondly (and most importantly) the company, in the figure of its main partner, had made several promises to the banks that were not fulfilled, damaging his reputation.
The banks did not want to negotiate with PlywoodCo.’s main partner anymore, which made the renegotiation of the company’s debt harder, as the banks were reluctant to provide extensions (more than two years) in the company’s debt payment schedule.
The main reasons for the behavior (the promises that were broken) were that: (1)
when applying for the debt to build the new factory, PlywoodCo.’s main partner’s thesis took
into account the sale of a personal asset valued at R$ 5 million at the time, which would be injected in the company. Later, the company informed that (due to reasons badly explained and non-transparent to the banks) the asset’s value was actually R$ 3 million and that it was
not for sale anymore. (2) Besides that, the banks had been requesting PlywoodCo. information regarding the dividends paid for more than one year, information which was never made
available. This unavailability made the banks believe that the partner’s remuneration had been
higher than it should have, draining resources from the company which led to delayed debt payments and also the request for a renegotiation of its debt.
Besides the damaged relationship with the banks, there was also the problem of
have PlywoodCo. as a client. The company was classified as a SME (small and medium), so its interlocutors inside the banks were people at lower positions which had less decision
power and less oriented to solve the company’s problem (being more preoccupied in saving
his or her job).
The size of the debt indicates which area in the bank would be involved in the
company’s negotiation – the restructuring area of the bank, which takes care of big restructurings and is more used to structure deals of this nature on the daily basis; or the credit area, which is not used to such deals. The size of the PlywoodCo.’s debt being restructured
was not big enough to be directed to the restructuring area of the banks , and the negotiations would have to be done with personnel from the credit area, less oriented in solving the
company’s problem.
On the suppliers side the situation was better but not good either. The company had already delayed some of the payments due to key suppliers, who were already reducing the payment terms, increasing the cash squeeze. Besides that, the company had seen its Serasa filings increase (these fillings occur when a company delays a payment and does not renegotiate or pay it, becoming a debtor) which is an indicator of the beginning of a
company’s insolvency.
In the same way as the banks, PlywoodCo.’s main partner had made several promises to the company’s key suppliers involving “paying these debts from his own pocket”. These promises were also not fulfilled, leaving the company’s and the partner’s image eroded
with suppliers as well.
As detailed above, PlywoodCo.’s financial renegotiation plan will not be an easy one as it will suffer the influence from the company’s relationship with its stakeholders, more
specifically its suppliers and banks.
4.4 PlywoodCo. financial statements and other information
Below are presented the financial statements of PlywoodCo. along with other information, specifically yearly balance sheets from 2009 until September of 2012 (which will be the opening balance sheet of the projections, as it was the last balance sheet available at the time the work was done); yearly income statements from 2009 until 2012; depreciation and debt schedules; and other important information.
Before presenting the previously described information, a revision on financial statement analysis and financial statements modeling is made, as both are tools which will be
used in this work in order to model PlywoodCo.’s situation. It will be further described, in the section 6 of this work, when did the financial distress occurred, justifying the period of financial statements considered in the analysis.
4.4.1 Revision on financial statements analysis and modeling
The following literature review is presented in this work as it will be the base of
PlywoodCo.’s financial statements analysis, problem’s diagnosis and the projections of the company’s cash generation. As previously seen in the literature on restructuring and turnaround, the projection of the company’s cash generation is primordial in understanding
the PlywoodCo.’s payment capacities, that is, understanding if PlywoodCo. will be able to
fully pay its debts if they are renegotiated.
Financial statements analysis
In Brazil the Lei das Sociedades por Ações (Brazilian Corporate Law – free translation) is the law that regulates companies with capital stock and that trade or would want to trade in the future in the stock market. This law specifies the elaboration and publication of several financial statements. Although PlywoodCo. is not subject to this law, as it is a limited partnership, it had to use the same financial statements standards in order to access the debt market. The financial statements used to analyze PlywoodCo.’s financial history were: (1) balance sheets, (2) income statements, (3) cash flow statements and (4) accumulated earnings and losses statement.
The balance sheets are usually referred figuratively as a picture of the company’s
liabilities, payables, debts and equity, at a given point in time (usually the end of a year or end of a trimester).
Income statements are a summary of the company’s activities during a period of
time (which is also usually one year or a trimester) which results in profits or losses, that is,
the company’s revenues, costs, general expenses, financial expenses and tax expenses
Cash flow statements explain and demonstrate the amounts of cash that enter and leave the company during a given period (usually being one year or a trimester), dividing it in three main categories: (a) operational activities (working capital), (b) investing activities and (c) debt activities. Through the cash flow statement is possible to understand how the company used the resources generated from its operations and also the use of resources coming from creditors and shareholders.
The accumulated earnings and losses statement shows how the net profits generated by the company is split: the part that goes to the payment of dividends to the partners and the part that is retained in the company for further investments. It is important to understand the objective of each of the statements, as the analysis of them will lead you to the
company’s financial history and financial outcomes of the management decisions (Marion, 2009).
The analysis of each of the statement has particularities to be considered and, the reader and analyst must do the work in a critical way. Different conclusions may arrive by different practices or methodologies implemented when elaborating a statement. When analyzing a balance sheet, income statement, cash flow or earning and losses statement, the exercising of fair judgment is necessary as it is necessary to deeply understand the reality of the company, in order to draw conclusions from the statements that are compatible with the
company’s real scenario (Fridson & Alvarez, 2011).
Financial statements modeling
In addition to the financial statements previously described, some other
information will be needed in order to produce PlywoodCo.’s financial model. Specifically, it
is recommended that a model is derived from six major components: (1) balance sheets; (2) income statements; (3) cash flow statements; (4) working capital; (5) depreciation schedule; and finally (5) debt schedule.
operating terms, given a set of assumptions, through the years. The operating cash generation
is important for determining the company’s payment capacity (when refinancing its liabilities)
and its value (through the discounted cash flow method of valuation).
An important and high impact part of financial statements modeling is finding and determining the right set of assumptions, as future trends are often hard to predict. Usually, when developing projection for a company, an analyst spends a good amount of time understanding and researching the company itself, as well as the market it is in and the macroeconomic environment, in order to adopt assumptions that are as close to future reality as possible (Pignataro, 2013).
4.4.2 PlywoodCo.’s financial and other information
Balance sheet
in BRL Dec-09 Dec-10 Dec-11 Sep-12
Assets Current
Cash 38,481 75,142 177,739 127,693
Short Term Assets
Receivables 4,793,021 6,292,968 4,001,276 2,029,288
Inventory 3,031,113 3,289,901 5,490,113 6,450,521
Taxes to recover 214,584 185,936 161,643 135,725
Other 1,658,066 1,432,419 1,764,012 2,252,600
Total Current Assets 9,735,265 11,276,366 11,594,782 10,995,826
Non-current Long Term Assets
Finame to perform - 3,821,410 3,273,760 2,182,506
Total Non-current Assets - 3,821,410 3,273,760 2,182,506
Fixed Assets
Investments
Stock investments 503,810 503,810 503,810 -
Fixed Assets
Tools 3,005 3,005 - -
Machinery 6,919,545 27,469,962 35,726,258 36,315,955
Office equipment 231,641 303,750 412,817 718,525
Cars and trucks 15,874 15,874 133,874 251,874
Other fixed assets 343,597 343,597 358,297 196,636
Real State 16,636 16,637 196,636 410,797
(-) Depreciation (Acum.) -459,875 -549,327 -1,684,802 -2,482,721
Total Fixed Assets 7,574,233 28,107,307 35,646,889 35,411,065
Total Assets 17,309,498 43,205,084 50,515,432 48,589,397
Liabilities Current
Short Term Obligations
Suppliers 389,525 416,960 395,380 650,723
Social and Tax obligations 83,187 166,086 177,396 447,124
Debt w/ Financial institutions 5,444,565 6,490,579 10,788,171 10,567,404
Imports Financing 392,577 570,060 929,038 1,720,169
Salaries to pay 98,71 97,851 288,620 248,733
Provisions 142,877 182,844 281,099 255,764
Total Current Liabilities 6,551,446 7,924,380 12,859,705 13,889,917
Non-Current Liabilities Long Term Obligations
Social and Tax obligations 945,567 896,300 2,308,636 2,157,332 Debt w/ Financial institutions 637,628 1,221,899 1,358,508 -
Finame and Other Debts - 22,520,161 22,323,504 20,567,534
Total Non-current Liabilities 1,583,195 24,638,360 25,990,648 22,724,866
Total Liabilities 8,134,641 32,562,741 38,850,353 36,614,783
Equity
Capital 1,000,000 1,000,000 2,000,000 2,000,000
Profits and Losses 8,174,856 9,642,341 9,665,079 9,974,614
Acum. Profits 7,289,016 7,174,856 8,642,341 9,665,079
(-) Profits distribution -600,000 - - -
Current year's result 1,485,840 2,467,485 1,022,738 309,535
Total Equity 9,174,856 10,642,341 11,665,079 11,974,614
Total Liabilities + Equity 17,309,497 43,205,082 50,515,432 48,589,397
Table2 - PlywoodCo. Balance Sheet Source: PlywoodCo.
Income statements
in BRL 2009 2010 2011 2012
Operating Revenues 29,312,016 36,828,015 43,581,382 51,455,142
National Sales 27,114,292 34,319,870 38,385,892 42,594,773
Exports 2,197,724 2,508,144 5,195,490 8,860,369
Sales Deduction 5,064,079 6,367,982 7,245,395 8,874,048
Sales Taxes 5,064,079 6,367,982 7,245,395 8,874,048
Net Revenues 24,247,937 30,460,033 36,335,987 42,581,094
Costs of Goods Sold 21,111,034 25,615,932 30,384,276 35,254,249
Initial Inventory 2,678,104 3,031,113 3,289,901 4,290,113
Raw Materials
(Continues on the next page)
16,694,425 20,975,103 25,914,516
Final Inventory -3,031,113 -3,289,901 -5,490,113 -3,894,056
Costs of Production 4,769,618 4,899,618 5,624,994 6,702,886
Depreciation - - 1,044,977 1,135,475
Operational Results 3,136,903 4,844,101 5,951,712 7,326,844
Financial Revenues 51,250 60,613 2,857 -
Other Revenues 75,812 82,130 - -
Sales Expenses - - -456,709 -3,039,345
Administrative Expenses -609,418 -603,318 -874,043 -2,242,256
Financial Expenses -653,548 -1,133,548 -2,428,690 -3,610,375
Depreciation - - -90,499 -90,499
Net Operational Results 2,000,999 3,249,978 2,104,627 -1,565,132
Taxes – CSLL 210,688 370,655 387,780 827,895
Taxes – IRPJ 304,471 411,838 694,110 460,024
Results 1,485,840 2,467,485 1,022,738 -2,853,051
Table3 - PlywoodCo. IncomeStatement Source: PlywoodCo.
Depreciation schedule
PlywoodCo. main fixed assets sum approximately R$ 38 million in five main categories, which are (1) machinery and equipment; (2) office equipment and data processing;(3) vehicles; (4) properties; and (5) other properties. Table 4 details the investments per category.
According to Brazilian accounting standards, each of these categories has a different depreciation schedule. As these assets are partially depreciated, an approximate depreciation schedule was applied to them, as follows: (1) for machinery and equipment the depreciation rate is of 10% per year; (2) for office equipment and data processing, the depreciation rate is of 10% per year; (3) for vehicles, the depreciation rate is of 20% per year; (4) for properties, the depreciation rate is of 4% per year; and (5) for other properties, the depreciation rate is of 10% per year.
In terms of capital expenditures (CAPEX), apart from R$ 6 million directed to the conclusion of the Mafra factory (scheduled to be done R$ 1 million per month from January 2013 to June 2013), it is expected that the company invests 50% of its depreciation until the end of 2013 and 100% of its depreciation thereafter.
Main Fixed Assets
Machinery and equipment 36.315.955 Office equipment and data processing 718.525
Vehicles 251.874
Properties 196.636
Other properties 410.797
Total 37.893.786
Debt schedule
Table 5 details PlywoodCo.’s debt on the
end of September 2012. As seen, the main debt the company has is Finame, which is usually a long term debt destined to buy machinery and equipment, with relatively low interest rates and using the machinery and equipment as collateral.
All other debts (with the exception of
Leasing) are short term and mainly destined to be used on the company’s operations. The
highest interest rates are charged on the Overdraft loans, which are basically credit lines a company has with a given financial institution that can be used as the company needs (up to the pre-established limit). According to PlywoodCo., the amortization schedule for these debts are mainly due in the short term, in 2013, as on the graph below. This debt schedule is
incompatible with PlywoodCo.’s capacity to generate cash.
Figure5–PlywoodCo.’s debt schedule Elaborated by the author
4.4.3 Other important information
Below are presented other important information regarding PlywoodCo. (1) the evolution of revenues mix between domestic sales and exports; (2) the evolution of prices in
11.257
10.300
5.924
4.028
1.567
-
Sep/2012 2013 2014 2015 2016 2017
Typeof Bank Debt Amount (BRL) Finame 18.251.410 Overdraft loan 4.400.000 Working Capital 7.004.815 ACC / FINIMP 2.131.028 Leasing 1.065.747
the domestic and external markets for both products (Plywood covered with phenolic film and Concrete forms and/or pre-cut concrete forms covered with phenolic film);
Evolution of revenues mix
In the first quarter of 2010 the exports represented 14% of the plywood sold by PlywoodCo. By the end of the first quarter of 2012, this value reached 59%, while in the last two quarters of 2012 the value represented 40% of total sales. In each quarter, the participation of exports has been growing, with the exception of the second quarter of 2012, as seen on the figure below.
In the projections on the financial model, the revenues of exports represent 40% of total sales of plywood forms.
Figure 6 – Evolution of Plywood sold in each market Elaborated by the author
Evolution of prices
The plywood prices in the external market have been more volatile than in the internal market, as seen in Figure 7 below. It is possible to observe a slight upward trend in prices in the domestic market, which led to prices reaching an average of R$ 1.254 per m³ by the third quarter of 2012.
The average price in the external market in the last quarter of 2012 was lower because of low sales mix in August. With the exception of that month, the average is US$ 493
Evolution of m³ of Plywood sold and Exports Participation (%)
3,940
7,891
4,087 3,569 3,681 3,454 2,796 4,277 3,503 643
632
1,497 1,262 1,738 2,411 4,042 2,850 2,286
0% 10% 20% 30% 40% 50% 60% 70%
- 2,000 4,000 6,000 8,000 10,000
1 2 3 1 2 3 1 2 3
2010 2010 2010 2011 2011 2011 2012 2012 2012
per m³. In the projections, the average price used in the domestic market is R$ 1.285,00 per m³ and in the external market is US$ 548,00 per m³.
Figure7 – Evolution of plywood prices Elaborated by the author
Regarding the prices of forming systems, they have been volatile during the quarters, with higher prices at the end of the year, as shown in figure 8 below. In the projections, the average price used for forming systems is R$ 50,00 per m2.
Figure 8 – Evolution of forming system prices Elaborated by the author
4.5 The Origin of
PlywoodCo.’s
current situation origin
PlywoodCo. was experiencing a cash flow squeeze: the company was generating R$ 3,2 MM in EBITDA (as of 2012) while its debt (plus interest) due in the short term was of approximately R$ 24 MM (as of 2013). It was not possible for PlywoodCo. to fully pay its
Evolution of Prices – Internal M arket (R$/m³) Evolution of Prices – External M arket (US$/m³)
1,169
900
1,169 1,207 1,260 1,233 1,242 1,323
1,254
1 2 3 1 2 3 1 2 3
2010 2010 2010 2011 2011 2011 2012 2012 2012
497 532 523 583
546 580 558 538
415
1 2 3 1 2 3 1 2 3
2010 2010 2010 2011 2011 2011 2012 2012 2012
Evolution of Prices (R$ / m²)
51
47
64
53
46
58
46 51 50
1 2 3 1 2 3 1 2 3
debts without refinancing them . But first it is necessary to understand how the company arrived at this position.
As cited before, the company was facing a decrease in current sales and the expectations of future sales was also decreasing, as the boom in civil construction experienced
in the previous years was fading; while facing a project problem in the new plant’s
construction, needing more cash to finish the new factory. As the company financed the capacity growth through debt was also facing the pressure to service the debt and its amortization.
PlywoodCo.’s assumptions when developing its plan to build the new factory were (1) the civil construction sector was growing and would continue to do so, as seen by the
sector’s GDP variation of 26% YoY from 2007 to 2010 (IBGE, 2010), as shown in the figure 9 below, as well as on the launches and presales, as shown on figure 10 and 11; and (2) increase on the formality of the sector, driven by the amount of IPOs in the sector (as seen on figure 12 below), which would make harder for the sector’s players to be supplied by smaller and informal companies.
To capture part of this growth and developing market, PlywoodCo. traced an expansion plan, which involved building a new plant in Mafra starting in 2009, initially investing approximately R$ 36 MM, all financed through debt.
Figure 9 –Sector’s GDP YoY evolution
Sector’s
GDP YoY Evolution
125
95
79
63
+26%
2010
2009
Source: IBGE, 2010
Figure 10 - Annual variation on launches J.P. Morgan, 2012
Figure 11 - Annual variation presales and revenues J.P. Morgan, 2012
But, as seen by the numbers presented on figures 10 and 11, the sector did not continue to grow at the same pace as it was growing before the decision to build the new plant. With that, the company was facing an expected decrease in its sales for the coming years. In addition to that, the initial R$ 36 MM were not enough to finish the factory due to some
project’s errors; and an extra R$ 6 MM was needed to finish the plant in Mafra. 158%
28%
4%
61%
9% 10% 5%
2007 2008 2009 2010 2011e 2012e 2013e
116%
50% 47%
36%
8% 16% 9%
79% 80%
51%
62%
16% 16%
10%
2007 2008 2009 2010 2011e 2012e 2013e
Figure 12 –Evolution of participation of formal companies in the sector’s GDP
Elaborated by the author
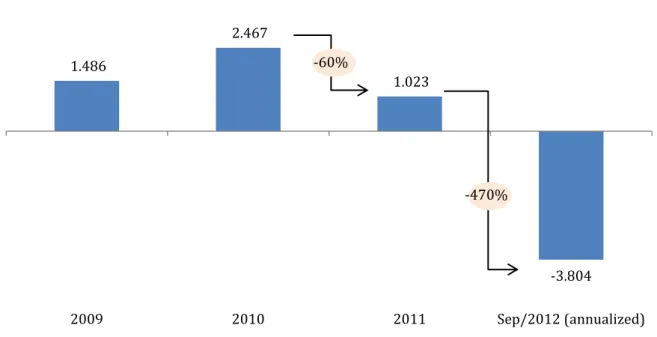
Analyzing PlywoodCo.’s situation through the perspective presented by Lopes and Assis (2009) and their five situations leading to financial distress, we can see why PlywoodCo. was struggling. Taking the first situation, drop on profits or consistent losses, we can see on the figure 13 that the company presented decreasing profits and losses: by 60% from 2010 to 2011 and by 470% from 2011 to 2012 (annualized). As presented by the authors, this is a sign of a possible financial distress.
Figure 13 –PlywoodCo.’s results evolution Elaborated by the author
1.486
2.467
1.023
-3.804
2009 2010 2011 Sep/2012 (annualized)
Taking the second situation, increasing tax liabilities, along with the fifth situation,
delay on workforce payment, we can see through the balance sheet account “social and tax obligations” (short term and long term) that the company increased its tax and labor liabilities by 153% from 2009 to Sept/2012, while its net revenues grew 76% on the same period. Again, this is a sign of a possible financial distress.
Moreover, during the talks with the CEO and CFO of the company, one of their major concerns was the monthly pressure to pay the workforce, which had been already experiencing delays that ranged from 1 to 10 days.
Figure 14 –PlywoodCo.’s social and tax obligations evolution Elaborated by the author
Taking now the third situation, increase of the bank’s debt, we can see from figure 15 the company’s debt has increased as of 2010, due to the debt taken to build the new factory.
It is important to highlight that the company could not access the market to get new loans as it was highly leveraged after that, mainly in 2010 and 2011, with Net Debt / EBITDA above standards.
1.029 1.062
2.485 2.604
2009 2010 2011 Sep/2012
Figure 15 –PlywoodCo.’s bank debt evolution
Elaborated by the author
Finally, taking the forth situation of delay on suppliers payments, we can see on figure 16 that the company has managed its suppliers well from 2009 to 2011, with stable liabilities. But, from 2011 to September 2012 the liabilities rose from R$ 395 thousand to R$ 650 thousand, an increase of 65%.
Moreover, during talks with the company’s controller and CFO it was presented
that the company, during the year of 2012, was delaying its payments to the suppliers, as the cash squeeze was becoming more and more heavy on the company.
Summarizing, from the five situations presented by Lopes and Assis (2006), PlywoodCo. has presented four of them. While the increase in bank debt was limited to 2010, we could see that the reason was related to difficulties in accessing the market due to high leverage and not because it was unnecessary.
Figure 16 –PlywoodCo.’s supplier liabilities
Elaborated by the author
6.082
30.232
34.470
31.135
1,9 x
6,2 x
4,9 x
2,7 x
0,0 x 1,0 x 2,0 x 3,0 x 4,0 x 5,0 x 6,0 x 7,0 x
- 5.000 10.000 15.000 20.000 25.000 30.000 35.000 40.000
2009 2010 2011 Sep/2012
Debt Net Debt / EBITDA
389 417 395
650
2009 2010 2011 Sep/2012