42nd DIRECTING COUNCIL
52nd SESSION OF THE REGIONAL COMMITTEEWashington, D.C., 25-29 September 2000
Provisional Agenda Item 4.2 CD42/6 (Eng.)
18 August 2000
ORIGINAL: ENGLISH
HEALTH SITUATION AND TRENDS IN THE AMERICAS
The objective of this document is to provide information on the health situation in the Americas to support continued development of the Pan American Health Organization (PAHO) and countries' multi-strategy programs and activities for improvement of the health of the population of the Region. It is substantiated by diverse basic data provided through PAHO's Health Core Data/Country Profile Initiative and national health analyses. The work of PAHO has been unified by the concepts of equity and Panamericanism, and these provide much of the direction and focus of its technical cooperation.
There is a pressing need for improving the empirical public health information that facilitates the periodic assessment of the health situation and trend analysis of all population groups and geographic levels and not only the national averages. The availability of geographically disaggregated national data is essential for detecting disparities and directing resources to close those gaps that may be described as inequitable.
The Organization is committed to working toward the consolidation of health information systems and communication platforms in the Member States. This strategy will help to document the impact of health interventions and reduce the health disparities that are so much a feature of the health landscape of this Region.
CONTENTS
Page
1. Introduction... 3
2. Demographic and Urbanization Trends ... 3
3. Health Status and Epidemiological Polarization... 6
1. Introduction
The overall objective of this document is to provide information on the health situation in the Americas to support continued development of the Pan American Health Organization (PAHO) and countries' multistrategy programs and activities for improvement of the health of the population of the Region.
The work of PAHO has been unified by the concepts of equity and Panamericanism, and these provide much of the direction and focus of its technical cooperation. PAHO's major thrust is to collaborate with Member States in their quest for to reduce inequities in health. The integration of health in the social and economic agenda for all population groups is a key premise for national and regional development. Reliable data on health represent an essential prerequisite for all these approaches.
This document presents a summary of the health situation and trends in the Americas and is substantiated by diverse basic data provided through PAHO's Health Core Data/Country Profile Initiative and national health analyses. The document is organized in three sections: (a) demographic and urbanization trends; (b) health status and epidemiological polarization; and (c) PAHO's response for strengthening national core health information and situational analysis initiatives.
2. Demographic and Urbanization Trends
During the latter part of the twentieth century, an important demographic transition occurred in the Region of the Americas. The decline of mortality rates during the last 30 years has led demographers to use the term "demographic transition." In 1950, the population of the Americas was 331 million. In 1999, the population of the Americas was estimated at 823 million, representing nearly 14% of the world's population. About one-third of that population resides in the United States, while another third can be found in two other countries: Mexico and Brazil. The remaining third is scattered among the 45 countries and territories in the Region.
The average life expectancy at birth in Latin America in the period 1995-1999 stood at 70 years, the target set for the end of the century in the Strategy for Health For All by the Year 2000. Figure 1 presents the trend changes of the life expectancy in the Region between 1960 and 2000. There is, however, great diversity among countries and within each country. In the Region, the range is from 54.1 to 79.2 years. There is a difference of more than 25 years between the countries at the Region's two extremes. In many countries, the internal subnational rates have higher gaps, reflecting substantial differences in the relative and absolute risk of dying prematurely.
Between 1950-1955 and 1995-2000, the gap between male and female life expectancy grew from 3.3 to 5.7 years in Latin America, from 2.7 to 5.2 years in the Caribbean, and from 5.7 to 6.6 years in North America. This change in the population's demographic profile has resulted in the aging of the general population, with a concomitant
1960 1970
1980 1990
2000
Trends in the Life Expectancy in the Region of the Americas
Life Expectancy
years
and more
increase in chronic and degenerative diseases and disabilities, which affect females more frequently.
The level of population growth combined with the varied mortality and fertility rates characterizes the demographic transition in the Americas. Four typologies have been used to identify the level of this transition in the corresponding countries:
- Group 1. Incipient transition (high birth rate, high mortality, moderate natural growth (2.5%)): Bolivia and Haiti.
- Group 2. Moderate transition (high birth rate, moderate mortality, high natural growth (3.0%)): El Salvador, Guatemala, Honduras, Nicaragua, and Paraguay.
- Group 3. Full transition (moderate birth rate, moderate or low mortality, moderate natural growth (2.0%)): Brazil, Colombia, Costa Rica, Dominican Republic, Ecuador, Guyana, Mexico, Panama, Peru, Suriname, Trinidad and Tobago, and Venezuela.
- Group 4. Advanced transition (moderate or low birth rate and mortality, low natural growth (1.0%)): Argentina, Bahamas, Barbados, Canada, Chile, Cuba, Jamaica, Martinique, Puerto Rico, United States, and Uruguay.
It has become clear that averages do not tell the whole story; measures of distribution of mortality and morbidity indicators are therefore becoming more common. The following is an example of work in this direction that involves the use of Gini Coefficients1.
Figures 2a and 2b present the Gini Coefficients for two countries with different levels of demographic transition (moderate and advanced transition). The degree of inequality in infant mortality, as measured by the corresponding Gini Coefficient, is more than two times higher in a country that is currently in a moderate demographic transition than one in a full demographic transition. It is important to note marked differences in the magnitude of health inequalities between Latin American populations that share the same stage of demographic transition. Figures 3a and 3b show the level of inequalities in infant mortality adjusted for
socioeconomic differences, measured by the Concentration Index2,
1
The Gini Coefficient is based on the Lorenz curve, a graphic representation of a variable with its uniform distribution (i.e., situation of equality) in the population. A diagonal line represents this uniform distribution. The more distance between the Lorenz curve and the diagonal line, the greater the inequality. The possible values of the Gini Coefficient range from zero to one. The indicator would be equal to zero in conditions of perfect equality.
2
using two countries with same level (full) demographic transition. The magnitude of the inequalities in infant mortality is almost three times higher in one country than that of the other, suggesting that despite the similarities in demographic transition, there might be important differences related to their respective socioeconomic processes and epidemiological polarization.
The regional average urban population for the year 2000 is estimated at 76.0%. However, the average for the Southern Cone is 85.3% and for Central America, 48.3%. Figures 4 and 5 illustrate the distribution of the Region's urban population by geographic sub-national units, ranging from 11% to 99%. The growth of urbanization in the Americas has had important health implications in the sense that it has increased the absolute risks of significant social problems, such as violence and accidents.
3. Health Status and Epidemiological Polarization
Most of the health situation analyses of the countries of the Americas have highlighted the remarkable progress made during the twentieth century in postponement of death and the increasing span of healthy life for some population groups. On the other hand, these analyses also have underscored the large disparities that still exist between the national average expected lifespan vis-à-vis that of the disadvantaged groups. Although major advances have been made in controlling infectious and parasitic diseases, these remain important causes of death with rates similar to those for noncommunicable diseases.
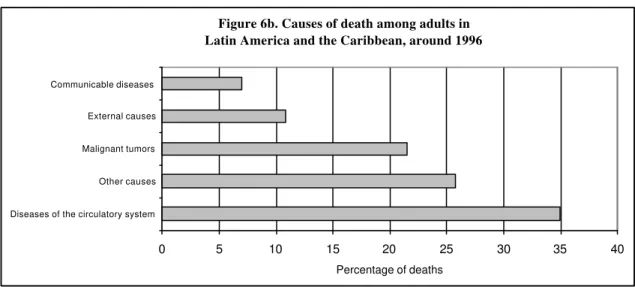
Toward the end of the twentieth century, mortality rates have declined in virtually every country of the Americas. The average life span has increased in Latin America by 18 years in four decades. However, a unique pattern of mortality has emerged in the Region that reflects an epidemiological polarization. This epidemiological polarization is characterized by a prolonged coexistence of two mortality patterns, one typical of the developed societies (chronic and degenerative) and the other of poor societal living conditions (infectious and parasitic) combined with high mortality from accidents and violence. The relative contribution of chronic diseases to the mortality pattern is as important as that of communicable diseases. This polarization is reflected in the structure of causes of death presented in Figures 6a-b and 7. This profile indicates the persistence of large health gaps between different social groups and areas within countries. Not all population subgroups have achieved full access to health and adequate living conditions that are needed to sustain marked shifts in the causes of death.
Increasing gaps in income and social inequalities still raise concerns because of their effect on the widening of mortality differentials in the Region.
Using national averages, between 1980 and 1999, a decrease was observed in the number of years of potential life lost (YPLL) throughout the Region. While part of this change can be attributed to the aging of the population, the principal cause was the decline in mortality in the first years of life. However, the intensity and speed of this decline was not the same in all the countries or even within different areas of the same country.
Inequities in the risk of becoming ill and dying prematurely correlate with inequities in the distribution of resources. For example, the infant mortality rates vary from country to country and within a given country. This phenomenon is clearly illustrated in Figure 8, which shows a range from 3.7 to 133 per 1,000 live births at the subnational level. In several countries with a relatively high income level, this indicator ranges from 13.4 to 109.8 per 1,000 live births at the subnational level. The inclusion of a subnational disaggregation of information becomes, then, very important and quite relevant, since as indicated previously, national averages of health indicators do not reflect the heterogeneity that exists in the frequency distribution of health indicators within a given country. The observed regional and national inequalities in health are replicated with greater intensity at the subnational and local levels.
Noncommunicable diseases accounted for 49.7% of the mortality of the adult population in the Americas while external causes accounted for 13.8% of deaths. In the period 1990-1995, 89% of homicide victims were males as reported in a substantial number of countries. This represented a 65% increase over the 1980-1985 level for males; for females, the increase was 30%. In all the subregions, nearly three times as many males as females died from motor vehicle accidents between 1980 and 1996.
Information from different population groups and not only national averages should be used to formulate health policies. In addition, sustained impetus is needed for local disaggregation of information for health analysis. There is pressing need to improve empirical public health information that facilitates the periodic assessment of the health situation and trend analysis of all population groups and geographic levels, and not only with the national averages.
4. PAHO's response
involvement in this area in the Member States. In 1995 PAHO launched its Regional Core Data/Country Profile Initiative which sought to use modern technology to systematize the collection, analysis and dissemination of essential health data. The availability of geographically disaggregated national data is essential for detecting disparities and directing resources to close those gaps that may be described as inequitable.
PAHO is pleased to note the progress made in the Americas in this regard. Eighteen ministries of health have established systems for collecting, analyzing, and publishing core data in a fairly uniform format. This is a noteworthy achievement.
The Organization now faces the challenge to continue to improve the comparability, validity, and reliability of health information to identify and quantify the inequalities that disproportionately affect certain segments of societies, while recognizing to the important factors that determine health inequalities. PAHO is collaborating with national health authorities, academic institutions, and civil society groups to continue refining the methodological and operational instruments for subnational and local health assessments, as well as for the selection of appropriate and useful indicators and indices. Emphasis is being placed on useful, practical basic instruments and indices that can be applied and generated at the national level.
Inequalities in infant mortality: Lorenz Curve and Gini Coefficient. Cumulative distribution of deaths under age 1 among cumulative population of live births ranked by magnitude of infant mortality rate. Moderate (Phase II) Demographic Transition selected country, 1998.
Gini coefficient = 0.216
Inequalities in infant mortality: Lorenz Curve and Gini Coefficient. Cumulative distribution of deaths under age 1 among cumulative population of live births ranked by magnitude of infant mortality rate. Full (Phase IV) Demographic Transition selected country, 1997.
Gini coefficient = 0.090
0.0 0.1 0.2 0.3 0.4 0.5 0.6 0.7 0.8 0.9 1.0
0.0 0.1 0.2 0.3 0.4 0.5 0.6 0.7 0.8 0.9 1.0 live births population (% cumulative)
deaths under age 1 (% cummulative)
perfect equality observed distribution best fit
0.0 0.1 0.2 0.3 0.4 0.5 0.6 0.7 0.8 0.9 1.0
0.0 0.1 0.2 0.3 0.4 0.5 0.6 0.7 0.8 0.9 1.0 live births population (% cumulative)
deaths under age 1 (% cummulative)
perfect equality observed distribution best fit
CD42/6 (Eng.)
Figure 3a:
Socioeconomic inequalities in infant mortality: Concentration Curve and Index. Cumulative distribution of deaths under age 1 among cumulative population of live births ranked by socioeconomic status (SES), according to the proportion of households living under the national poverty line. Advanced (Phase III) Demographic Transition selected country, 1997.
Concentration index = – 0.228
Figure 3b:
Socioeconomic Inequalities in infant mortality: Concentration Curve and Index. Cumulative distribution of deaths under age 1 among cumulative population of live births ranked by socioeconomic status (SES), according to the magnitude of the national Index of Social Development. Advanced (Phase III) Demographic Transition selected country, 1999.
Concentration index = – 0.088
0.0 0.1 0.2 0.3 0.4 0.5 0.6 0.7 0.8 0.9 1.0
0.0 0.1 0.2 0.3 0.4 0.5 0.6 0.7 0.8 0.9 1.0 SES-ranked live births population (% cumulative)
deaths under age 1 (% cumulative)
perfect equality observed distribution best fit
0.0 0.1 0.2 0.3 0.4 0.5 0.6 0.7 0.8 0.9 1.0
0.0 0.1 0.2 0.3 0.4 0.5 0.6 0.7 0.8 0.9 1.0 SES-ranked live births population (% cumulative)
deaths under age 1 (% cumulative)
Figure 4:
Figure 5:
Geographic subnational units (n=250)
0.00 25.00 50.00 75.00 100.00
Percentage
Urban population in the Americas, 1995-2000.
Distribution by subnational units, in 12 countries.
Urban population in the Americas, 1995-2000.
Country distributions by subnational units.
GUT COR
ECU NIC
BOL MEX
COL PER
BRA ARG
VEN URU
Country
25.00 50.00 75.00 100.00
Percentage A
A A A A
Source: Special Program for Health Analysis, Mortality Technical Information System.
Source: Special Program for Health Analysis, Mortality Technical Information System.
Figure 6a. Causes of death in children < 1 yr. of age in Latin America and the Caribbean, around 1996
0 5 10 15 20 25 30 35 40 45 50
Diseases originating in the perinatal period
Other causes Acute respiratory infections Acute diarrheal diseases External causes
Percentage of deaths
Figure 6b. Causes of death among adults in Latin America and the Caribbean, around 1996
0 5 10 15 20 25 30 35 40
Diseases of the circulatory system Other causes Malignant tumors External causes Communicable diseases
Figure 7:
Potential Years of Life lost by broad cause group, By area for latest year available around 1995
3,217,91
9,820,63
27,782,03
15,981,64
25,968,11
Communicable Diseases & Maternal & PerinatalConditions
Non Communicable Diseases
External Causes of injury andpoisoning
United States and Canada
8%
68% 24%
30% 22%
48%
Latin America and Spanish Carribean Both sexes
English Speaking Caribbean Both sexes
11,571,00
Subnational geographic units 10.0
0 20.0 0 30.0 0 40.0 0 50.0 0 60.0 0 70.0 0 80.0 0 90.0 0 100.0 0 110.0 0 120.0 0 130.0 0 140.0 0
Rate (deaths/1,000 live births)
Infant mortality rates in 18 countries of the Américas, 1995-1998. Distribution pattern from 363 subnational geographic units. Figure 8: