QUALITY OF LIFE ASSESSMENT BASED ON SPATIAL AND
TEMPORAL ANALYSIS OF THE VEGETATION AREA DERIVED
FROM SATELLITE IMAGES
MARIA IOANA VLAD
1, DRAGO
Ş
BR
Ă
T
ĂŞ
ANU
2ABSTRACT - The quality of life in urban areas is a function of many parameters among which, one
highly important is the number and quality of green areas for people and wildlife to thrive. The quality of life is also a political concept often used to describe citizen satisfaction within different residential locations. Only in the last decades green areas have suffered a progressive decrease in quality, pointing out the ecological urban risk with a negative impact on the standard of living and population health status. This paper presents the evolution of green areas in the cities of South-Eastern Romania within the last 20 years and sets forth the current state of quality of life from the perspective of vegetation reference. By using state-of-the-art processing tools applied on high-resolution satellite images, we have derived knowledge about the spatial and temporal expansion of urbanized regions. Our semi-automatic technologies for analysis of remote sensing data such as Landsat 7 ETM+, correlated with statistical information inferred from urban charts, demonstrate a negative trend in the distribution of green areas within the analyzed cities, with long-term implications on multiple areas in our lives.
Keywords: environment, green area, city, satellite image, statistical data
INTRODUCTION
Cities are opened and dynamic systems, which use, transform and deliver matter and energy; they grow up and adapt and also interact with other ecosystems. These are artificial systems, being dominated by a single species: human beings. Therewith, they can survive and ensure a good quality of life, by using basic services delivered by biodiversity. Such services, which are created within and outside the urban area, include water and climate cycle, air, water and ground purification, bringing provision and other goods.
The insurance of a good quality of life has become a real challenge, especially in cities, in the context of the intense development these areas have undergone in the last decades. By offering much more opportunities, cities have increased in size by attracting the rural population, becoming centres that concentrate infrastructure, recreation, culture and markets. Therefore, “it is essential to ensure good quality of life in urban areas, providing infrastructure, services and a healthy environment, with good liveability, interaction, learning and experimentation” as “quality of life makes the city more attractive and desirable to live and invest” (Quintas and Curado, 2009).
Quality of life has become a necessity and a priority in spatial planning and in urban planning policies and the city should respond to the challenges that raise the concern of society. The determination of the quality of life and human well-being has a long history. Initially, only the economic indicators were considered, having the social indicators being referred since the Great Depression and the social indicators since the first Day of the Land in 1970.
Today, the European Union considers the improvement in quality of life as one of the main objectives in its strategies of sustainable development.
1PhD student, University of Bucharest, Faculty of Geography, no.1, Nicolae Bălcescu Blvd., Bucharest, Romania. E-mail: [email protected]
Considered a controversial concept, with a great diversity of interpretations and different concepts, quality of life has various definitions. According to Liu (1976, cited by Quintas and Curado, 2009) “there are as many quality of life definitions as there are people”. Therefore, it results that the definition of quality of life which everyone should consider depends on the area in analysis and the objectives proposed.
Urban green areas (of public, semi-public or private character), due to their structure and multi-functionality (environmental, ecological, social, economic, cultural and aesthetic) have an important contribution to the quality of life as, despite the growing distance from the natural element, the city needs nature for its survival (Bolund and Hunhammar, 1999, cited by Quintas and Curado, 2009). “The bigger are the cities, the more the urban citizen is deprived of contact with the environment, the more he despises or simply ignores the other elements of the Ecosystem. He becomes more and more hostile and the men look for refuge, during more time, inside artificial environments” (Monteiro, 2001, cited by Quintas and Curado, 2009).
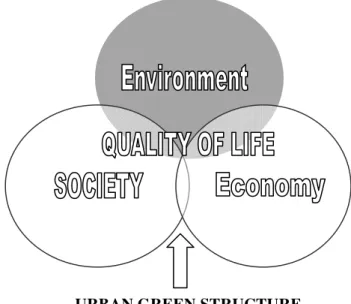
They represent essential elements for the urban balance, fulfilling several functions, at several levels, which can be summarized in three dimensions that constitute the pillars of sustainability: environment, society and economy (Figure 1).
URBAN GREEN STRUCTURE
Figure 1.Influence of the Urban Green Structure in the three pillars of the quality of life and sustainability
Source: according to Quintas and Curado, 2009
According to Quintas and Curado (2009), green areas fulfil a series of functions depending on the three levels. At environmental and ecological level they support the improvement of air, soil and water, the decrease of the noise level, the reduction of the thermal amplitude variations, the protection against the winds, the diminution of the processes of erosion, the waste management, the improvement of the infiltration and drainage of storm water, the reduction of flood risks, as well as the promotion of biodiversity. At social level, they represent spaces with great potential for recreation and leisure, increasing the physical and psychological well-being of the urbanities; they are also spaces of activity, health, apprenticeship, sociability and consciousness. As regards the economic functions, they come out both directly (through financial benefits with production and sales) or indirectly (money saved with infrastructures and other services that cities would not have the need to create).
fulfill and the services that they accomplish in the city, green areas can be considered par excellence, quality of life and sustainability promoters.
An important benefit brought by vegetation is the noise pollution attenuation. Green spaces represent barriers against noises, contributing to reducing their level during vegetation period. According to the already conducted researches, noise, which in urban area reaches intensities between 40 and 80 decibels, can be pulled half down if there is a belt of hanging trees of 200 and 250 m wide.
Green areas have a significant role in promoting urban population health. They offer opportunities to sustain an active lifestyle by walking, running, cycling. The main value of green areas comes from their capacity to restore the persons’ wellbeing as they offer quiet places for relaxing and reducing stress.
Because green spaces have an important contribution to the quality of living, residents should pay special attention to the residential green areas.
POLITICS FOR GREEN AREA MANAGEMENT
In Romania, Law no. 27/2007 on the settlements and the green space management in urban areas specifies the following: “green areas are the places within towns and cities, defined as semi- natural ecosystems which are determined by vegetation”. According to this law, the management of green areas is settled as public objective in order to assure the environment quality parameters and also the people health status.
Within the 319 urban settlements, concentrating 55.2% of the population, a decrease in green areas has been registered in the last decades as a consequence of the permanent spread of the built-up areas. As for these, the average green space area in Romania is 18 square meters per person, whereas in Europe is 25 square meters per person. As the World Health Organization rate is 50 square meter of green area per person and the EU standards are of 26 square meters per person, Romania does not comply with the minimum green area requirement.
Because of the decrease in urban green areas in our country, according to Government Emergency Ordinance no. 114/2007 for environment and safety local public authorities must provide a green surface of minimum 20 square meters per person until the 31st of December 2010 and 26 square meters per person until the 31st of December 2013.
Taking into account the legislative forecasts of Government Emergency Ordinance no. 114/2007 for achieving the standards for urban green area surfaces according to EU rates, the environment protection county agencies come into line with a couple of objectives, both for maintaining and enhancing the green areas and for creating new ones.
All the benefits brought by the green area system by means of the three functions (ecological, social and economic) are also specified in the Council of Europe Recommendation No. R (86) 11 of the Committee of Ministers to Member States on Urban Open Space: “open space is an essential part of the urban heritage, a strong element in the architectural and aesthetic form of a town, plays an important educational role, is ecologically significant, is important for social interaction and in fostering community development and is supportive of economic objectives and activities”, “it has an important role in providing the recreational and leisure needs of a community and has, finally, an economic value in that environmental enhancement, in which the improvement of open space plays a major part, assists the economic revival of cities, not just through creating jobs but in increasing the attractiveness of a town as a place for business investment and sought-after residential areas” (Recommendation on Urban Open Space 86/11, 1986).
At European level, the URGE project (Development of Urban Green Spaces to Improve the Quality of life in Cities and Urban Regions), developed from 2001 to 2004, considers urban green
EUROPEAN “GREEN AREA” PROJECTS
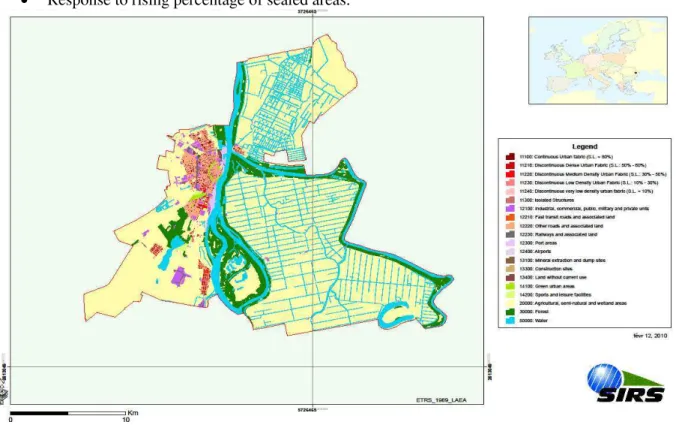
1. Urban Atlas
Developed as part of GMES, the Urban Atlas fulfils this need by providing pan-European, reliable and inter-comparable urban planning data with high-resolution maps. The Urban Atlas brings together thousands of images from European satellites and provides detailed mapping of larger urban zones, yielding accurate land cover and usage data.
The Urban Atlas – a land use change monitoring product – offers a sound basis for spatial statistic calculations and the revision of urban plans. Urban planners, politicians, environmentalists and other public stakeholders can make use of this in the planning and management of cities.
Concrete examples are:
• Monitor the status of a Master Plan development indicating the distance to services, sizes of green areas;
• Indications of where to stop building activities due to increasing sealing levels; • Response to rising percentage of sealed areas.
Figure 2. URBAN ATLAS – RO005L Brăila
2. URGE project – Development of Urban Green Spaces
The project includes the elaboration and testing of an interdisciplinary catalogue of methods and measures, based on experience from various European cities. This catalogue comprises criteria which enable to evaluate ecological, sociological, economic and planning aspects.
STUDY AREA
The study area is located in the south-eastern Romania, covering 35,762 sq km or 15% of the total surface of the country; the region is the second by size among the 8 development regions of Romania. The counties included in this region are Brăila, Buzău, Constanţa, Galaţi, Tulcea and Vrancea. The administrative city for the South-East Development Region is Brăila.
The cities of the region include 55.5% of the residents with decreasing trends, Constanţa being the largest city in the region, followed by Galaţi and Brăila. These cities were selected for the purpose of this study which is to estimate the vegetation index based on spatial-temporal and statistical analysis (Figure 3).
DATA USED
For this study, a temporal series of 3 Landsat TM scenes for each city were used, with the first image acquired on the 9th of June 1990, the second on the 17th of June 2000 and the last one on the 23rd of June 2010. All selected Landsat scenes have less than 10% cloud coverage.
Figure 3.The representation of the administrative boundaries of the studied areas
The Landsat TM scenes were manually co-registered (the images for each city was aligned so that equivalent geographic coordinates coincide).
Table 1.Statistical indicators on Brăila, Galaţi and Constanţa cities during 1990, 2000 and 2008
Brăila
Year 1990 2000 2008
Green area(ha) 294 274 278
Total area(ha) 3329 3329 4392
Total population 236194 230962 212981
Galaţi
Year 1990 2000 2008
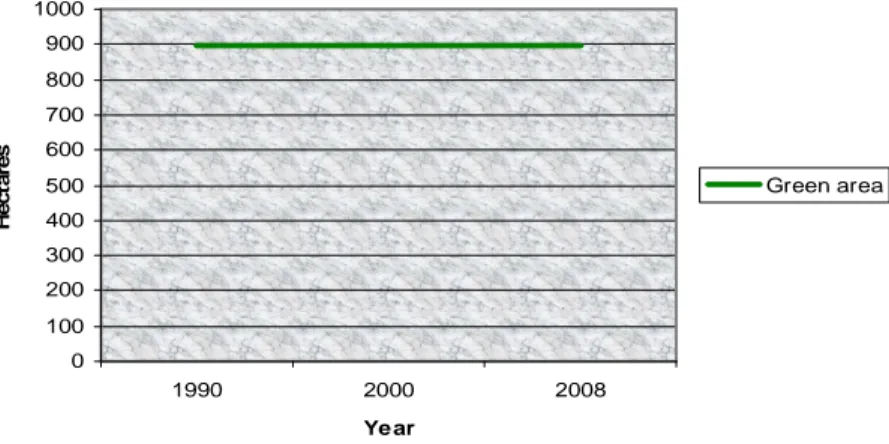
Green area (ha) 896 896 896
Total area(ha) 24642 24642 24602
Total population 326139 326956 291608
Constanţa
Year 1990 2000 2008
Green area(ha) 548 549 301
Total area(ha) 12561 12489 12489
Total population 355402 337216 302242
Source: INS-BDL, 1990, 2000, 2008
METHOD
In order to analyze the vegetation area, the Normalized Difference Vegetation Index (NDVI) was used. NDVI was developed by Rouse et al. in 1974 and currently it is one of the most common used band indices for the detection of vegetated areas. It has also the advantage of being less sensitive to atmospheric and radiometric errors.
For Landsat TM scenes, NDVI is given by the following formula: NDVI = (NIR – RED) / (NIR + RED )
or, for Landsat TM data
NDVI = (TMband4 - TMband3) / (TMband4 + TMband3),
where RED and NIR stand for the spectral reflectance measurements acquired in the red and near-infrared regions, respectively. These spectral reflectances are themselves ratios of the reflected over the incoming radiation in each spectral band individually; hence they take on values between 0.0 and 1.0. NDVI was one of the most successful of many attempts to simply and quickly identify vegetated areas and their “condition” and it remains the most well-known and used index to detect live green plant canopies in multispectral remote sensing data. Once the feasibility to detect vegetation had been demonstrated, users tended to also use the NDVI to quantify the photosynthetic capacity of plant canopies. This, however, can be a rather more complex undertaking if not done properly.
CONCEPTUAL SCHEMA FOR NDVI IMAGE DATA PROCESSING
The Landsat ETM image is calculated in Envi programme, hereby resulting a Landsat ETM vegetation index which is cut off by means of the administrative border, so that the NDVI index of the selected area is obtained. The white flows are identified with vegetation areas, while the black – grey colours stand for other urban land use classes (Figures 5, 6 and 7).
260 265 270 275 280 285 290 295 300
1990 2000 2008
Ye ar
H
e
c
ta
re
s
Green area
Figure 5.Vegetation index assessment over urban areas of Brăila (1990 – 2008)
0 100 200 300 400 500 600 700 800 900 1000
1990 2000 2008
Year
H
e
c
ta
re
s
Green area
Figure 6.Vegetation index assessment over urban areas of Galaţi (1990 – 2008)
0 100 200 300 400 500 600
1990 2000 2008
Year
H
e
c
ta
re
s
Green area
CONCLUSIONS
The present paper is focused on a theoretical method for quality of life assessment based on spatial-temporal analysis of the vegetation area derived from Landsat ETM+ satellite images correlated with statistical data. At the level of the analyzed cities, there are no significant differences in the evolution of green areas during the selected period of time. Excepting the city of Galaţi, where there is no change at the level of distribution of green area from 1990 to 2008 (Figure 6), in the case of the other two cities we can see a decrease starting with 2000(Figure 5 and 7).
The average for the green area in Brăila is 12 square metres per person, in Galaţi 28 square metres per person and in Constanţa 14 square metres per person; thus, according to the European Union standards regarding the disposition of green area in a city, none of the areas under analysis can reach the value of 26 square metres per person (Explanatory Note to Government Emergency Ordinance no.108/10.10.2007).
The efficiency in applying the method of satellite images in order to analyse the distribution of green area is facilitated by the open source Landsat images archive. The US Geological Survey (USGS) offers, at no cost, selected Landsat 4, 5 and 7 satellite data. Orthorectified Landsat data are available for free download from the Global Visualization Viewer (GloVis) at http://glovis.usgs.gov.
ACKNOWLEDGEMENT
Invest in human resources! This work was supported by project: POSDRU/88/1.5/S/61150 "Doctoral Studies in the field of life and earth sciences", project co-financed through Sectoral Operational Program for the Development of Human Resources 2007-2013 from European Social Fund.
REFERENCES
CHIRIAC, D., HUMA, C., STANCIU, M. (2009), Spaţiile verzi – o problemă a urbanizării actuale
[Green Spaces – A Problem of Current Urbanisation], in: Calitatea Vieţii, XX, nr. 3 – 4, pp. 249 – 270.
COSTĂCHIOIU T., DATCU, M. (2010), Land cover dynamics classification using multi-temporal spectral indices from satellite image time series, the 8th International Conference on
Communications, Bucharest, 10-12 June 2010, pp.157-160.
DAVID, S., ESTES, J. (editors) (1983), Manual of Remote Sensing, second edition, American Society
of Photogrammetry, Falls Church, Virginia.
QUINTAS, A., CURADO, MARIA JOSÉ (2009), The contribution of urban green areas to the quality of life,http://www.cityfutures2009.com/PDF/57_Quintas_Andreia.pdf.
VAN LEEUWEN, E., VREEKER, R., RODENBURG, C. (2003), A Framework for Quality of Life Assessment of Urban Green Areas in Europe, the 43rd ERSA Congress, Jyvaskyla, Finland,
August 27-30, 2003.
*** (1986), Recommendation 86/11 of the Committee of the Ministers to Member States on Urban Open Space, Council of Europe, Committee of Ministers.
*** (1990), Green Paper on the Urban Environment, Commission of the European Communities,
Brussels.
*** (2004), Development of Urban Green Spaces to Improve the Quality of Life in Cities and Urban Regions – EU URGE Research Project, funded under Key-Action 4 “The City of Tomorrow
and Cultural Heritage” of the Programme “Energy, Environment and Sustainable Development” of the 5th Framework Programme of the European Union.
*** (2007), Explanatory Note to Government Emergency Ordinance no.108/10.10.2007, Official
*** (2007), Government Emergency Ordinance no. 114/2007 for amending and supplementing the
Government Emergency Ordinance no. 195/2005 on environment protection, Official Gazette of Romania, no. 713/22.10.2007.
*** (2007), Law no. 27/2007 on the approval of the Government Emergency Ordinance no.61/2006
for amending and supplementing the Government Emergency Ordinance no. 78/2000 on waste regime, Official Gazette of Romania, no. 38/18.01.2007.
*** (2008), A Regional Innovation Strategy for the South-East Region of Romania (2008-2015) – EU