THE RIGHT CHOICE FOR PRODUCTION PATTERNS
TO MINIMIZE COST OF INCREMENTAL
Erick Wijaya
1; Sevenpri Candra
2; Haryadi Sarjono
31,2,3
Management Department, Faculty of Economics and Business, Bina Nusantara University Jln. KH Syahdan No 9, Kemanggisan, Palmerah, Jakarta 11580
ABSTRACT
PT Damai Sejahtera Utamais a manufacturing company engaged in timber production. The company is processing wood sticks (logs) into plywood. The purpose of this research is to find the most efficient production patterns with the pattern approach 3 (three) of production, namely: Wavy production patterns, production patterns Constant, and Moderate production patterns. With this method is expected to determine the most appropriate production pattern with the condition of the company, so as to minimize Incremental costs that will occur. The results of this study indicate that by using corrugated production patterns can cause incremental cost of 3,330,267,500 IDR. For Constant production patterns can lead to costs amounting to 3,696,317,500 IDR whereas if the company uses pattern Moderate production costs to be incurred amounted to 3,289,417,500 IDR. From the results of this study showed that moderate production patterns have the smallest Incremental costs compared to the wavy or constant patterns of production.
Keywords: patterns of production, incremental cost, minimum cost
ABSTRAK
PT Damai Sejahtera Utama adalah sebuah perusahaan manufaktur yang menjalani produksi kayu. Perusahaan ini memproses kayu batang menjadi kayu lapis. Tujuan penelitian ini yaitu untuk mencari pola produksi paling efisien dengan pola pendekatan 3 (tiga) produksi, seperti pola produksi gelombang (wavy), pola produksi konstan, dan pola produksi moderat. Dengan metode ini diharapkan bisa menentukan pola produksi yang paling cocok dengan kondisi perusahaan, juga untuk meminimalkan biaya inkremental yang ada. Hasil penelitian ini mengindikasikan bahwa dengan menggunakan pola produksi yang mengeriput bisa menyebabkan biaya inkremental sebesar 3,330,267,500 rupiah. Pola produksi konstan bisa mencapai biaya sampai 3,696,317,500 rupiah, sementara itu jika menggunakan pola produksi moderate biaya mencapai 3,289,417,500 rupiah. Hasil penelitian menunjukkan bahwa pola produksi moderat memiliki biaya inkremental terkecil jika dibandingkan dengan pola produksi gelombang dan konstan.
INTRODUCTION
Background Problem
On current situation, competition in the industrial world increase intensely with the increase of new producers that produce similar goods. In order to maintain consistency in the competitive company that happens, the producers are required to make production as efficient as possible.
Generally, the company goal is to gain profit or advantage, to achieve these objectives the management can do several ways, namely suppression of production costs and operating costs as low as possible, set prices in such a manner in accordance with the desired profit, increase sales volume as possible, in this case the company uses how the emphasis of production costs of direct materials cost suppression by maintaining the level of selling prices and sales volume of existing (Gunawan, 2005).
To achieve high efficiency, the company must conduct careful planning beforehand, in production process. Among them can be done with the selection of appropriate production pattern to be used by the company to meet the demand occurs. With the selection of appropriate production pattern is expected to optimize the incremental costs. By optimizing additional costs, will be very influential in determining the selling price of the product will get to the consumer. This caused the company's competitiveness with its competitors is increasing.
Every company wants the pattern of production is relatively always the same, which is intended to facilitate leadership in planning the need for raw materials, labor, and other facilities. The company always strives to achieve the optimal production volume, to reduce or prevent unemployment the factors of production. In fact, market demand for a product is always up and down or known by the term fluctuations. This forced the company to adjust the volume of production generated by the volume of demand / sales. In connection with the adjustment, the company must make the selection of appropriate production pattern to minimize production costs. Where production pattern that consists of 3 (three) types, namely a constant production patterns, production patterns of wavy, and moderate production patterns. Each pattern has a cost of incremental production due to limitations in the available capacity, the existing workforce. Based on what have been mentioned, any production patterns will have different incremental costs. Incremental costs are taken into account in the production pattern consists of cost savings, the cost of subcontracting, labor turnover costs (labor turn over) and overtime costs. Therefore, the pattern chosen by the company's production is a production pattern that has the lowest incremental cost (minimum).
Based on the description above, we will examine the pattern of production used by company. PT Damai Sejahtera Utama is a manufacturing company engaged in timber production. The company is processing wood sticks (logs) into 4 following products: Laminated Veneer Lumber (LVL), Raw plywood, Container Floor Plywood, Plywood Film faced. Based on the above fact, it is a problem in this research include: (1) how the production pattern is applied to the PT. Damai Sejahtera Utama today; (2) whether the pattern of production that have been conducted by company is the most appropriate production pattern in terms of minimizing incremental costs; (3) whether the company needs another alternative production patterns for the cost of incremental (incremental cost) is reduced.
Literature Review
Understanding Production and Operations Management
Handoko (2000) in his book entitled "Basics of Production and Operations Management" are management of production and operations management efforts are optimally, the use of resources-resources (or often called factors of production), labor, machinery, equipment, raw materials, and so on in the process of transformation of raw materials and labor into various products or services.
Production management and operations can also be regarded as a cycle where there is the production process. Initially there was demand from consumers who want to consume the goods / services. It was accepted as one input to the organization and reviewed by humans within the organization through his intellectual ability, and other inputs are the funds acquired from various sources such as: bank, capital, domestic investment, FDI and so forth. Another factor of the input is the raw material to create goods or services. After the transformation process in which there are the necessary facilities such as: factories, machines, and other processes such as smelting, analysis, cutting and so forth. The final result is output in the form of goods or services demanded by consumers.
Understanding Patterns of Production
According Qodri, Mustafa & Supardi (1984) understanding of patterns of production are as follows: The pattern of production including the production planning is to determine the behavior of production to produce a certain production volume in a short time.
According Ahyari (1992) understanding of patterns of production are as follows: The pattern of production is defined as the distribution of annual production into a smaller period (e.g. monthly or weekly or other time unit).
If the sale of the company concerned is the same amount from month to month, or the number of products sold by the company is always the same each month, actual problems will not arise this production pattern. This is caused by the sale of the same for every month the company will be able to use the same production level for each month. With the same level of sales, followed by the same production levels will result in the amount of inventory that are not different in each month in the company concerned. However, in reality, is very rare presence of a company that has always been the same level of sales in each month. In general, the company's product sales numbers will fluctuate from month to month. So therefore, by the fact inevitably this means the company management will be presented to an election, how the distribution of production for a year in each month to serve the interests of the company's product sales.
Factors Affecting the Pattern of Production
Factors that influence production patterns include: the pattern of sales, additional costs (incremental cost), and normal and maximum capacity of production facilities.
Sales Pattern
Incremental Cost
Definition of incremental cost by Arsyat (1999) is the cost that will arise as the existence of a decision. Definition of incremental cost by Reksohadiprodjo (1997), namely: additional costs that would occur if the area of production is broken down for short periods can result in increased-rising costs of labor turnover costs, overtime costs, save costs and subcontracting costs. According Reksohadiprodjo (1997), in relation to implementation of the pattern of production, additional costs are taken into account consists of: the labor turnover costs (labor turnover costs), cost savings (carrying cost), cost of overtime (overtime premium cost), the cost of subcontracting (subcontracting costs).
Labour turnover cost is the cost needed to find, get, attract, train and retain the workforce required for one production period. These costs will be relatively bigger in companies using corrugated production patterns than in the constant production pattern. This is because in a wavy pattern of labor demand is also corrugated so that at certain moments needs no additional cost and at any given moment there are those expenditures necessary manpower needed. In the production pattern is constant then this cost virtually nothing or very little for labor requirements is always the same.
Carrying cost are costs associated with the number of units of finished goods stored in the enterprise, where the goods are not or have not sold. At the moment in which the amount produced is greater than the volume of sales of this surplus should be kept for sale at the next meeting which is expected to rise. Overtime premium cost is the cost to be incurred by companies because of implementation of activities in the company's production is done outside normal working hours in the company. Subcontracting cost is the cost required to make a booking on other companies who can produce products of our company's production. This fee is the difference between the costs of our production to the price of it if we subcontract in other companies. This will occur if sales volume exceeds the volume of production.
Normal Capacity and Maximum Capacity
The capacity of production is closely linked to the pattern because the pattern of production illustrates how a company's ability to meet production plan in which compliance is dependent on the available capacity. The company's production capacity can be divided into two types: normal capacity and maximum capacity.
Understanding capacity by Handoko (2000) is as follows: “A level of output, a quantity output in a given period and is the highest possible quantity of output during that period” (p. 297). Understanding capacity by Buffa & Sarin (1999) is: “Limit the ability of production units to produce in a specified period, usually expressed in terms of units of output per unit of time” (p. 106). Definition of normal capacity by Supriyono (1992) is: “Normal capacity is determined by deducting the theoretical capacity constraints or stop production activities that cannot be avoided whether caused by factors both internal and external factors” (p. 314). Definition of normal capacity by Kana (2000) are as follows: “The ability of companies to manufacture and sell products in the long term” (p. 130). Definition of maximum capacity according to Kana (2000) is as follows: “The theoretical capacity (i.e. the capacity of the plant to produce at full speed without stopping for a certain period)” (p. 130).
Production Pattern Model
There are 3 models of production patterns that can be selected and applied in the company, namely: constant production patterns, production patterns wavy, and production patterns moderate.
Constant Production Patterns
Understanding the pattern of constant production by Reksohadiprodjo (1997) is the pattern of production, whereby the amount produced each day / week / month is always the same. Understanding the pattern of constant production by Ahyari (1992) is a distribution of the total production for one year to the amount of production every month, where the numbers of production from month to month are the same or relatively the same. Therefore, in this constant production pattern the large number of production from month to month are equal or relatively equal, then the production pattern of this kind is often also referred to as a stable production patterns (more concerned about the stability of production).
Wavy Production Pattern
Understanding the pattern of wavy according Reksohadiprodjo production (1997) is the pattern of production, whereby the amount produced each day, week, and month is not always the same. Understanding the pattern of wavy according Ahyari production (1992) is the production of corrugated pattern is a distribution of the total production for one year to the amount of production every month, where the number of production from month to month is always changed to follow the changes in the level of sales in the company concerned. Companies that implement this production pattern in the average production in each month will always be equal to the amount of sales of company products in the same month. The impact of what happens is the amount of inventory in the company will be the same in every month; this is because changes in the number of sales are directly followed by changes in production quantities. Because the amount of finished goods inventory that is in the companies that use wavy pattern of production is stable or relatively stable, and then the production of corrugated pattern is sometimes also referred to as the pattern of production that focuses on the stability of supplies.
Production Pattern Moderate
Moderate understanding of production patterns according to Reksohadiprodjo (1997) is the pattern is actually a moderate production of corrugated production patterns are sought only for the surge was not too sharp so that approximately constant. Understanding the pattern of moderate production by Ahyari (1992) is a distribution of total production for a year to the amount of production each month in which both the number and amount of production of finished goods inventory in the company will change to cover changes sales product is in the company.
C
A
B
time Volume Product
Figure 1 Production Type Pattern
Information:
A = The pattern of constant production
B = Corrugated production patterns
C = The pattern of moderate production
RESEARCH METHOD
Research Design
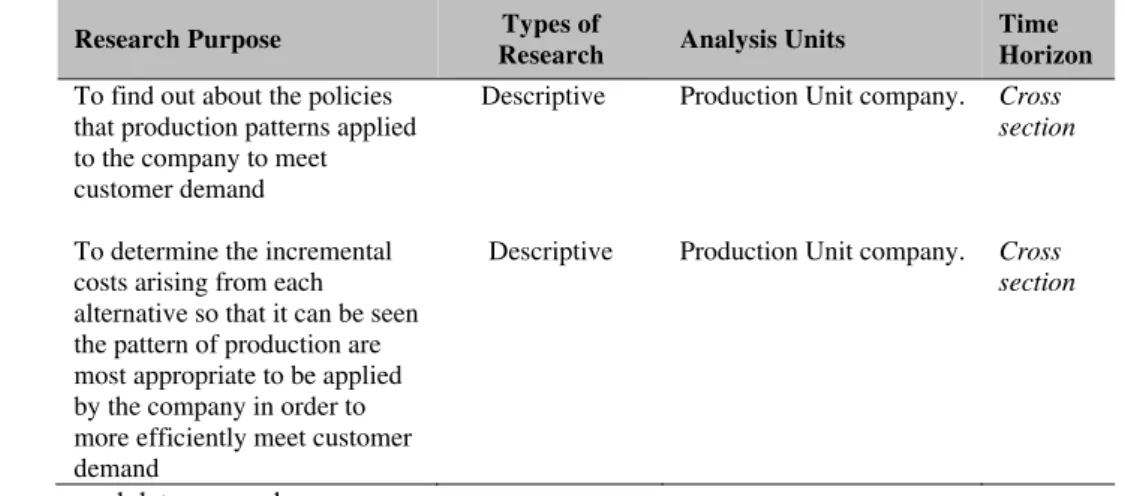
Table 1 Research Design
Research Purpose Types of
Research Analysis Units
Time Horizon To find out about the policies
that production patterns applied to the company to meet customer demand
Descriptive Production Unit company. Cross
section
To determine the incremental costs arising from each alternative so that it can be seen the pattern of production are most appropriate to be applied by the company in order to more efficiently meet customer demand
Descriptive Production Unit company. Cross
section
Operational of Research Variables
Table 2 Operational of Research
Variable Variable Concept Main Indicator
• Peramalan
(forecasting)
Forecasting is an attempt to predict future conditions through testing in the past.
Historical data company
• Production
Pattern
Determining the behavior resulting in volume production for a specific production on a short-term period.
1. fixed amount of production that are distributed each period⎝Constant production pattern
2. corrugated production patterns of volatile production following the changes in the level of sales in the company.⎝
3. moderate production pattern of a distribution amount of production for a year against a production every month where the number of production and finished goods inventory will change to cover changes in product sales company.⎝
• Incremental Cost
Additional costs that would occur if the area of production is broken down for short periods can result in increased-rising cost of labor turnover costs, overtime costs, save costs and subcontracting costs.
1. 1. Labor Turnover Costs (labor turnover costs) 2. Save cost (carrying cost)
3. Overtime costs (overtime premium cost) 4. Subcontract Costs (subcontracting cost)
Source: processed data researcher
Types and Sources of Data Research
Table 3 Types and Sources of Data Research
Research Purpose Data Types Source Data
To find out about the policies that applied to the production pattern of the company to meet customer demand.
Data on patterns of production implemented by the company.
The primary data obtained directly from the company.
To determine the incremental costs arising from each alternative so that it can be seen the pattern of production are most appropriate to be applied by the company in order to more efficiently meet customer demands.
Data about costs that will arise from a variety of alternative patterns of production.
The primary data obtained directly from the company.
Source: processed data researcher
Data Collection Techniques
Analysis Method
To clarify the explanation of the author hereby author includes ways to calculate the pattern of production that might occur in a company:
Least Square Method
To forecast sales in 2007, the company can use the Least Square method. According Supranto (2000), linear trend lines can be written as a straight line equation:
Equation: Y' = a + bX
where:
Y' = value to be predicted
a = the trend in base period
b = level of development predicted values
X = units of years counted from the base period
In this method, the amount of X must be equal to zero, so that a and b can be determined by the formula:
a =
n
Y
∑
b =
∑
∑
2
X
XY
n = data amount/year
Alternative A
Constant production patterns, while the costs incurred in the production pattern is constant: cost savings and subcontract cost. Note: For this production pattern, the cost of labor turnover and overtime costs virtually nothing or very little, because the quantities produced remain and demand of labor is always the same.
Alternative B
Production Pattern Wavy, while the costs incurred in the production pattern of this wave is: labor turnover costs, subcontract cost, and overtime cost. Note: for this production pattern, the cost savings will not be there because of the amount produced is adjusted for the sales so there is never an excess production over demand that should be saved.
Alternative C
Moderate production patterns, while the costs incurred in the production pattern is moderate: saving cost, labor turnover costs, subcontract cost, and overtime cost.
Implication Planning of Research Result
DISCUSSION
Applied Production Patterns of Company
Hours of work and production capacity prevailing in the company: (1) the number of working days in a week = 6 days; (2) the number of working days in a month = 6 x 4 = 24 days; (3) the number of working hours in a day = 8hour (07.00 - 15.00); (4) number of hours of overtime in one day = 4 hour(15.00 - 19.00); (5) normal working hours a month: 24 x 8 = 192 hour; (6) hours of
overtime a month: 24 x 4 = 96 hour; (7) normal capacity/month =5.000m3; (8) normalcapacity/quarter = 3 x 5000 m3 = 15.000 m3; (9) maximum capacity/month = 14.000 m3; (10)
maximum capacity/quarter = 3 x 14.000 m3= 42.000 m3.
In connection with the implementation of the pattern of production is done by. Company, then the Incremental costs is taken into account by the company are:
Cost Saving
Warehousing costs occur when products produced in one period are not sold and stored in a storage area. The cost saving is Rp. 50,000 per m3/quarterly. Cost savings include the cost of supervision and security warehouse Rp. 20,000 per m3/quarterly, insurance costs Rp. 20,000 per m3/quarterly and electricity costs Rp.10,000 per m3/quarterly.
Overtime Cost
Overtime costs occur when the company increased its production above normal capacity, up to maximum capacity limit. With the addition of this production, the company gives the employee additional wages due to additional hours of work, where the addition of working hours has resulted in the cost of overtime. Companies calculate overtime pay Rp. 33,750 per m3/quarterly.
Labor Turnover Cost
At Company, there is no labor turnover costs because if the firm produces below normal capacity, the company did not issue its workforce, but only reduce his working hours, whereas if there is an increase of production (still below the maximum capacity), the company will only increase the number of working hours of employees only.
Subcontract Cost
Subcontracting cost is incurred when the company's sales exceeded the maximum capacity so that companies cannot meet demand, the company will meet the demand by buying from other companies with payments that have been discussed.
Tabel 4 Sales Data Plywood Tahun 2003 – 2006(*) (in m3)
Year Quarter Total
I II III IV
2003 22.371 21.650 28.152 23.951 96.124
2004 30.255 24.113 24.451 16.902 95.721
2005 16.192 20.733 25.116 22.893 84.934
2006 21.750 26.646 32.476 38.165 119.037
(*)
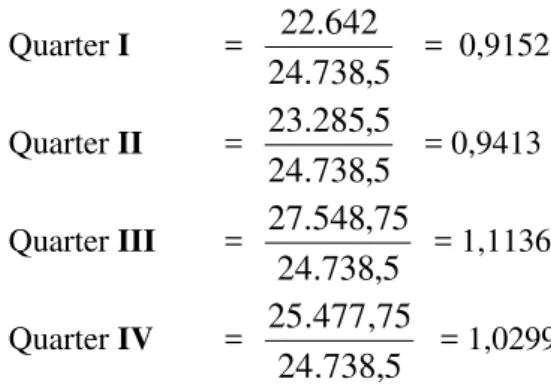
Having obtained the calculation of the average quarter, then calculated the index for each - each quarter by the average method, a simple average is by dividing average per quarter with average quarter overall.
Seasonal Index for every Quarter are:
Quarter I =
5 , 738 . 24 642 . 22
= 0,9152
Quarter II =
5 , 738 . 24 5 , 285 . 23 = 0,9413
Quarter III =
5 , 738 . 24 75 , 548 . 27 = 1,1136
Quarter IV =
5 , 738 . 24 75 , 477 . 25
= 1,0299
Next, to forecast the sales in the coming years, company using Least Square method as shown in table 5 following:
Tabel 5 Sales Forecasting with Least Square Method for the Year 2007 (in m3)
Year Y X XY X²
2003 96.124 -3 -288.372 9
2004 95.721 -1 -95.721 1
2005 84.934 1 84.934 1
2006 119.037 3 357.111 9
Total 395.816 0 57.952 20
Source: Data Processed by Author
Equation: Y' = a + bX
a =
n
Y
∑
=4
816
.
395
= 98.954
b =
∑
∑
2X
XY
=20
952
.
57
= 2.897,6
Equation Trend became:
Y' = 98.954 + 2.897,6X
Forecasting Sales on 2007: X 2007 = 5
Y'2007 = 98.954 + 2.897,6 (5)
Y'2007 = 98.954 + 14.488
Y'2007 = 113.442 m3
While the forecast sales for each quarter is calculated by sales forecast for the coming year divided by four and the result is then multiplied by the index of each - each quarter so that the results obtained are as follows:
Quarter I = 4
442 . 113
x 0,9152 = 25.956 m3 Quarter II =
4 442 . 113
x 0,9413 = 26.696 m3 Quarter III =
4 442 . 113
x 1,1136 = 31.582 m3 Quarter IV =
4 442 . 113
x 1,0299 = 29.208 m3
Total Æ 113.442 m3
Incremental Cost Analysis Based on Production Patterns Applied by Company
Company in its production activities implemented so that the production of corrugated production patterns which are produced in accordance with fluctuations in sales volume. In the fourth quarter the company produces is greater than the sales volume by 20% to be stored as inventory for next year. Fourth quarter of 2006 the company's sales amounted to 38 165 m3 a company's inventory for 2007 is 20% x 38 165 = 7633 m3.
Tabel 6 Total Production, Sales and Inventory In 2007 on the Wavy Production Pattern (in m3)
Quarter Initial Supply Production Sales Last Stock
I 7.633 25.956 25.956 7.633
II 7.633 26.696 26.696 7.633
III 7.633 31.582 31.582 7.633
IV 7.633 29.208 29.208 7.633
Total 113.442 113.442
Incremental Cost Analysis in Constant Production Patterns
Tabel 7 Total production, Sale and Inventory In 2007 on the Production Pattern CONSTANT (in m3)
Quarter Initial Supply Production Sales Last Stock
I 7.633 28.360,5 25.956 10.037,5
II 10.037,5 28.360,5 26.696 11.702
III 11.702 28.360,5 31.582 8.480,5
IV 8.480,5 28.360,5 29.208 7.633
Incremental Cost Analysis on the Production Pattern Moderate
Tabel 8 Total Production, Sales and Inventory In 2007 on the Production Pattern MODERATE (in m3)
Quarter Initial Supply Production Sales Last Stock
I 7.633 26.326 25.956 8.003
II 8.003 26.326 26.696 7.633
III 7.633 30.395 31.582 6.446
IV 6.446 30.395 29.208 7.633
Total 113.442 113.442
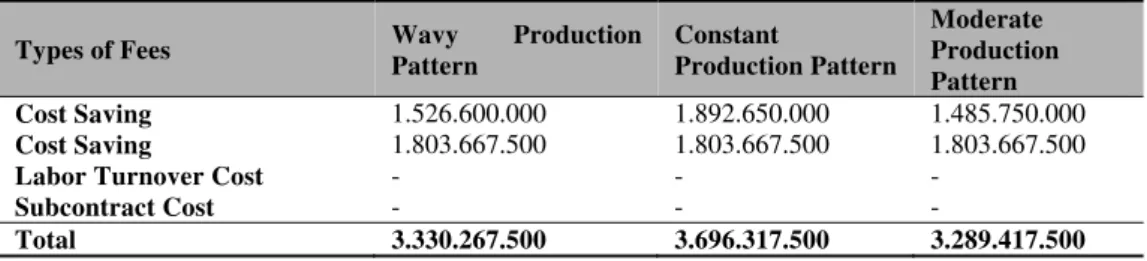
Incremental Cost Comparison Individual Production Patterns
Tabel 9. Recapitulation Incremental Cost Each - each Production (in units of Rupiah)
Types of Fees Wavy Production
Pattern
Constant
Production Pattern
Moderate Production Pattern
Cost Saving 1.526.600.000 1.892.650.000 1.485.750.000 Cost Saving 1.803.667.500 1.803.667.500 1.803.667.500
Labor Turnover Cost - - -
Subcontract Cost - - -
Total 3.330.267.500 3.696.317.500 3.289.417.500
CONCLUSION
After we made evaluation of production patterns that are used by companies, we can see in order to increase production efficiency that can optimize the additional costs, it can be concluded, among other things: (1) enterprises in conducting production apply the pattern of wavy production where production is constantly fluctuating follow the existing number of requests; (2) The costs incurred by the company at the time of using corrugated production patterns include cost savings amounting to Rp 1,526,600,000 and overtime expenses amounted to Rp 1,803,667,500. So the total cost Incremental production patterns wavy at company in the amount of Rp 3,330,267,500; (3) The costs incurred by the company if the company uses a constant production patterns include cost savings amounting to Rp 1,892,650,000 and overtime expenses amounted to Rp 1,803,667,500. So the total incremental cost of production of corrugated pattern on the company in the amount of Rp 3,696,317,500; (4) The costs incurred by the company if the company uses a moderate production patterns include cost savings amounting to Rp 1,485,750,000 and overtime expenses amounted to Rp 1,803,667,500. So, the total incremental cost of production of corrugated pattern on the company is in the amount of Rp 3,289,417,500.
REFERENCES
Ahyari, A. (1992). Manajemen produksi: perencanaan sistem produksi (6th ed.). Yogyakarta: BPFE. Arsyat, L. (1999). Ekonomi Manajerial (3rd ed.). Yogyakarta: BPFE.
Buffa, E. S., & Sarin, R. K. (1999). Manajemen Produksi dan Operasi Modern (8th ed.). Jakarta: Binarupa Aksara.
Gunawan, Y. (2005). Analisis metode material requirement planning (MRP) terhadap efisiensi biaya pada PT Agricon, Bogor. Skripsi Strata 1, STIE Kesatuan, Bogor.
Handoko, T. H. (2000). Dasar-dasar manajemen produksi dan operasi (1st ed.). Yogyakarta: BPFE. Heizer, J., & Render, B. (2006). Operations management (7th ed.). (Dwianoegrahwati & I. Almahdy,
Terj.). Jakarta: Salemba Empat.
Kana, A. A. (2000). Anggaran perusahaan: pembahasan teori disertai soal jawab. Yogyakarta: A.K. Group.
Qodri, E., Mustafa, Z., & Supardi. (1984). Alat-alat analisa perencanaan dan pengawasan produksi (1st ed.). Yogyakarta: Andi Offset.
Reksohadiprodjo, S. (1997). Manajemen produksi (1st ed.). Yogyakarta: BPFE. Supranto, J. (2000). Statistik: teori dan aplikasi (6th ed.). Jakarta: Erlangga.