363
AbstractObjective: To assess the food intake and the nutritional status of children on a cows milk and cows milk by-products free diet.
Methods: Twenty-six children receiving a cows milk and cows milk by-products free diet were assessed during their first visit to the Pediatric Gastroenterology Clinic (mean age = 19.1 months). Thirty children with no food restriction (mean age = 16.8 months) were also assessed. The usual daily food intake method was used to make the dietary assessment. The food intake was compared between the groups and in relation to the Dietary Reference Intakes (DRIs). The z-scores for weight/age, height/age and weight/height were used to evaluate the nutritional status.
Results: The cows milk free diet group presented lower energy (p = 0.005), protein (p < 0.001), lipid (p < 0.001), calcium (p < 0.001) and phosphorous (p < 0.001) intake when compared to the control group. The number of children who had energy, calcium and phosphorous intake below the DRIs was higher in the cows milk free diet group than in the control group. The z-score means for the cows milk free diet and control groups were, respectively: height/age -0.81±1.06 vs +0.42±1.25 (p < 0.001), weight/age -1.03±1.21 vs +0.02±0.91 (p < 0.001), and weight/height -0.63±1.08 vs +0.30±1.11 (p = 0.004).
Conclusions: During the cows milk and cows milk by-products exclusion therapy, qualitative and quantitative food intake monitoring must be carried out periodically, so as to prevent inadequacies in meeting nutritional requirements and impairment of growth and development.
J Pediatr (Rio J). 2004;80(5):363-70: Milk hypersensitivity, nutritional status, food intake, calcium.
Nutrient intake and nutritional status of children
following a diet free from cows milk
and cows milk by-products
Lilian C. S. Medeiros,1 Patrícia G. L. Speridião,2 Vera L. Sdepanian,3 Ulysses Fagundes-Neto,4 Mauro B. Morais5
Copyright © 2004 by Sociedade Brasileira de Pediatria
1. Specialist in Nutrition, School of Medicine, Universidade Federal de São Paulo (UNIFESP), São Paulo, SP, Brazil.
2. Ph.D.; Visiting professor, School of Medicine, Universidade Federal de São Paulo (UNIFESP), São Paulo, SP, Brazil.
3. Ph.D.; Associate professor, School of Medicine, Universidade Federal de São Paulo (UNIFESP), São Paulo, SP, Brazil.
4. Full professor, School of Medicine, Universidade Federal de São Paulo (UNIFESP), São Paulo, SP, Brazil.
5. Professor, School of Medicine, Universidade Federal de São Paulo (UNIFESP), São Paulo, SP, Brazil.
Financial support: Conselho Nacional de Desenvolvimento Científico e Tecnológico (CNPq).
Manuscript received Feb 12 2004, accepted for publication Jun 23 2004.
Suggested citation: Medeiros LCS, Speridião PGL, Sdepanian VL, Fagundes-Neto U, Morais MB. Nutrient intake and nutritional status of children following a diet free from cow’s milk and cow’s milk by-products. J Pediatr (Rio J). 2004;80:363-70.
O
RIGINALA
RTICLEIntroduction
Intolerance and allergies to cows milk predominantly occur during the first 3 years of life. Treatment is based on excluding cows milk, an important source of nutrients for children on artificial feeding, from the diet.1
Care should be taken to introduce an adequate substitute diet which meets the childs nutritional needs when employing this therapy.2 Some studies have demonstrated reduced ingestion of some nutrients,1,3 in addition to reduced stature3,4 in children on a cows-milk-free diet when compared to children on a normal diet.
an element fundamental to bone health7 increasing the risks of bone mineralization problems8 Cases of rickets,9 osteopenia and osteoporosis have been described in association with low calcium ingestion over long periods as a result of the elimination of cows milk and cows milk by-products from the diet.10
This being said, even in situations in which the elimination diet is recommended as a therapeutic test, nutrient intake and nutritional status assessment is necessary so that possible inadequacies can be detected and corrected.11
The objective of the current study was to evaluate the consumption of nutrients and the nutritional status of children on a diet free from cows milk and cows milk by-products in comparison with a group of children, from the same age group and socio-economic level, on a normal diet.
Methods
This is a cross-sectional study in which two groups were compared: one on a diet free from cows milk and cows milk by-products and the other on a normal diet, i.e. with no medical or therapeutic recommendation to exclude any given food.
A total of 26 children were evaluated, 11 female, 15 male and with a mean age of 19.1 months. All of them had been prescribed a diet free from cows milk and cows milk by-products at their first consultation at the Pediatric Gastroenterology Clinic of the Universidade Federal de São Paulo - Escola Paulista de Medicina, during the period between September 2001 and April 2002.
The control group was made up of 30 children, of whom 13 were female and 17 were male, with a mean age of 16.8 months and on normal diet, seen consecutively at the Childcare Clinic of the Jardim Santo Eduardo basic health center, in the municipality of Embu.
Elimination criteria for both groups were: fulltime attendance at a school or day-care center, maternal difficulty filling out the questionnaire on the childs nutrition, consumption of human milk and refusal to participate in the study.
Weight and stature were measured according to recommendations made by Jellife.12 The anthropometric indices employed were z scores for weight/age (W/A), stature/age (S/A) and weight/stature (W/S). In line with World Health Organization recommendations nutritional deficiency was defined as a z score below 2.0 standard deviations.13 The z scores were calculated with the aid of Epi Info version 6.0which employs the NCHS - National Center for Health Statistics data on weight and stature as its reference norms.14,15
The usual daily diet method was employed with the objective of defining the usual dietary consumption of the child.16,17 During the interview questions were asked about meal times, foods and preparations consumed in addition to the six of the portions consumed during a typical dietary day. In order to define portion sizes photographic records18
and models of utensils (cups, cutlery, plates, babies bottles) were used. Calculations were performed with the aid of the
Sistema de Apoio a Decisão em Nutrição (Nutritional Decision Support System) version 2.5 computer program.19 Nutrient intake was compared between the two groups (children on a diet free from cows milk and cows milk by-products and the controls) and also in relation to the National Research Council recommendations, as described in the Dietary References Intakes (DRIs) document.20-23
A standardized questionnaire was administered to both the group on a cows milk and cows milk by-products free diet and the control group in order to obtain the following data:
family income: number of national minimum salaries/ month;
vitamin supplement usage: brand and daily supplement dose;
duration of exclusive maternal breastfeeding defined as when the child receives only breastmilk and no other liquid or solid with the exception of vitamins, minerals and/or medicines in the form of drops or syrups, in accordance with the World Health Organization.24
For the group on a diet free from cows milk andcows milk by-products, in addition to the information already described, the following were also recorded: duration of elimination diet, any other foods excluded and the clinical manifestations that prompted the cows milk and cows milk by-products free diet to be prescribed.
Parametric and no parametric tests were used to analyze the results depending on the nature of the variables being studied. Fishers exact test and the chi-square test were used to compare observed proportions for the two independent groups, i.e. children in the experimental group and the control group. The comparison between continuous variables for the two groups, two independent samples, was performed using the Mann-Whitney tests. The Kruskal-Wallis test and Dunns multiple comparison test were applied to the analysis of four independent samples for the assessment of calcium. Calculations were performed using the program SigmaStat.25 The cut off for rejection of the null hypothesis was set at < 0.05 or 5%.
Sample size was estimated based on the expectation of insufficient calcium consumption among children on cows milk and cows milk by-products free diets. In a similar study in England, 60% of children on a diet free from cows milk and cows milk by-products were found to have calcium ingestion below 75% of the standard adopted as parameter, while among those children on normal diets this percentage was 17%.6 The sample size was therefore calculated taking the difference between groups as 43%,
α
error < 0.05 and statistical power of 80%, thus giving a minimum of 24 individuals in each group.25The experiment was approved by the Committee for Ethics in Research at the Universidade Federal de São Paulo/
Results
The clinical manifestations that prompted the free from cows milk and cows milk by-products, due to clinical suspicion of allergy or intolerance to this food were: failure to thrive (nine), diarrhea (seven), vomiting or regurgitation (six), blood in feces (six), chronic intestinal constipation (five), dermatitis (five), gastroesophageal reflux (three), bronchitis or wheezing (three). Nine of the patients, 34.6%, presented just one of the clinical manifestations listed, while 57.7% (15/26) exhibited two and 7.7% (two) three or more manifestations.
For the group on cows milk and cows milk by-products free diets, the medians (25th and 75th percentiles in parentheses) for age at start of diet and duration of diet were, 9.0 months (4.0-14.1) and 7 months (2.0-13.5) respectively. Foods excluded from diets were as follows:
cows milk and cows milk by-products (n = 14);
cows milk, cows milk by-products, and soy (n = 11);
cows milk, cows milk by-products, soy and orange or red colored foods (n = 1).
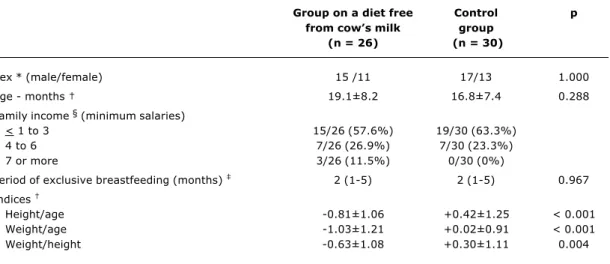
General characteristics and anthropometric indices for the two groups are shown in Table 1. Observe that, for all indices, the group on diets free from cows milk and cows milk by-products presented mean z scores lower than did the control group, with these differences being statistically significant. Taking individual z score values and a < -2.0 standard deviations cut-off point, the group on cows milk and cows milk by-products presented a greater number of children with deficiencies compared with the control group for all indices, although the difference was only statistically significant for the weight/age index (Table 2).
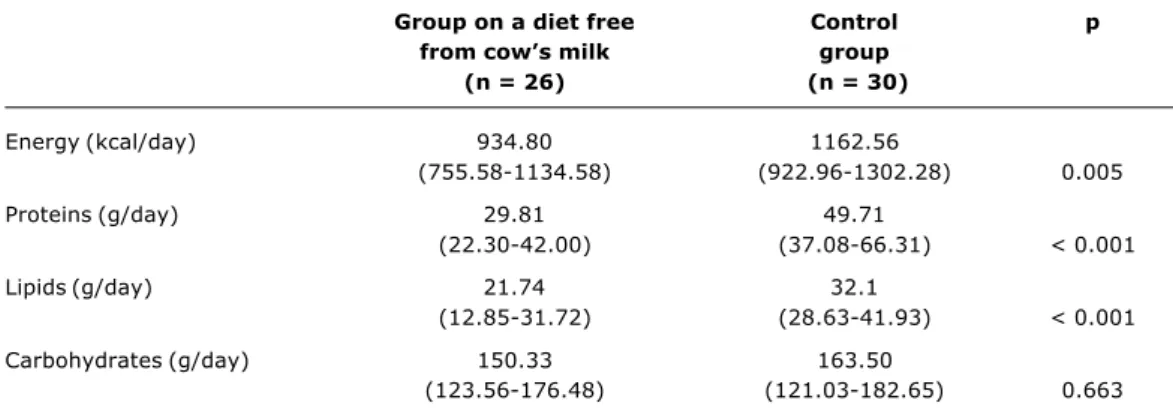
The group on diets free from cows milk and cows milk by-products presented reduced ingestion of energy, proteins and lipids compared with the control group, which differences were statistically significant (Table 3).
Of the 26 children on cows milk and cows milk by-products free diets, 10 (38.5%) were given a soy-based formula and two (7.7%) formula based on hydrolyzed proteins, while the remainder did not receive any cows milk substitute formula. With respect of nutritional supplements, it was observed that in the group on the cows milk diet, nine (34.6%) children used a calcium supplement, nine (34.6%)
Table 1 - Sex, age, family income, period of exclusive breastfeeding and z scores for height/age, weight/age and weight/height of the group on a diet free from cows milk and cows milk by-products and controls
* Fisher’s exact test.
† Student’s t test. Mean and standard deviation.
‡ Mann-Whitney’s test. Median and 25th and 75th percentil between parenthesis.
§ Not statistically analyzed. Unavailable information in a child of the study group and in four children of the control group.
Group on a diet free Control p
from cows milk group
(n = 26) (n = 30)
Sex * (male/female) 15 /11 17/13 1.000
Age - months 19.1±8.2 16.8±7.4 0.288
Family income § (minimum salaries)
< 1 to 3 15/26 (57.6%) 19/30 (63.3%)
4 to 6 7/26 (26.9%) 7/30 (23.3%)
7 or more 3/26 (11.5%) 0/30 (0%)
Period of exclusive breastfeeding (months) 2 (1-5) 2 (1-5) 0.967
Indices
Height/age -0.81±1.06 +0.42±1.25 < 0.001
Weight/age -1.03±1.21 +0.02±0.91 < 0.001
Weight/height -0.63±1.08 +0.30±1.11 0.004
Table 2 - Classification of the nutritional status according to the z scores for height/age, weight/age and weight/height of the group on a diet free from cows milk and cows milk by-products
* Fisher’s exact test.
† Diet free from cow’s milk.
Deficit
Yes No Total % deficit p
Height/age *
Group on a diet † 3 23 26 11.5
Control group 0 30 30 0 0.094
Weight/age *
Group on a diet † 6 20 26 23
Controle group 1 29 30 3.3 0.041
Weight/height *
Group on a diet † 2 24 26 7.7
iron supplement, seven (26.9%) vitamin A supplement, eight (30.7%) vitamin D and three (11.5%) vitamin C supplement. It was observed that, of the 30 children in the control group, six (20%) used iron supplement, 15 (50%) vitamin A supplement, 15 (50%) vitamin D supplement and six (20%) vitamin C supplement.
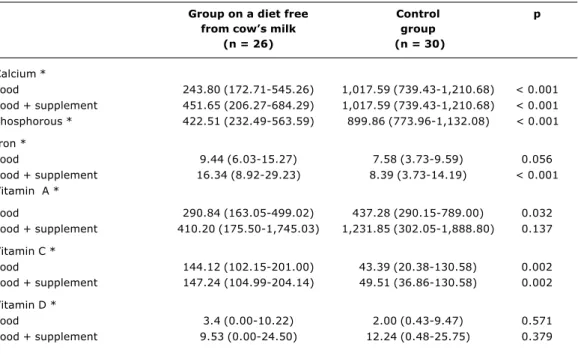
Table 4 presents the median ingestion of calcium, phosphorous, iron and vitamins A, C and D for the two groups, broken down into the contribution made by foods (including formulae) and, separately, the contribution made by foods summed to that made by vitamin and mineral supplements.
The median calcium and phosphorous intake was significantly greater in the control group. Even when the contribution made by calcium supplementation was taken into account, the calcium intake for the group on diets free from cows milk and cows milk by-products presented as diminished. Similar iron consumption was observed for the children on cows milk and cows milk by-products free diet and the controls, although when the contribution of foods was summed with that of supplements, intake was greater among the children on diets free from cows milk and cows milk by-products than among controls, due to the fact that a proportion of the patients were receiving oral iron therapy (Table 4).
The control group exhibited greater vitamin A consumption, both when dietary contribution was taken in isolation and when it was added to the supplementary contribution, although the observed difference was only statistically significant in the first case (dietary contribution). Vitamin C intake was higher in the group of
children on cows milk and cows milk by-products free diets, differing significantly from that of the control group (Table 4).
The group of children on diets free from cows milk and cows milk by-products were split into three subsets in order to verify calcium consumption: children on formula (12), children using calcium supplementation (seven) and children receiving neither formula nor calcium supplement (seven). Their median calcium intakes were (25th and 75th percentiles in parentheses) were 665.90 mg/day (506.08-837), 423.83 mg/day (215.60-657.13) and 158.82 mg/day (79.67-211.25), respectively. The same value for the control group was 1,017.59 mg/day (739.43-1,210.68). Median calcium intake was analyzed across the four groups with the Kruskal-Wallis test, which indicated statistically significant differences. It was found that children who had received calcium supplementation and those who had received neither supplementation or formula exhibited lower calcium intake than did the control group, according to Dunns multiple comparison test (p < 0.05), while the group that had received formula did not present a statistically significant difference in comparison with the control group.
Energy and nutrient intake for both groups was compared with the Dietary Reference Intakes, and it was observed that a number of children in each group failed to reach 100% of the recommended levels (Table 5). Observe, in Table 6, that the group on cows milk free diets has the greatest number of children with intakes below recommended levels for energy, calcium, phosphorous and vitamin D, indicting that formula contributes significantly to the nutrient intake of these children.
Table 3 - Median intake of energy (kcal/day), protein (g/day), lipids (g/day) and carbohydrates (g/day) in the group on a diet free from cows milk and cows milk by-products and the control group
* Mann-Whitney’s test. Median and 25th and 75th percentiles between parenthesis.
Group on a diet free Control p
from cows milk group
(n = 26) (n = 30)
Energy (kcal/day) 934.80 1162.56
(755.58-1134.58) (922.96-1302.28) 0.005
Proteins (g/day) 29.81 49.71
(22.30-42.00) (37.08-66.31) < 0.001
Lipids (g/day) 21.74 32.1
(12.85-31.72) (28.63-41.93) < 0.001
Carbohydrates (g/day) 150.33 163.50
Discussion
The results allow us to state that the nutrition of these children on diets free from cows milk and cows milk by-products presents nutrient deficiencies, in particular in terms of energy and calcium, in relation both to international recommendations and to the control group. It is important to emphasize that, as Table 1 shows, there were no differences between the groups in terms of the distribution of family income, sex, age or prior exclusive natural breastfeeding.
Our study is similar to four experiments performed in Europe, which evaluated the dietary intake of children on diets free from cows milk with an average age of around two years.1,3-5
The nutrient intake of 16 Norwegian children on cows milk and cows milk by-products free diets, was compared with that of children receiving soy or hydrolyzed protein based formulae (n = 6), children who werent receiving formula (n = 10) and controls (children on diets excluding eggs, but not milk or cows milk by-products; n = 10). When the groups were compared, the formula was observed to make an important contribution to adequate energy and macronutrient intake. Notwithstanding, calcium intake was lower among children on elimination diets than in the control group, irrespective of the use of formula, which fact is possibly the result of the lower volume of formula ingested Table 5 - Intake below the Dietary Reference Intakes for energy,
proteins, calcium, phosphorous, iron, vitamins A, C and D in the group on a diet free from cows milk and cows milk by-products and the control group
* Chi-square test.
† Fisher’s exact test.
Estimated Energy Requirement (EER): reference values for the intake of energy - Dietary Reference Intakes, 2002. Adequate Intake (AI) and Recommended Dietary Allowance (RDA): reference values for the intake of proteins, calcium, phosphorous, iron, vitamins A, C and D - Dietary Reference Intakes, 1997, 2000, 2001, 2002.
Group on Control p
a diet free group
from cows milk
(n = 26) (n = 30)
Energy * 14 5 0.008
Proteins 0 0 1.000
Calcium * 19 1 < 0.001
Calcium + supplement * 14 1 < 0.001
Phosphorous * 14 0 < 0.001
Iron * 10 16 0.399
Iron + supplement * 4 13 0.048
Vitamin A * 13 11 0.462
Vitamin A + supplement 10 7 0.349
Vitamin C 1 9 0.014
Vitamin C + supplement 1 8 0.029
Vitamin D * 15 17 0.847
Vitamin D + supplement * 10 10 0.905
Table 4 - Median intake of calcium (mg/day), phosphorous (mg/day), iron (mg/day), vitamins A (µg/day), C (mg/day) and D (µg/day) in the group on a diet free from cows milk and cows milk by-products and the control group
* Mann-Whitney’s test. Median and 25th and 75th percentiles between parenthesis.
Group on a diet free Control p
from cows milk group
(n = 26) (n = 30)
Calcium *
Food 243.80 (172.71-545.26) 1,017.59 (739.43-1,210.68) < 0.001
Food + supplement 451.65 (206.27-684.29) 1,017.59 (739.43-1,210.68) < 0.001 Phosphorous * 422.51 (232.49-563.59) 899.86 (773.96-1,132.08) < 0.001
Iron *
Food 9.44 (6.03-15.27) 7.58 (3.73-9.59) 0.056
Food + supplement 16.34 (8.92-29.23) 8.39 (3.73-14.19) < 0.001
Vitamin A *
Food 290.84 (163.05-499.02) 437.28 (290.15-789.00) 0.032
Food + supplement 410.20 (175.50-1,745.03) 1,231.85 (302.05-1,888.80) 0.137
Vitamin C *
Food 144.12 (102.15-201.00) 43.39 (20.38-130.58) 0.002
Food + supplement 147.24 (104.99-204.14) 49.51 (36.86-130.58) 0.002
Vitamin D *
Food 3.4 (0.00-10.22) 2.00 (0.43-9.47) 0.571
by children on the elimination diet when compared with the controls.1
Another study evaluated 19 Finnish children on a diet excluding multiple foods, including cows milk andcows milk by-products. Just two of the 19 children were receiving formula and the remainder used calcium supplementation. There were no differences in terms of energy, lipid or carbohydrate intake between the children on elimination diets and the controls. The children on elimination diets did, however, exhibit reduced consumption of protein, phosphorous, magnesium, zinc and calcium.3
Another study performed in Finland assessed 18 children on cows milk and cows milk by-products free d i e t s ( 1 3 r e c e i v i n g f o r m u l a a n d 1 7 c a l c i u m supplementation). No important differences were detected between the nutrient intake of this group of children in comparison with controls, but it was ascertained that formula use did not ensure adequate calcium intake, a l t h o u g h , w i t h t h e u s e o f c o n c u r r e n t c a l c i u m supplementation, the children on elimination diets intake became comparable to that of the control group.4
In England, 23 children on diets excluding multiple foods, 12 of whom received soy or hydrolyzed protein formula, did not exhibit important differences in dietary intake when compared to a control group, with the exception of calcium consumption, which was lower for the group on elimination diets.5
In our experiment, in contrast with what was observed in some of the papers cited,3-5 energy intake was considerably lower among the group on elimination diets. The patients also consumed a statistically significant quantity less of proteins and lipids. This suggests that the group had lower
food intake in general and not a deficiency of any particular macronutrient.
The use of formula as a substitute for cows milk during an elimination diet is a feature that merits attention. The formulae usually used are based on hydrolyzed proteins or soy and represent an important contribution to nutrient ingestion, particularly for infants and small children, taking into consideration the difficulties involved with this age group in substituting cows milk entirely with solid foods.4 Notwithstanding, it is important to assess formula daily intake, observing level of dilution and volume offered, since some studies have found that the volume of formula consumed daily by children on diets free from cows milk and cows milk by-products is significantly lower than the milk intake of children on normal diets,1,4 and in our country there is one further aggravating factor which is the high cost of formulae which could lead to incorrect dilution and/or the offer of insufficient quantities.
Another important factor is the use of soy-based drinks or juices as a substitute for cows milk. Two of the children on diets free from cows milk and cows milk by-products in our study consumed soy-based juice with a low calcium content that does not meet the Dietary Reference Intakes recommendation for calcium.20 There are three case histories in the literature describing rickets in Belgian children aged between 15 and 18 months associated with calcium deficiency resulting from the use of a soy-based drink.26 This type of product is not specifically formulated for the pediatric age group and as such should not be recommended as a substitute for cows milk.
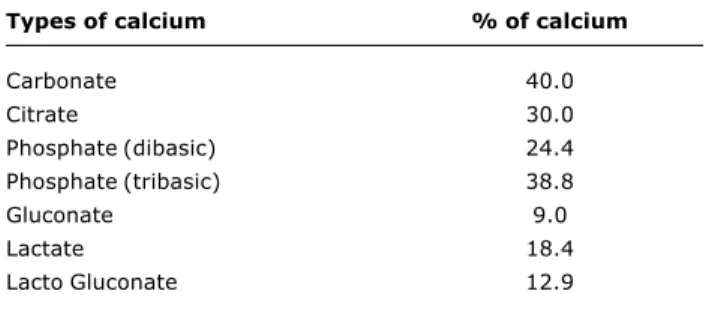
During a diet excluding cows milk and cows milk by-products, a large proportion of daily intake can be supplied by means of supplementation, which should be sufficient to meet the adopted recommendation. The calcium intake level recommended by the Dietary Reference Intakes varies according to age group: 210 mg/day (0 to 6 months), 270 mg/day (7 to 12 months) and 500 mg/day (13 to 36 months).20 Our results demonstrated calcium intake below these levels even when supplementation had been instituted (Table 4). The difficulty in correctly prescribing calcium supplementation may be a result of the existence of many different calcium formulations on the market. The choice of calcium supplement will depend upon its cost and elemental calcium content, which will vary according to the type of calcium salt employed (Table 7). In our clinical practice we use a calcium supplement in solution, composed of calcium gluconate and calcium lactobionate, and whose elemental calcium content is 216 mg/10 ml.
The elimination of cows milk and cows milk by-products is a risk factor for low calcium intake since these foods are the main sources of calcium in food. Observations have been made of inadequate bone mineralization in children subjected to these elimination diets for prolonged periods.8,10
The anthropometric assessment of the patients on cows milk and cows milk by-products free diets (Tables 1 and 2), when compared with that for the control group, presented lower mean z scores for weight/age, weight/stature and stature/age. At our health service, research has shown that Table 6 - Intake below Dietary Reference Intakes for energy,
calcium, iron, vitamins A, C and D in the group on a diet free from cows milk and cows milk by-products based on the use of soy or hydrolyzed protein based formulae as a substitute of cows milk
* Fisher’s exact test.
† Chi-square test.
The contribution of supplements of vitamins and minerals was not included. Estimated Energy Requirement (EER): reference values for the intake of energy - Dietary Reference Intakes, 2002. Adequate Intake (AI) and Recommended Dietary Allowance (RDA): reference values for the intake of proteins, calcium, phosphorous, iron, vitamins A, C and D - Dietary Reference Intakes, 1997, 2000, 2001, 2002.
Group on a diet free from cows milk and cows milk by-products
Use of No
formulae formulae p
(n = 12) (n = 14)
Energy * 3 11 0.019
Calcium 5 14 0.001
Phosphorous * 3 11 0.019
Iron 3 7 0.248
Vitamin A * 4 9 0.238
Vitamin C 0 1 1.000
References
1. Henriksen C, Eggesbo M, Halvorsen R, Botten G. Nutrient intake among two-year-old children on cows milk-restricted diets. Acta Paediatr. 2000;89:272-8.
2. Arvola T, Holmberg-Marttila D. Benefits and risks of elimination diets. Ann Med. 1999;31:293-8.
3. Paganus A, Juntunen-Backman K, Savilahti E. Follow-up of nutritional status and dietary survey in children with cows milk allergy. Acta Paediatr. 1992;81:518-21.
4. Tianen JM, Nuutinen OM, Kalavainen MP. Diet and nutritional status in children with cows milk allergy. Eur J Clin Nutr. 1995;49:605-12.
5. David TJ, Waddington E, Stanton RHJ. Nutritional hazards of elimination diets in children with atopic eczema. Arch Dis Child. 1984;59:323-5.
6. Devlin J, Stanton RHJ, David TJ. Calcium intake and cows milk free diets. Arch Dis Child. 1989;64:1183-93.
7. National Institutes Health. Consensus Development Panel on Optimal Calcium Intake. JAMA. 1994;272:1942-8.
8. Hidvégi E, Arató A, Cserháti E, Horváth C, Szabó A, Szabó A. Slight decrease in bone mineralization in cow milk-sensitive children. J Pediatr Gastroenterol Nutr. 2003;36:44-9. 9. Davidovits M, Levy Y, Avramovitz T, Eisenstein B.
Calcium-deficiency rickets in a four-year-boy with milk allergy. J Pediatr. 1993;122:249-51.
10. Infante D, Tormo R. Risk of inadequate bone mineralization in diseases involving long-term suppression of dairy products. J Pediatr Gastroenterol Nutr. 2000;30:310-3.
11. Mofidi S. Nutritional management of pediatric food hypersensitivity. Pediatrics. 2003;111(6 Pt 3):1645-53. 12. Jellife DB. Evaluación del estado de nutrición de la comunidad.
Genebra: OMS; 1968. p. 201.
13. World Health Organization. Physical status: the use and interpretation of anthropometry. Geneva; 1995. Technical Report Series 854.
14. Dean AG, Dean JA, Coulombier D, Brendel KA, Smith DC, Burton AH, et al. Epi-Info, Version 6.0: a word processor database and statistics program for epidemiology on microcomputers. Atlanta (GE): Center of Disease Control and Prevention; 1994. 15. National Center for Health Statistic. Growth curves for children
birth 18 years: United States Department of Health Education and Welfare, Vital and Health Statistic; 1977 Series 11, Nb. 165. 16. Thompson FE, Byers T. Dietary assessment resource manual. J
Nutr. 1994;124 Suppl 11:2245-317.
17. Vasconcelos FAG. Avaliação nutricional de coletividades. Florianópolis: Editora da Universidade Federal de Santa Catarina; 1995. p. 117-8.
18. Zabotto CB, Vianna RPT, Gil MF, Cunha DTO, Moreira MA, Domene SAM, et al. Registro fotográfico para inquéritos dietéticos: utensílios e porções. Goiânia: UFG; 1996. 19. Anção MS, Cuppari L, Tudisco LS, Draibe AS, Sigulem D.
Sistema de apoio à decisão em nutrição-versão 2.5. Centro de informática em saúde da Universidade Federal de São Paulo -Escola Paulista de Medicina; 1993.
20. National Research Council (NRC). Dietary Reference Intakes for Calcium, Phosphorus, Magnesium, Vitamin D, and Fluoride. Washington (DC): National Academy Press; 1997.
21. National Research Council (NRC). Dietary Reference Intakes for Vitamin C, vitamin E. Selenium, and Carotenoids. Washington (DC): National Academy Press; 2000.
Table 7 - Elemental calcium content in some calcium salts27,28
Types of calcium % of calcium
Carbonate 40.0
Citrate 30.0
Phosphate (dibasic) 24.4
Phosphate (tribasic) 38.8
Gluconate 9.0
Lactate 18.4
Lacto Gluconate 12.9
children with constipation associated with intolerance of cows milk presented lower z scores for weight/age, weight/ stature and stature/age than did children with constipation who were shown not to have cows milk intolerance following either an elimination diet or a challenge test.29,30 The subset with constipation and confirmed intolerance to cows milk protein, acquire a special interest in the sense that they do not exhibit symptoms such as vomiting, diarrhea or evidence of intestinal malabsorption which could explain the pondero-statural deficiencies. Other studies have demonstrated reductions in indices for stature/age3,4,31,32 and weight/stature31 in children with food allergies.
Studies of the nutritional status of children on elimination diets are scarce, with some observations suggesting nutritional prejudice, without, however, clearly defining the pathophysiologic mechanisms involved. Inadequate nutrient intake may have influenced the nutritional status of the children assessed in our study, but other authors have not found associations between nutritional status and food consumption.3,4,31 Allergic inflammation that is maintained throughout the elimination diet, whether by continued contact with the allergen resulting from noncompliance with the diet or by an allergic reaction to hypoallergenic formula can cause malabsorption and nutrient loss, impacting on growth.31 If the nutrient loss hypothesis is assumed to be true, current nutritional recommendations may be insufficient to guarantee the adequate nutritional status of allergic children,3 in particular those with atopic dermatitis.11,32 Further studies into this subject are necessary in order to provide more information which would allow greater security in the dietary guidance of patients with cows milk allergies on elimination diets.
Concluding, in this experiment it was found that children on cows milk and cows milk by-products free diets presented reduced calcium and phosphorous intake when compared with recommended standards and also when compared with children on normal diets. The same was true of energy intake, which factor may contribute to the nutritional deficit detected. Our findings reinforce the need to monitor the nutrient intake and nutritional status of children put onto diets free from cows milk and cows milk by-products in order to avoid nutrient deficiencies during the elimination diet.
Acknowledgements
Corresponding author: Mauro Batista de Morais
Rua Pedro de Toledo, 441, Vila Clementino CEP 04039-031 - São Paulo, SP
Brazil
Phone: +55 (11) 5579.5834 E-mail: mbmorais@osite.com.br 22. National Research Council (NRC). Dietary Reference Intakes for
Vitamin A, Vitamin K, Arsenic, Boron, Chromium, Copper, Iodine, Iron, Manganese, Molybdenum, Nickel, Silicon, Vanadium, and Zinc. Washington (DC): National Academy Press; 2001. 23. National Research Council (NRC). Dietary Reference Intakes for
Energy, Carbohydrate, Fiber, Fat, Fatty Acids, Cholesterol, Protein, and Amino Acids. Washington (DC): National Academy Press; 2002.
24. World Health Organization. Indicators for assessing breast-feeding practices. Geneva: WHO;1991.
25. Sigma Stat for Windows-Jandel Corporation.
26. Legius E, Proesmans W, Eggermont E, Vandamme-Lombaerts R, Bouillon R, Smet M. Rickets due to dietary calcium deficiency. Eur J Pediatr. 1989;148:784-5.
27. Grüdtner VS, Weingrill P, Fernandes AL. Aspectos da absorção no metabolismo do cálcio e vitamina D. Rev Bras Reumatol. 1997;37:143-51.
28. Levenson DI, Bockman RS. A review of calcium preparations. Nutr Rev. 1994;52:221-32.
29. Morais MB. Papel da alimentação na etiopatogenia e no tratamento da constipação intestinal na criança [tese]. São Paulo: UNIFESP-EPM; 1999.
30. Tahan S, Motta MEFA, Goshima S, Fagundes Neto U, Morais MB. Características clínicas de crianças com constipação crônica associada à intolerância à proteína do leite de vaca. 11o
Congresso Brasileiro de Gastroenterologia Pediátrica; 2003; Salvador. Anais. 2003. p. 19.
31. Isolauri E, Sütas Y, Salo MK, Isosomppi R, Kaila M. Elimination diet in cows milk allergy: risk for impaired growth in young children. J Pediatr. 1998;132:1004-9.