Model for Determining the Optimum Location for Performance
Improvement in Supply-Chain Strategies
Ramona Iulia AR AVULEA (DIEACONESCU)
The Bucharest University of Economic Studies, Bucharest, Romania [email protected]
Abstract
The economic crisis which started in 2007 has caused damaging effects to most international companies. In several EU countries, foreign investments decreased and international companies closed or relocated production and/or distribution centres, due to cost reduction measures. This paper is aiming to demonstrate that applying a performant solution in defining the supply chain strategy can be a low cost process, which can generate positive effects on the sales and revenues. The research objective is to present a concrete solution for redesigning the supply chain, in order to achieve the optimal delivery strategy. The solution implies the use of mathematic methods, for determining the optimum location for placing a central warehouse, in a geographic region. The use of an optimum delivery strategy leads to lower depositing and transport costs, which generates positive effects on sales, by offering more competitive prices on products. The main contribution of the author is the development of a model, used to identify the optimal location for placing a central warehouse.
Keywords: supply chain strategy; optimum location; informatics solution; mathematical optimization;
JEL Classification: L23; L25; M11;
1. Introduction
The supply chain management is the process of planning, implementing and control of the procurement, warehousing and product delivery activities. A part of the planning phase is represented by the process of defining the supply chain strategy.
Broadly examined in theory and confirmed in nowadays practice, the crisis and post-crisis period led to profound changes at political-national and organizational-corporate levels, claiming for economic and social solutions aimed to mitigate the subsequent negative effects (Iamandi and Munteanu, 2014).
During the last years, it has been noticed a growing interest of organizations in improving their business processes in order to be more competitive in a globalized economy that passed through a severe financial crisis with restrictive market conditions and limited profit margins (Geambaşu, 2012). Most retail stores expect their suppliers to offer competitive prices, because in the post-crisis years, customers are more likely to use the cost criteria when they choose the goods they buy, especially when it comes to household items and groceries.
In the process of rethinking a business strategy, an important objective is to increase the supply chain performance. The economic crisis was a low-point from which companies could rise by applying performance management principles in order to make the processes of procurement, storage and delivery run with maximum efficiency. The purpose of this paper is to introduce a new framework that can be used in the process of managing the performances of the supply chain.
2. Literature Review
2.1 Supply chain strategies
The current context, strongly marked by the global crisis, determines the organizations to initiate radical changes in their strategies (Androniceanu and Drăgulănescu, 2012). This section focuses on the synthesis of the most important contributions on the subject of supply chain strategies and management. Two main categories were identified: strategies used for designing the supply chain and strategies proposed for increasing the supply chain performance.
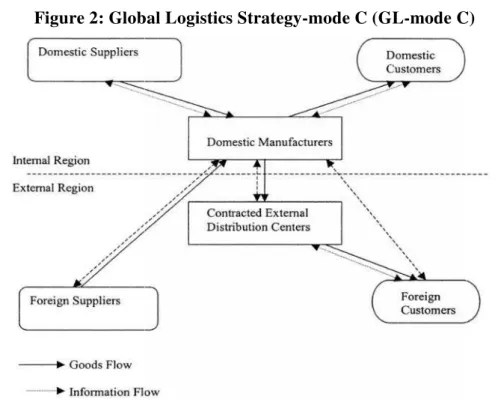
The first category of supply chain strategies on which we focus is the one used for the supply chain design. A reference work in this regard is “A hybrid fuzzy-based approach for identifying global logistics strategies” (Sheu, 2004). The author identifies six types of supply chain strategies used for the supply chain design, noted GL-mode A to F (Global Logistics - Strategy A to F):
GL-mode A, is based on the centralization of production, so the entire process of production, storage and inventory are realized in-house. Raw materials are purchased on the international market, and most customers are also from the international market, but managing the delivery process is conducted by the company.
GL-mode B is a strategy similar to the first described, but the novelty is that some of the production work is outsourced to markets that offer advantages in terms of lower cost labour. Storage activity, inventory and delivery is coordinated and carried out by the company through its own resources.
GL-mode C is a strategy also derived from GL-mode A, carrying the same idea of the centralization of production, but with a different distribution system. In this case the distribution is made not only by the company but there are external distribution centres supplying to various customers according to their geographical location so as to reduce transport costs.
GL-mode E and GL mode-F are two models with complex strategies, used mainly by advanced technology companies. Within these, several activities are outsourced as part of the production and assembly of components. Both strategies aimed at the partial or total outsourcing of distribution to foreign distribution centres.
GL-mode F strategy has extra features such as: partner companies that take part in the production and distribution centres, thus reducing logistics costs for distribution to foreign consumers. Flows of raw materials and goods in the two cases become extremely complex, logistical system becomes a vital component for the operation of production and distribution.
Sheu (2004) presents graphical illustrations of each supply chain design strategy and propose a decision making model for choosing the right logistics strategies, depending on the objectives of the company.
Another major category of logistics strategies are the ones used for supply chain performance improvement. Bowersox and Daugherty (1987) divided supply chain strategies in three categories: process-oriented strategies, market-oriented strategies and information-oriented strategies.
In companies which apply the first strategic orientation (process-oriented), supply chain management is considered an internal activity that creates added value to products. This should be carried out with maximum efficiency, focusing on continuous improvement process management.
The second strategic direction (market-oriented) is based on the market so the company can reduce operations complexity by outsourcing the supply chain management process (or part of it) to a supplier that provides a package of integrated logistics services. The company is able to focus on core business in order to offer customers the best possible products and services. This strategy is based on creating a synergy with a 3PL81 company, ensuring performance management of the supply chain.
The third strategic orientation (information-oriented) involves creating a supply chain network in which several companies, which collaborate for the delivery, carry out joint logistic activities. To achieve such coordination of inter-company logistics processes, it is necessary to create a communication system consisting of channels for transmitting information between participants in the logistics network.
In 1989, Bowersox and Daugherty collaborated with Droge, Rogers and Warlow to verify and improve the three categories previously defined by the first two authors. The market research was conducted by email and had 375 respondents. The analysis retained the three categories defined above, but changed the name for the last category from information strategy to channel strategy (Bowersoxet al., 1989).
McGinnis and Kohn (1990) also made a market research conducted by email, with 222 respondents to verify the hypothesis: the categories of logistics strategies can be determined empirically. They used methods like: factor analysis, clustering and ANOVA, and the results were the identification of four categories of supply chain strategies: i) intensive; ii) integrated; iii) poor integrated; iv) low efficiency.
81
McGinnis and Kohn (1993) conducted a parallel investigation for empirical verification of the three categories of logistics strategies defined by Bowersox and Daugherty (1987). They conducted a market research by email, with 59 respondents and the data processing was done by using factor analysis methods, clustering and ANOVA. The study confirmed the first two categories of logistics strategies: processes orientation and market orientation and identified three sub-categories, depending on the competitiveness of the economic environment: intense, balanced and unfocused.
Starting from the same study published by Bowersox and Daugherty (1987), Clinton and Closs (1997) conducted an empirical research of the three categories of supply chain strategies through market research conducted also by email, with 103 respondents. The methods of data analysis consisted of factor analysis and MANOVA. The results confirmed the three categories of logistics strategies (process, market and channel), and also the possibility of combining them, identifying the contributing factors.
In 1997, Kohn and McGinnis continued their research and published two more studies. The first one aimed to examine supply chain strategies through market research conducted by email, with 94 respondents whose data were processed by factor analysis and ANOVA methods. Thus, they identified two supply chain strategies used by companies: market and channel oriented strategy (the two combined) and processes-oriented strategy. It was concluded that the competitive environment had a decisive influence on the choice of supply chain strategy. The second study aimed to determine the correlation between categories of strategies and verify the hypothesis that logistic priorities affect the orientation of supply chain strategy. The market research was conducted by email, with 94 respondents and data processing methods were used: factor analysis, clustering and ANOVA. Two categories of supply chain strategies were identified: orientation towards integrated logistics (managing complex logistics flows through coordination) and orientation to processes (efficiency, control and cost reduction). It identified four logistical strategies: intense, intense integration, process intense and extensive.
Another study conducted in 2002 by McGinnis and Kohn aimed at determining the relationship between the categories of supply chain strategies defined by Bowersox and Daugherty (1987) and their efficiency. The market research was conducted by email, with 172 respondents. Data processing was done by using factor analysis and multifactorial regression methods. As a result, two types of strategies were identified: process-oriented and market-oriented strategies; the information strategy overlapped the first two, facilitating their implementation. The conclusion was that they are all interdependent and dynamic.
2.2 Factors that Influence the Change in Supply Chain Strategies Taxonomy
Today's marketplace is shifting from individual company performance to supply chain performance: the entire chain's ability to meet end-customer needs through product availability and responsive, on-time delivery. Supply chain performance crosses both functional lines and company boundaries (Supply Chain Online, 2014). The latest development in this field is supply chain performance management software, offered by companies like SAP, the world leader in enterprise software and software-related services in terms of revenue (SAP Supply Chain Performance Management, 2014).
The international economic environment is constantly changing as the customers became more exigent with their demands, the sources of supply are global, workforce is migrating, the manufacturing process can be relocated based on cost restrains and the product cycles are shorter, as the advance in technology permits new improvements faster than ever before.
In order to be able to adapt the supply chain of a company to the economic environment, we must identify the factors that should be taken into consideration when the supply chain strategy is being defined.
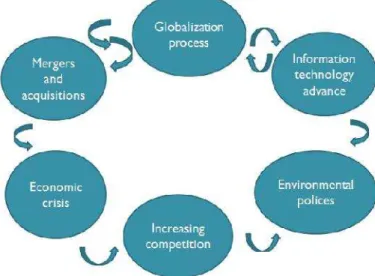
La Londe and Masters (1994) identified a series of factors that determine the need to adjust supply chain strategies to the global business environment changes, synthesized in Figure 1. Through a personal interpretation, the factors identified by La Londe and Masters (1995), were adapted to the current economic period so the following market variables resulted:
(1) The process of globalization. Trade liberalization has led to an increase in trade and many companies have expanded their operations in the international market. Raising living standards in most countries resulted in an increase of consumer exigency both in terms of product quality and related delivery services. Thus, the competition has become increasingly fierce and the complexity of logistic processes increased.
(2) Mergers and acquisitions. In the ‘80 mergers and acquisitions have become a widely used method of expansion in the capitalist countries to increase turnover and profit. The newly created companies often had an oversized and redundant logistic function in terms of capacity, due to the merge of several logistics departments from those firms.
(3) The economic crisis. There were several economic crises over the time, but we’re going to focus on the latest one. In the last 3-4 years, the financial crisis effects were felt through the need to reduce costs, reflected in particular by reducing the production capacity and staff. Some companies have seen an opportunity in the economic downturn to rethink the medium and long term strategy, using cost-cutting plans to increase long-term competitiveness of the company.
(4) Intense competition and increasing market uncertainty. If we look at the three factors mentioned above, we find that they have led to fierce market competition: over the past three decades, multinationals have entered national markets (1) and the demand had decreased (3), so uncertainty in the market increased. Considering all factors stated before it can be concluded that the complexity of decision making process in business has increased.
(6) Advances in Information Technology. This is one of the factors that have helped to a more efficient management of supply chain activities and faster delivery. In the last decade, the cost of purchasing hardware products decreased and software capabilities have improved in a fast pace. Each project has specific characteristics that should be taken into consideration when choosing the methodology that will be used for software development. (Geambaşuet al., 2011)
Figure 1: Factors that determine the necessity of adapting logistic strategies to the changing economic environment
Source: by the author based on the information from La Londe and Masters (1994)
The next section of the paper is conducting an analysis on the supply chain strategies implementation, as case studies on successful companies present it.
2.3 Best Practices in Implementing Supply Chain Strategies
A case study on the implementation of logistics strategies was conducted in 2006 by AberdeenGroup. The study entitled "Best Practices in International Logistics Report" presented strategies for increasing the supply chain performance implemented by eight companies selected as "best practice winners" in logistics. The report identified different segments of the supply chain on which companies can concentrate in order to achieve an improvement in the logistic management process.
Valuation of companies was based on the following criteria:
The impact of supply chain strategy on company competitiveness
The degree of improvement in the logistics system flexibility, cycle time and total cost
Impact of the supply chain strategy implementation on other departments (sales, purchasing, production, finance)
Efficiency of strategies in internal management upgrade
The degree of collaboration with suppliers and logistics service providers
Although the analysed companies have focused efforts on improving performance in various areas of international logistics, some basic strategies were identified:
(1) Automation strategy
(2) The strategy of using ultra-performance computing technology
(4) The effective inventory strategy
(5) The strategy of maximizing the benefits derived from trade agreements (6) The strategy of outsourcing logistics activities
Combining logistics strategies can lead to new strategies by achieving a synergistic effect. An example of this is the logistics strategy "just-in-time", which was successfully applied by Toyota in the 20th century. The "Just in time" strategy is based on a set of principles, tools and techniques that allow a company to manufacture and deliver products in small quantities at short notice to meet specific customer needs. This strategy is aimed at delivering the right products, in the required quantity and at the right time. The objectives are defined in terms of:
Reducing the production cycle;
Reduce stocks and quantity of products under manufacture;
Reducing of staff performing unproductive duties;
Reduction of the “non-quality" indicator;
Provide a high level of customer service;
Increased capacity to adapt to environmental changes.
To achieve these objectives, different strategies can be combined, for example:
Automation to reduce labour costs;
Computerization, for an advanced information management.
Other measures to support the implementation of the strategy "just-in-time" are:
Fast reception of product;
Modifying the organizational structure;
Streamlining the production process;
Continuous training of employees and a good motivational system.
The two main objectives of the company that applies this strategy are apparently contradictory:
The company must provide quality products at low prices as soon as possible;
The production system must be characterized by reliability and flexibility.
The utility value of quantitative objectives is determined by the costs which would be involved in the use of alternative marketing instruments (Cărăgin and Drăgoi, 2008). Mathematical optimization and modelling can be applied in the area of improving the supply chain performance by obtaining specific solutions for decisions regarding the supply chain strategy. Further, our research is focused on applying supply chain strategies in the European Economic Area, with the determination of optimum strategies for European companies, with international operations.
3. Research Methodology
The main methods used in thi presented in the literature revi the change in logistics strateg strategies can be combined a environment. Specifically, we use mathematical optimization centre that can supply the ke applying a mathematic model, t
The expected result of the r delivery strategy that can lead case of companies with interna
4. Supply Chain Str
for European C
For companies with internationa enhance their competitiveness choice for the supply chain de to focus on its core activity companies that don’t want to latest information technology that enables the company to c different countries. The fact outsourced transforms fixed c supply chain, making it viable f
Figure 2: Global
Source: Sheu (2004)
n this research are: comparison of the supply c eview section, identification of the main factors
tegies taxonomy, analysis of the manner in w d and statistical data collection on the Europe
e aim at identifying the main consumer conglom ion to determine the optimal location for a sing key points identified. This can be achieved b odel, transposed into an informatics solution.
he research is the presentation of a solution f ead to increasing the performance of the suppl
rnational operations, located in Europe.
n Strategies and Performance
n Companies
tional operations, located in the European Uni ness in order to increase their income from ex n design would be GL mode-C, a strategy that ena
vity (centralization of production). This solut to invest very much in large departments for log ogy needed for achieving an efficient communi
coordinate the production process in several l ct that the distribution system and the stora d costs into variable ones, so it gives more fle ble for different types of economic cycles.
obal Logistics Strategy-mode C (GL-mode C)
y chain strategies ors that influence n which different ropean economic onglomerations, and ingle distribution by defining and
on for an optimal supply chain for the
Union, aiming to exports, the best t enables the firm solution is fit for logistics and the unication system al locations, from orage are mostly flexibility to the
I analysed the theoretical solution presented by Sheu (2004) from the perspective of a company located in the European Union that has international operations or wants to expand their business abroad, taking into consideration the present economic environment. The decision of business internationalization must be taken under the financial constraints of the company and with a clear view on the economic factors. It is imperative that the management team develops a coherent supply chain strategy that can insure an efficient delivery of products to all targeted foreign markets.
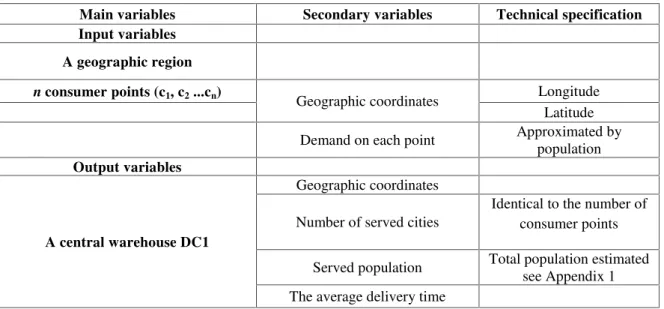
As a part of this research, I developed a supply chain model that can be used by companies that carry out international activities in order to deliver products all over Europe. The supply chain model has the scope of identifying the best location for placing a central warehouse, which insures a minimum cost of transportation to all the consumer points, taking into consideration the size of the market by using the population number as a general indicator. For particular situations, a market study on a certain sector could indicate a more accurate approximation of the demand for products of interest in the market. Munteanuet al. (2015) considered that: “the simplification of the existent causal structure in the initial space of the variables was needed in order to identify the evolution of the investigated phenomena”. In this case, the simplification was applied on the output variables: the calculation of the estimated distance does not take into account the exact route according to transport infrastructure and the estimated time is determined using an average speed of 90 km/hour (taking into account a SafetyNet report on speeding in Europe stating that for urban roads the average speed is 60 km/h and for rural roads the average speed is between 80-120 km/h). The conceptual framework of the model includes a series of input and output variables, as presented in Table 1.
Table 1: Input and output variables
Main variables Secondary variables Technical specification Input variables
A geographic region
nconsumer points (c1, c2...cn)
Geographic coordinates Longitude Latitude
Demand on each point Approximated by population
Output variables
A central warehouse DC1
Geographic coordinates
Number of served cities
Identical to the number of consumer points
Served population Total population estimated see Appendix 1 The average delivery time
Source: by the author
The hypotheses of the model are:
1) Any product can be delivered through a single transport;
2) The model does not take into account the transport infrastructure; 3) The decisional process is considered to be economically rational.
The model is structured in several steps of application.
I.Defining the geographic space of interest to the company as a sales market
The first step in optimizing the supply chain strategy is to define the geographic area that includes the targeted sales market. Then the company must try to identify the consumer points that are of interest to the company. Each of the consumer points is to be defined by their geographic position (latitude and longitude) and the demand. Of course, this depends very much on the company’s profile, so on a general perspective I selected the largest 100 European cities, considered to be the largest ones by population criterion (the source of data is Eurostat website, the information is gathered at the level of year 2012 official population declared - the data must be from the same year in order to insure data comparability). The data regarding the 100 largest cities of the European Union that is necessary as input variable into our model is presented in Appendix 1.
II.The determination of the location for a central warehouse, which ensures the minimum total delivery cost to all the consumer points.
II.1.The geographic coordinates must be transformed in decimal numbers so that they can be used in calculations. This can be done using Microsoft Excel and the formula:
TEXT(ROUND(LEFT(F5,3)+(MID(F5,5,2)+RIGHT(F5,5)/60)/60,6),"00.000000") (1)
II.2. Calculating the geographic coordinates of the gravitational centre of the consumer points we have defined. The mathematical formulas used for determining the optimal location for a central warehouse are:
Latcg= Longcg= (2)
Latcg–the latitude of the optimal gravitational point Longcg–the longitude of the optimal gravitational point Ci–the demand in the pointi
As mentioned, these formulas are used in geometry for calculation of a gravitational centre of several points. They are adapted for practical application in supply chain strategy optimization.
The mathematical optimization model was transposed into an informatics solution, implemented in the C++ programming language, in order to obtain the calculation results, which are the exact coordinates for the optimum position of a central warehouse (further referred as CW).
III. Determination of the distances between the CW and each consumer point. The algorithm is based on the Excel function “atan 2” for which we need to have the geographic coordinates of the CW and each city, as well as the earth’s radius.
IV. For each consumer centre the time of delivery can estimated using the classic formula:
5. Results and Conclusions
After introducing the input data into the model, we obtained the geographic coordinates of the optimal location for placing a central warehouse: the latitude is 47.65552 and the longitude is 12.45081 (decimal format). This result can be graphical represented in the geographic space.
Figure 3. Graphical representation of the optimal location for a central warehouse in the European geographic space
Source: Representation generated by the author, using the web site: http://itouchmap.com/latlong.html
Results showed that the geographic location of the point that insures a minimum transportation cost is placed in Central Europe, more exactly near the border between Germany and Austria. Any location near this point would constitute a good placement for a logistic facility location that can insure the implementation of an efficient supply chain strategy.
The model presented can be adapted to any number of consumer points and the demand can be determined more accurately if a specific type of products are selected.
For small or medium size enterprises from emerging countries we recommend the rental of one central logistic facility which can insure the delivery of products to all the consumer points that are previously identified through a market study. For large companies that want to reduce delivery costs, the recommended supply chain strategy is the construction or acquisition of a large warehouse located near the point indicated by our model that can insure the most efficient supply chain management.
The main conclusion of this research is that mathematical optimization can be used to develop a supply chain strategy aiming to decrease depositing and transport costs and generate positive effects on sales, by offering more competitive prices on products. The presented solution can contribute to a performant design of the supply chain, because it is widely recognised that transport has the highest impact on logistic operations costs.
Acknowledgment:
This paper was co-financed from the European Social Fund, through the Sectorial Operational Programme Human Resources Development 2007-2013, project number POSDRU/159/1.5/S/138907 "Excellence in scientific interdisciplinary research, doctoral and postdoctoral, in the economic, social and medical fields -EXCELIS", coordinator The Bucharest University of Economic Studies.
References:
Aberdeen Group (2006): Best Practices in International Logistics, Available at: http://www.dwmorgan.com/wp-content/uploads/2013/02/Aberdeen_2006BestPracticesReport.pdf
Androniceanu, A., Drăgulănescu, I-V ( 2012): Sustainability of the organizational changes in the context of global economic crisis.Amfiteatru EconomicXIV(32): 365-379.
Bowersox, D.J., Daugherty, P. J. (1987): Emerging Patterns of Logistics Organization.Journal of Business Logistics8(1): 46-60.
Bowersox, D.J., P.J. Daugherty, C.L. Droge, D.S. Rogers and D.L. Wardlow (1989): Leading edge logistics: Competitive positioning for the 1990s. Oak Brook, IL: Council of Logistics Management.
Cărăgin, A.R., Drăgoi, M.C. (2008): Measuring the Efficiency of the Prospecting Activity,
Analele Universităţ ii din Oradea, Seria Ştiinţ e Economice, Tom XVII, 2008 IV: 798-803.
Clinton, S.R., Closs, D.J. (1997): Logistics strategy: Does it exist?.Journal of Business Logistics 18:19–44.
Eurostat Statistics (2014): Statistics on European cities. Available at: http://epp.eurostat.ec.europa.eu/statistics_explained/index.php/Statistics_on_European_cities Geambașu, C.V. (2012): BPMN vs. UML Activity Diagram for business process modelling. Accounting and Management Information Systems11(4): 637–651.
Geambașu, C.V., Jianu I., Jianu I., Gavrilă A. (2011): Influence factors for the choice of a software development methodology. Accounting and Management Information Systems 10(4): 479–494.
Iamandi, I-E., Munteanu, S. M. (2014): Corporate Social Responsibility through Education and Sport. An EU Comparative Case.The Romanian Economic Journal (REJ)XVII (54):73-97. iTouchMap (2014): Latitude and Longitude of a Point. Available at: http://itouchmap.com/latlong.html
Kurien, G.P., M.N. Qureshi (2011): Study of performance measurement practices in supply chain management.International Journal of Business, Management and Social Sciences2(4): 19-34. La Londe, B.J., Masters, J.M. (1994): Emerging logistics strategies: blueprints for the next century.International Journal of Physical Distribution and Logistics Management24(7): 35-47. McGinnis, M.A., Kohn, J.W. (1990): A longitudinal study of logistics strategy. Journal of Business Logistics31(1): 217–235.
McGinnis, M.A., Kohn, J.W. (1993): A factor analytic study of logistics strategy. Journal of Business Logistics14:1–23.
McGinnis, M. A., Kohn, J. W. (2002): Logistics strategy-revised.Journal of Business Logistics 23(2): 1-17.
Sheu, J-B. (2004): A hybrid fuzzy-based approach for identifying global logistics strategies. Transportation ResearchPart E 40: 39–61.
Supply Chain Online (2014): Performance Measures for Supply Chain Management. https://www.supplychainonline.com/cgi-bin/preview/SCM105/1.html
SAP Supply Chain Performance Management (2014): Outperform stakeholder expectations with our supply chain performance management software. Available at:
http://www.sap.com/pc/analytics/applications/software/supply-chain-performance-management/index.html
SafetyNet (2009): Speeding. Available at: http://ec.europa.eu/transport/road_safety/ specialist/knowledge/pdf/speeding.pdf
Taticchi, P., Tonelli, F., Cagnazzo, L. (2010): Performance measurement and management: a literature review and a research agenda. Measuring Business Excellence, Emerald Group Publishing Limited 14(1): 4-18.
Appendix 1. The 100 largest cities of the European Union by population within city limits
Rank City Country Latitude Longitude
Official population
2012
Estimated distance
(km)
Estimated
delivery time (hours)
1 London United
Kingdom 51.5073 0.1277 8,174,000 1434.9156 15.94 2 Berlin Germany 52.5192 13.4061 3,501,872 550.8702 6.12
3 Madrid Spain 40.4167 3.7003 3,284,110 1262.1540 14.02
4 Rome Italy 41.9015 12.4608 2,799,350 639.4944 7.11
5 Paris France 48.8566 2.3522 2,234,105 1130.2552 12.56
6 Hamburg Germany 53.5511 9.9937 1,802,041 709.8549 7.89
7 Budapest Hungary 47.4984 19.0408 1,740,041 732.6101 8.14
8 Vienna Austria 48.2082 16.3738 1,730,278 440.3010 4.89
9 Warsaw Poland 52.2297 21.0122 1,700,612 1078.7915 11.99
10 Bucharest Romania 44.4377 26.0974 1,677,985 1558.2552 17.31
11 Barcelona Spain 41.3879 2.1699 1,621,537 1338.1939 14.87
12 Munich Germany 48.1366 11.5771 1,378,176 110.8496 1.23
13 Milan Italy 45.4655 9.1865 1,345,890 436.8736 4.85
14 Prague Czech
Republic 50.0755 14.4378 1,290,846 347.9974 3.87 15 Sofia Bulgaria 42.6965 23.3260 1,204,685 1328.3807 14.76
16 Brussels Belgium 50.8503 4.3517 1,119,088 967.6218 10.75
17 Birmingham United
Kingdom 33.5207 86.8025 1,016,800 8411.3363 93.46 18 Koln Germany 50.9375 6.9603 1,000,298 710.9141 7.90
19 Naples Italy 26.1420 81.7948 957,012 8069.1647 89.66
20 Torino Italy 45.0629 7.6785 905,554 603.6023 6.71
21 Stockholm Sweden 59.3289 18.0649 861,010 1439.6017 16.00
22 Marseille France 43.2965 5.3698 850,602 924.1340 10.27
23 Valencia Spain 39.4702 0.3768 814,208 1621.1804 18.01
24 Amsterdam Netherlands 52.3702 4.8952 789,285 989.7913 11.00
25 Kraków Poland 50.0647 19.9450 756,666 874.8732 9.72
26 Leeds United
Kingdom 53.8013 1.5486 751,500 1390.9149 15.45 27 Łódź Poland 51.7592 19.4560 750,125 902.2978 10.03
28 Athens Greece 37.9837 23.7293 3,737,550 1651.2528 18.35
29 Riga Latvia 56.9462 24.1043 713,000 1656.3768 18.40
30 Sevilla Spain 37.3826 5.9963 703,206 1348.3703 14.98
31 Frankfurt Germany 50.1109 8.6821 691,518 499.9020 5.55
32 Zaragoza Spain 41.6568 0.8799 674,317 1448.5179 16.09
33 Palermo Italy 38.1157 13.3613 653,522 1065.0597 11.83
35 Rotterdam Netherlands 51.9242 4.4818 615,937 1004.7242 11.16
36 Genova Italy 44.4056 8.9463 606,206 531.1861 5.90
37 Helsinki Finland 60.1698 24.9386 600,551 1964.8344 21.83
38 Stuttgart Germany 48.7754 9.1818 595,452 384.0405 4.27
39 Düsseldorf Germany 51.2277 6.7735 592,393 745.4765 8.28
40 Glasgow United
Kingdom 55.8642 4.2518 581,900 1289.4285 14.33 41 Dortmund Germany 51.5136 7.4653 580,444 700.6146 7.78
42 Essen Germany 51.4556 7.0116 574,635 737.4243 8.19
43 Málaga Spain 36.7196 4.4200 568,305 1507.9182 16.75
44 Poznań Poland 52.4064 16.9252 564,035 725.3102 8.06
45 Vilnius Lithuania 54.6894 25.2800 553,553 1626.0584 18.07
46 Bremen Germany 53.0793 8.8017 548,477 726.5214 8.07
47 Sheffield United
Kingdom 53.3811 1.4701 534,500 1376.3165 15.29 48 Leipzig Germany 51.3397 12.3731 533,374 409.5455 4.55
49 Dresden Germany 51.0504 13.7373 530,548 403.4845 4.48
50 Dublin Ireland 53.3494 6.2601 525,383 934.7880 10.39
51 Copenhagen Denmark 55.6761 12.5683 520,659 891.4913 9.91
52 Hannover Germany 52.3759 9.7320 517,251 605.4136 6.73
53 Gothenburg Sweden 57.7089 11.9746 507,330 1118.5709 12.43
54 Bradford United
Kingdom 53.7960 1.7594 501,700 1370.2611 15.23 55 Nuremberg Germany 49.4520 11.0767 500,967 251.3678 2.79
56 Lisbon Portugal 38.7253 9.1500 499,700 1058.1195 11.76
57 Duisburg Germany 51.4344 6.7623 496,665 758.9964 8.43
58 Antwerp Belgium 51.2192 4.4029 493,517 978.2003 10.87
59 Edinburgh United
Kingdom 55.9533 3.1883 477,660 1382.0885 15.36 60 The Hague Netherlands 52.0705 4.3007 473,941 1030.1551 11.45
61 Lyon France 45.7640 4.8357 472,304 872.0500 9.69
62 Manchester United
Kingdom 53.4793 2.2479 503,000 1305.6571 14.51
63 Gdańsk Poland 54.3520 18.6466 456,103 1013.9264 11.27
64 Toulouse France 43.6047 1.4442 440,204 1303.4738 14.48
65 Murcia Spain 37.9834 1.1299 436,870 1654.8561 18.39
66 Liverpool United
Kingdom 53.4084 2.9916 434,900 1230.4413 13.67 67 Bratislava Slovakia 48.1462 17.1073 431,061 520.3809 5.78
68 Bristol United
Kingdom 51.4545 2.5879 421,300 1174.6522 13.05 69 Szczecin Poland 53.4285 14.5528 408,583 682.8075 7.59
70 Brno Czech
72 Tallinn Estonia 59.4427 24.7532 396,193 1893.5558 21.04
73 Bologna Italy 44.4949 11.3426 383,418 372.2337 4.14
74 Bochum Germany 51.4818 7.2162 382,195 720.6164 8.01
75
Las Palmas de Gran Canaria
Spain 28.1248 15.4300 381,847 2195.7238 24.40
76 Florence Italy 43.7710 11.2480 372,473 451.9425 5.02
77 Thessaloniki Greece 40.6393 22.9446 363,987 1402.9321 15.59
78 Bydgoszcz Poland 53.1235 18.0084 362,397 866.4932 9.63
79 Kaunas Lithuania 54.8969 23.8924 360,630 1504.8816 16.72
80 Wuppertal Germany 51.2562 7.1508 358,746 712.1112 7.91
81 Bilbao Spain 43.2570 2.9234 354,860 1166.2588 12.96
82 Lublin Poland 51.2465 22.5684 352,786 1193.1787 13.26
83 Nice France 43.6960 7.2656 347,060 725.0818 8.06
84 Plovdiv Bulgaria 42.1438 24.7496 338,153 1497.8546 16.64
85 Varna Bulgaria 43.2166 27.9118 334,870 1787.7293 19.86
86 Alicante Spain 38.3452 0.4810 334,757 1685.3472 18.73
87 Córdoba Spain 31.3989 64.1821 328,428 6026.5429 66.96
88 Bielefeld Germany 52.0213 8.5303 326,268 652.1327 7.25
89 Wakefield United
Kingdom 53.6833 1.5059 322,300 1388.6770 15.43
90 Cardiff United
Kingdom 51.4816 3.1791 321,000 1114.7341 12.39 91 Bari Italy 41.1171 16.8719 319,252 877.1992 9.75
92 Valladolid Spain 41.6529 4.7284 318,461 1087.0411 12.08
93 Katowice Poland 50.2649 19.0238 317,864 785.9709 8.73
94 Aarhus Denmark 56.1629 10.2039 315,193 977.9190 10.87
95 Ostrava Czech
Republic 49.8209 18.2625 310,397 689.2796 7.66
96 Coventry United
Kingdom 52.4068 1.5197 309,800 1324.6663 14.72
97 Wirral United
Kingdom 53.3780 3.1088 309,500 1217.5630 13.53 98 Cluj-Napoca Romania 46.7772 23.5999 309,136 1242.9329 13.81
99 Timişoara Romania 45.7555 21.2375 303,708 999.1103 11.10
100 Mannheim Germany 49.4875 8.4660 300,793 487.4267 5.42