AN OVERVIEW ON THE BRAZILIAN
ORANGE JUICE PRODUCTION CHAIN
1RENATO MARCIO DOS SANTOS2, IRENILZA DE ALENCAR NÄÄS3,
MARIO MOLLO NETO4,ODUVALDO VENDRAMETTO5
ABSTRACT - Brazil is the world’s largest producer of oranges and uses more than 70% of the harvested
fruits in the production of juices. The amount of processed orange is growing about 10% per year, confirming the trend of the Brazilian citrus for juice production. This research aimed to investigate the Brazilian orange juice production chain from 2005 to 2009. Data from the amount of frozen juice produced and exported, international price of orange juice, and intermediate transactions were assessed in order to make possible selection of all interveners involved in the chain. The study using the Social Network Analysis (SNA) showed that the densest relationships in the network are from exporters to importers and from orange growers to the orange processing industry. No difference was found in the values of the network geodesic distance or the clustering coefficients from 2005 to 2009. The degree of centrality increased steadily throughout the years indicating that the processing industry attempts to minimize the risks by centralizing the actions. A decrease in export of orange juice from 2007 (2.07 106 t) to 2008 (2.05 106 t) was found, probably due to the world’s
financial crisis with recovery in 2009. Since 2004, there has been an increase of nearly 10% per year in the market preference of concentrate juice (OFCJ) when compared to the “not from concentrated” juice (NFC). Nowadays the NFC market represents nearly 50% of all Brazilian export which impacted in the logistic
distribution and transportation issues.
Index terms: network analysis, SNA, production chain, orange production.
UMA VISÃO DA PRODUÇÃO BRASILEIRA DE SUCO DE LARANJA
RESUMO - O Brasil é o maior produtor de laranjas no mundo e utiliza mais de 70% das frutas que produz
na fabricação de suco. A proporção de laranjas processadas vem crescendo cerca de 10% ao ano, confirmando a tendência da citricultura brasileira para a produção de suco. O objetivo deste trabalho foi apresentar uma visão geral sobre a cadeia de produção de suco de laranja brasileiro por meio da análise de rede social a partir de 2005 a 2009. Os dados de volume de suco congelado produzido e exportado, o preço internacional do suco de laranja e as transações intermediárias foram avaliados a fim de tornar possível a matriz de todos os intervenientes na cadeia. O estudo, utilizando a Análise de Redes Sociais (ARS) mostrou que as relações mais densas na rede são as de exportadores para importadores e produtores de laranja para a empresa de processamento. Não houve diferença nos valores da distância geodésica ou coeficientes de agrupamento da
rede, de 2005 a 2009. O grau de centralidade aumentou de forma constante ao longo dos anos, indicando que
a indústria de processamento tenta minimizar os riscos através da centralização das ações. A exportação de suco de laranja diminuiu de 2007 (2,07 106 t) para 2008 (2,05 106 t), provavelmente devido à crise financeira
mundial, recuperando em 2009. Desde 2004, houve um aumento de quase 10% ao ano na preferência do mercado a partir do suco concentrado (OFCJ) para o “não concentrado” suco (NFC). Hoje, o mercado de NFC representa quase 50% de toda a exportação brasileira, o que impactou na distribuição logística e nas questões de transporte.
Termos para indexação: análise de redes, ARS, cadeia produtiva, produção de laranja.
1(Trabalho 252-12). Recebido em: Aceito para publicação em:
2MS em Engenharia de Produção - UNIP -São Paulo. [email protected]
3PhD em Engenharia Agrícola. Prof. Titular. Graduate Program in Production Engineering, PPGEP/UNIP. Dr. Bacelar St. 1212, CEP
04026-002, São Paulo, Brazil.E-mail: [email protected]
INTRODUCTION
Orange juice represents one of the main production chains in Brazil, corresponding to
nearly 17.8 million tons produced yearly. Records during 2009 indicate a production of 1.0 million
tons of orange juice, which is equivalent to 57% and 80% of the world’s exports (DESER, 2009). Most orange juices are mechanically extracted and
concentrated to reduce the cost of transportation and storage (CRANDALL et al, 1987; ARENA et al., 2006). The commercial processes of concentrating
orange juice usually involves the removal of water at high temperature followed by recovery and
concentration of volatile aromas, and their addition
back to the concentrated product. However, most juice manufacturers do not restore all the original
volatiles, probably for economic reasons (ARENA
et al., 2006). Orange juice can be frozen and sold as frozen concentrated orange juice (FCOJ), or stored and shipped in bulk to a distant distribution point where dilution, reheating, and packaging occurs. The aroma of many RFC juices heated or processed, differ from that of freshly squeezed oranges (BRAT
et al., 2003; ARENA et al., 2006). This off-odor is
observed most commonly in canned RFC juices, which are heated twice, one during the concentration process and again after the juice is diluted with local water and hot filled to sterilize the container.
These thermal treatments induce chemical changes
in orange juices, which severely degrade the fresh orange juice volatiles, and produce new volatiles
(SHAW et al., 1993).
The world’s largest importers of orange juice are respectively, the United States, Canada,
Japan, Russia and China (USDA, 2009). Increase in
export requires constant efforts in logistics activities
and processes of production, sustainability of the
production network. Brazilian orange juice industry went through a period of crisis in the second semester of 2007, which was associated to the fall of prices of the commodity, and the decrease in the world’s demand for the product. The cause was also related to the recovery of orchards in Florida, which Brazil
is the biggest competitor, the additional cost of citrus
production limiting the supply of juice due to higher incidence of diseases, and the growing loss of power of farmers who were facing the growing expansion
of sugar cane plantations in the state of São Paulo
(ABECITRUS, 2007). These are just some of the
challenges that companies in this segment need to
address to stay leader in the market at that time, and the scenario worsened with the global economic
crisis in 2008.
The supply/production chain can be
understood as a network that performs the search of
material, transforms these materials into intermediate
and finished products, and then distributes them to customers. Supply chain is defined as a network of organizations connected downstream and upstream with relations of cause and effect processes
and activities; value is attached to the products and services delivered to the consumer (LEE; BILLINGTON, 1993; CHRISTOPHER, 2003). When applying strategic alliances, each company contributes to its core competencies and through the alliance may reach better results than each member alone has to offer, and can still get results that none company alone is capable of achieving (TICHY et al., 1979; CHURCHILL; PETER, 2000). Supply chain
networks involve several linked actions between market segments and governmental bodies, which can be considered similar to a social network, and it may be considered within the principles of SNA.
Initially developed to describe social structures, SNA has its origins in the studies of patterns of
communication, influence and interactions within
social groups (SCOTT, 2000; RICHARDSON,
2009). Furthermore, a method of drawing on graph theory was developed for describing and analyzing the relationships amongst members of a group with explicit links and interactions (CARPENTER;
WESTPHAL, 2001).
This research aimed to analyze the orange juice supply chain, the interveners which compose it, and their interactions, in order to give an overview of the Brazilian production chain from 2005 to 2009 using the social network analysis.
METHODOLOGY
Data on volume of orange frozen juice produced, volume of frozen juice exported, the international price of orange juice and the intermediate transactions were assessed in several sources directly related to orange and frozen juice production in order to make possible to array of all interveners involved
in the chain (Secretary of Foreign Commerce -
SECEX), Brazilian Association of Citrus Export – ABECITRUS, Brazilian Association of Citrus
Producers – ASSOCITRUS, Department of Rural and Socio-Economic Studies-DESER, Syndicate of
Frozen Food and Concentrated Industry in the State
of São Paulo- SICONGEL, and the United States Department of Agriculture-USDA).
(Figure 1). The following actions were considered within the network: fruit production; storage of
the fruit; transportation from the producer to the processing plant; processing of the fruit; storage at the processing plant; transportation from the
processing plant to the export terminal, shipment
of the product; and transportation to its destination. Nodes or interveners are the people, groups
of persons or companies acting within the network. Each intervener is a node. The size of the network is
obtained by adding all nodes. This study considered
the following interveners in the orange juice production chain: the grower of the fruit; the
responsible for storage at the farm level; the responsible for transporting the fruit from the farm to the processing plant; processing of the fruit; the responsible for storage at the processing plant; the responsible for transportation from the processing
plant to the export terminal, the responsible for the handling and shipment of the juice; and the responsible for transportation to its final destination. Here, the responsible was not necessarily a person,
but a segment of the company.
The intermediate nodes were the governmental regulatory agencies (Brazilian Health Agency –
ANVISA; Ministry of Agriculture – MAPA; Federal Police) and private auditing agencies (Regulatory
agency; GLOBALGAP). Link is the tie between two or more nodes, which is represented by a straight line. The links adopted here were all connections between the orange juice supply chain interveners. The flow indicates the direction of the action between the interveners. Here, there were taken into account the flow of products, services and the payments involved in the identified interactions (Table 1). Data from 2005 to 2009 were organized showing the relationships between the interveners.
The values of the following network structural properties were compared: 1) density (the ratio of
all ties that are actually present to the number of
possible ties); 2) degree of centrality (which refers
to the amount of immediate ties the intervener has
within the network, %); 3) clustering coefficient (which refers to the average of the densities of the neighborhoods of all interveners; 4) node (which is
the same as element or intervener); and 5) geodesic
distance (which is the length of the shortest path between the interveners). The higher the weight is
given to the relationship the better the interaction
is between interveners and the data flow is more reliable within the network/chain (HANNEMAN;
RIDDLE, 2005).
The analysis was carried out using the UCINET® 6 for Windows® software tool (UCINET,
2002; BORGATTI; LI, 2009) with the goal to
survey the interactions, to identify the interveners’ rules and their graphical structure; and to indicate
how the network chain is built. In this research, the structural measurements of network centrality, the identification of network subgroups, and analysis of roles were done using the theory of graphs in the
UCINET® software integrated module NETDRAW®,
which also enabled visualization of the network
graph data.
RESULTS AND DISCUSSION
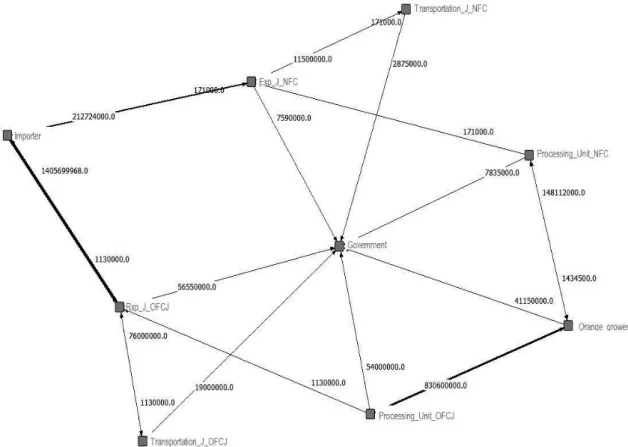
From the interactions between the interveners during all studied years it was found that the most powerful links are those connecting the exporter to the importer and the orange grower to the orange
processor, represented in Figure 2. Some interactions
overlapped generating a thicker line between the
interveners and indicating the increase in density;
and, therefore, making that link strategically more valuable. The numbers shown are the monetary values of the transactions, and the volume of juice
processed and transported. It is also enhanced the
role of the government which concentrates most of the actions that in this case are related to taxations and auditing. There are several ways to represent the network flow for the cash management, cash flow
in the food industry, and the interactions found in this research present the same array as those found by previous authors (AHUMADA; VILLALOBOS, 2009; PACHECO; MORABITO, 2011).
The visual analysis indicates that the
networks did not present significant changes in
their arrangement throughout the studied years. The slight changes are perceived in the most relevant
links of three interveners, orange grower, importer,
and processing unit. Further strengthening appears
in the relationship between the importer and exporter and, in second importance between the orange grower and the juice producer. The most influential nodes during the studied period are those shown in Table 2. Average distances were maintained relatively
constant in the period, and no change in the clustering
coefficient was found (Table 3), indicating that the network remained stable despite changes in the market. This is probably a result of the quota system adopted by importing/exporting countries (NEVES
et al., 2001).
Density values (10.4 to 11.9) presented steady increase from 2005 to 2008, indicating an
escalation in the network interveners’ organization
and creating a cohesive structure. In 2009, the
This generally occurs due to an external factor, and in this case, it was probably the consequence of the
2008 economic crisis. The relative inertia found in
the network density from 2005 to 2008 probably led to rearrangement of power. The orange grower,
although producing the basic commodity, is the third
intervener in importance, in the network.
From the studied network parameters, only
the density and the degree of centrality presented
changes (Figure 3). The degree of centrality, which
refers to the amount of immediate ties the intervener
has within the network presented an increase from the year of 2005 (10.4 %) until 2008 (11.9 %), while the homogeneity in the relationships between interveners
remained relatively constant, slightly decreasing on
2009 (11.7 %), again probably as a result of the world
economic crisis.
When the density is high, the strength of the
network ties is good, denoting that more information is exchanged from the interveners, which usually means worthy data flow (WASSERMAN; FAUST, 1994). The clustering coefficient (Equation 1) was defined as:
Ci = 2n/ki(ki – 1) (Eq. 1)
where n represents the number of direct links connecting the ki nearest intervener of nodei ; it is
equal to 1 for a node at the center of a fully interlinked
cluster, and it is equal to 0 for an intervener that is part of a loosely connected group. Therefore, Ci, the average over all nodesi of a network, is a measure
of the network’s potential modularity.
Orange juice production trend
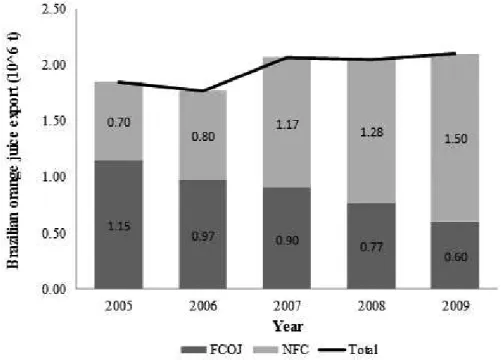
Another information from the studied data
was the decrease in export of frozen juice from 2007
(2.07 106 ton) to 2008 (2.05 106 ton) overlapping with
the beginning of the global financial crisis (Figure 4). In 2009, the orange juice industry presented a recovery exporting 2.10 million ton. In order to maintain trust and reduce the risk, companies in
charge of the actions such as transportation and
production either merged or were bought, resulting in a large company that practically own all segments
of the process (NEVES et al., 2001). This agrees
with CHURCHILL; PETER (2000) who support the
need of strategic alliances for technology sharing in the developing of companies. When not relying in their suppliers, companies choose to concentrate
their actions and reduce their eventual threat with
merging actions (CHURCHILL; PETER, 2000; CHRISTOPHER, 2003).
Worldwide the supply chain of food products
are currently under public debate, and better informed consumers need to ensure products quality.
This movement is usually followed by additional regulations and market driven standards that will affect the performance of a complex supply chain. This difficulty is upraised when the supply chain
encompasses international trade (AHUMADA; VILLALOBOS, 2009). Thus, the concentration of
actions and management of some interveners within
the supply chain might seem to determine the best
strategies to accommodate the new global market
conditions (BERCK et al., 2008; ABEBE et al., 2010; LEE et al., 2010).
As the demand for higher quality orange
juice has increased, studies have been undertaken to identify flavor changes produced in the preparation of various juice types and how to avoid or minimize them (ARENA et al., 2006; PEREZ-CACHO; ROUSEFF, 2008). Selected volatiles from pasteurized, not from concentrate, NFC, orange juices were not noticeably different from those of fresh juice. Freshly extracted and commercial unpasteurized juices contain larger
amounts of volatile aroma compounds than RFC
(twice heated) juices, which may compromise quality. For instance, fresh unpasteurized juice
contained 11 to 53 times more acetaldehyde than the
RFC juices (PEREZ-CACHO; ROUSEFF, 2008). From the studied data, it was also possible to identify a new trend in export. Since 2004, there has been a significant increase in the preference of market
from the OFCJ to the NFC (not from concentrated),
and nowadays the NFC market represents nearly 50% of all Brazilian export (Figure 4). As it is more economical to ship a concentrated juice and add water at the destination, than shipping juice with all its natural water content, the export of orange juice
implied in more structural investments. Within this
new scenario, it is clear that Brazil is increasing the export of water in the orange juice, which upsurges
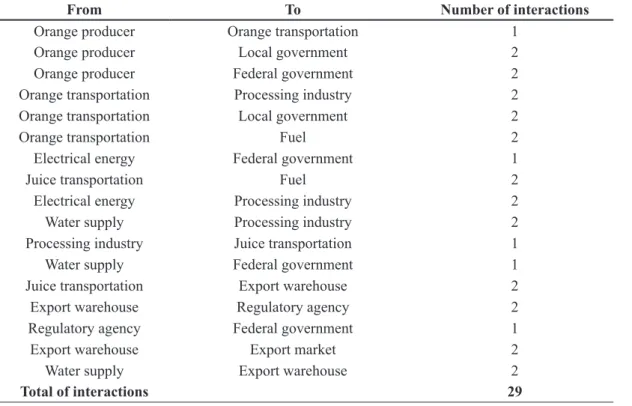
TABLE 1- Interactions between interveners within the network that describes the simplified Brazilian
supply chain of orange juice.
From To Number of interactions
Orange producer Orange transportation 1
Orange producer Local government 2
Orange producer Federal government 2
Orange transportation Processing industry 2
Orange transportation Local government 2
Orange transportation Fuel 2
Electrical energy Federal government 1
Juice transportation Fuel 2
Electrical energy Processing industry 2
Water supply Processing industry 2
Processing industry Juice transportation 1
Water supply Federal government 1
Juice transportation Export warehouse 2
Export warehouse Regulatory agency 2
Regulatory agency Federal government 1
Export warehouse Export market 2
Water supply Export warehouse 2
Total of interactions 29
TABLE 2 - Classification of the interveners’ importance within the orange juice network from 2005 to
2009.
Year 1st intervener 2nd intervener 3rd intervener 4th intervener 5th intervener
2005-2009 Juice exporter Government Orange grower Juice carrier Importer
TABLE 3- Summary of network output data from 2005 to 2009
Year Geodesic distance Density (106) Clustering coefficient (106) Degree of centrality (%)
2005 2.1 25.7 8.6 10.4
2006 2.1 29.9 8.6 11.0
2007 2.1 40.3 8.6 11.5
2008 2.1 35.7 8.6 11.9
2009 2.1 32.0 8.6 11.7
FIGURE 2 - NETDRAW®’ structural drawing output of the Brazilian orange juice network in the year
2009.
FIGURE 3- Network parameters of density and centrality of the interveners’ relationships in the orange
CONCLUSIONS
When analyzing the orange juice production chain, the interveners, which seemed to be independent business partners were, in fact, highly compromised with the processing industry. Although the network shows distinct interveners interfacing from the fruit production to the export companies, most of them
are directly connected to the processing company transforming the chain into a business vertical structure. Since 2004, there has been an increase
of nearly 10% per year in the market preference from the concentrate juice (OFCJ) to the “not from concentrated” juice (NFC), and nowadays the NFC market represents nearly 50% of all Brazilian export which impacted in the logistic distribution and
transportation issues.
REFERENCES
ABEBE, M.; ANGRIAWAN, A.; TRAN, H. Chief
executive external network ties and environmental scanning activities: an empirical examination.
Strategic Management Review, Dallas, v. 4, n. 1, p. 30-43, 2010.
ABECITRUS - Associação Brasileira dos Exporta -dores de sucos cítricos. Relatório Abecitrus 2007.
Disponível em: <http//www.abecitrus.com.br>.
Acesso em: 15 dec. 2010.
ARENA, E. et al. Comparison of odour active com-pounds detected by
gas-chromatography-olfactom-etry between hand-squeezed juices from different
orange varieties. Food Chemistry, Amsterdam, v. 98, n.1, p.59–63, 2006.
AHUMADA, O.; VILLALOBOS, J.R. Application of planning models in the agri-food supply chain:
A review. European Journal of Operational Re-search, Amsterdam, v. 196, n. 1, p. 1–20, 2009.
BERCK, P.; BROWN, J.; PERLOFF, J.M.; VILLAS-BOAS, S.B. SALES: Tests of theories on causality and timing. International Journal of Industrial Organization, Amsterdam, v. 26, n. 6, p. 1257–1273, 2008.
FIGURE 4 - Brazilian orange juice concentrated (FCOJ) and fresh (NFC) export data from 2005 to 2009.
BORGATTI, S.P.; LI, X. On social network analysis in a supply chain context. Journal of Supply Chain Management,Temple, v. 45, n. 2, p. 5–22, 2009.
BRAT, P. et al. Distribution of volatile compounds in
the pulp, cloud, and serum of freshly squeezed orange juice. Journal of Agricultural and Food Chemis-try, Columbus, v.51, n.11, p.3442–3447, 2003.
CARPENTER, M.A.; WESTPHAL, J.D. The
stra-tegic context of external network ties: Examining
the impact of board appointments on director
in-volvement in strategic decision making. Academy of Management Journal, New York, v.44, n. 2, p.
639–660, 2001.
CHRISTOPHER, M. Logística e gerenciamento da cadeia de suprimentos: Estratégia para redução de custos e melhoria dos serviços. São Paulo: Pio-neira, 2003. 488p.
CHURCHILL, G.A.J.R.; PETER, J.P. Marketing:
criando valor para os clientes. 2. ed. São Paulo: Saraiva, 2000. 626p.
CRANDALL, P.G.; CHEN, C.S.; DAVIS, K.C.
Preparation and storage of 72° Brix orange juice
concentrate. Journal of Food Science, Chicago, v.52, n. 2, p. 381–385, 1987.
DESER - Departamento de Estudos Sócio-Econômi-cos e Rurais. A cadeia produtiva da laranja - estu-dos exploratórios. Curitiba. 2007. Disponível em:
<http://www.deser.org.br/pub_read.asp?id=112>. Acesso em: 12 dez. 2011.
HANNEMAN R.; RIDDLE M. Introduction to social network methods. 2005. Disponível em:
http://faculty.ucr.edu/~hanneman/nettext/introduc
-tion_to_social_network_methods.pdf. Acesso em:
3 mar. 2010.
LEE, H.L.; BILLINGTON, C. Material
manage-ment in decentralized supply chain. Operational Research, New York, v.41, n.5, p. 835-847, 1993.
LEE, J-Y.; GAO, Z.; BROWN, M.G. A study of the impact of package changes on orange juice demand.
Journal of Retailing and Consumer Services, Amsterdam, v.17, n. 6, p. 487–491, 2010.
NEVES, E. M. et al. Citricultura brasileira:
efei-tos econômico-financeiros, 1996 - 2000. Revista Brasileira de Fruticultura, Jaboticabal, v.23, n.2, p. 432-436, 2001.
PACHECO, J.V.A.; MORABITO, R. Application of
network flow models for the cash management of an
agribusiness company. Computers & Industrial En-gineering, Amsterdam, v. 61, n. 3, p. 848–857, 2011.
PEREZ-CACHO, P.R., ROUSEFF, R. Processing and storage effects on orange juice aroma: A review.
Journal of Agricultural and Food Chemistry, Columbus, v.56, n. 21, p. 9785–9796, 2008.
RICHARDSON, A.J. Regulatory networks for ac
-counting and auditing standards: A social network
analysis of Canadian and international standard-setting. Accounting, Organizations and Society, Amsterdam, v. 34, n. 5, p. 571-588, 2009.
SCOTT, J. Social network analysis: A handbook. 2.ed. London: Sage Publications, 2000. 208p.
SHAW, P.E.; BUSLIG, B.S.; MOSHONAS, M.G.
Classification of commercial orange juice types by
pattern recognition involving volatile constituents
quantified by gas chromatography. Journal of Ag-ricultural and Food Chemistry, Columbus, v. 41, n. 5, p. 809–813, 1993.
TICHY, N.M.; TUSHMAN, M.L.; FOMBRUN, C.
Social network analysis for organizations. Academy of Management Journal, New York, v. 4, n. 2,
p.507-519, 1979.
UCINET. Ucinet 6 for Windows: software for social
network analysis. Massachusetts: Analytic Technolo -gies, 2002.
USDA - United States Department of Agriculture.
USDA Report 2009. Disponível em: <http://www.
fas.usda.gov/htp/2009_Citrus.pdf>. Acesso em: 20 dec. 2010.