Submitted 13 February 2015 Accepted 8 July 2015 Published4 August 2015 Corresponding author Tim Vines, [email protected]
Academic editor Claus Wilke
Additional Information and Declarations can be found on page 16
DOI10.7717/peerj.1137 Copyright
2015 Andrew et al.
Distributed under
Creative Commons CC-BY 3.0
OPEN ACCESS
Assessing the reproducibility of
discriminant function analyses
Rose L. Andrew1,2, Arianne Y.K. Albert3, Sebastien Renaut2,4,
Diana J. Rennison2, Dan G. Bock2and Tim Vines2,5
1School of Environmental and Rural Science, University of New England, Armidale, NSW,
Australia
2Biodiversity Research Centre, University of British Columbia, Vancouver, BC, Canada 3Women’s Health Research Institute, BC Women’s Hospital and Health Centre, Vancouver, BC,
Canada
4Institut de recherche en biologie v´eg´etale, D´epartement de sciences biologiques, Universit´e de
Montr´eal, Montreal, QC, Canada
5Molecular Ecology Editorial Office, Vancouver, BC, Canada
ABSTRACT
Data are the foundation of empirical research, yet all too often the datasets underlying published papers are unavailable, incorrect, or poorly curated. This is a serious issue, because future researchers are then unable to validate published results or reuse data to explore new ideas and hypotheses. Even if data files are securely stored and accessible, they must also be accompanied by accurate labels and identifiers. To assess how often problems with metadata or data curation affect the reproducibility of published results, we attempted to reproduce Discriminant Function Analyses (DFAs) from the field of organismal biology. DFA is a commonly used statistical analysis that has changed little since its inception almost eight decades ago, and therefore provides an opportunity to test reproducibility among datasets of varying ages. Out of 100 papers we initially surveyed, fourteen were excluded because they did not present the common types of quantitative result from their DFA or gave insufficient details of their DFA. Of the remaining 86 datasets, there were 15 cases for which we were unable to confidently relate the dataset we received to the one used in the published analysis. The reasons ranged from incomprehensible or absent variable labels, the DFA being performed on an unspecified subset of the data, or the dataset we received being incomplete. We focused on reproducing three common summary statistics from DFAs: the percent variance explained, the percentage correctly assigned and the largest discriminant function coefficient. The reproducibility of the first two was fairly high (20 of 26, and 44 of 60 datasets, respectively), whereas our success rate with the discriminant function coefficients was lower (15 of 26 datasets). When considering all three summary statistics, we were able to completely reproduce 46 (65%) of 71 datasets. While our results show that a majority of studies are reproducible, they highlight the fact that many studies still are not the carefully curated research that the scientific community and public expects.
Subjects Evolutionary Studies, Plant Science, Zoology, Science Policy, Statistics Keywords Data curation, Repeatability, Data archiving, Statistics
How to cite this articleAndrew et al. (2015), Assessing the reproducibility of discriminant function analyses.PeerJ 3:e1137;
INTRODUCTION
Published literature is the foundation for future research, so it is important that the results reported in scientific papers be supported by the underlying data. After all, we cannot easily predict which aspects of a paper will prove useful in the future (Wolkovich, Regetz & O’Connor, 2012), and if a portion of the results are wrong or misleading then subsequent research effort may well be wasted (e.g.,Begley & Ellis, 2012). One relatively simple way to judge the validity of published research is to obtain the original data analyzed in the paper and attempt to repeat some or all of the analyses: this allows researchers to retrace the path the authors took between the raw data and their results. Reproducibility in research is of growing interest and has recently gained traction with journals (Announcement: Reducing our irreproducibility, 2013;McNutt, 2014). There is clearly a need to quantify the validity of published research, yet there have been only a modest number of published studies that have tried to reproduce the results of published papers (e.g.,Ioannidis et al., 2009;Gilbert et al., 2012;Errington et al., 2014), most likely because it is often difficult to access the under-lying data (Wicherts et al., 2006;Savage & Vickers, 2009;Drew et al., 2013;Vines et al., 2013).
Even when the data file is available, one common problem that hampers reanalysis is poor data curation: it is sometimes difficult to relate the dataset provided by the authors upon request or archived at publication to the one described in the paper (Michener et al., 1997;Ioannidis et al., 2009;Gilbert et al., 2012). For example, variable names may differ between the obtained dataset and the one described in the study, or there may be differences in the number of variables or data points (seeWhite et al., 2013). It is typically not possible to reproduce the authors’ analyses in these cases, and moreover the data may not be considered sufficiently reliable for testing new hypotheses.
The current study had two goals: to assess (a) how often poor data curation prevented re-analysis, and (b) how often we could reproduce authors’ results when the obtained dataset did match the one described in the paper. We made use of 100 datasets acquired from authors as part of an earlier study assessing the effect of time since publication on data availability (Vines et al., 2014). The articles we chose had to (i) contain morphometric data from plants or animals, (ii) have analysed the morphometric data with a Discriminant Function Analysis (DFA), and (iii) have not previously made the data available online. To make our study manageable in size, we selected only articles published in odd years (between 1991 and 2011), as detailed inVines et al. (2014).
We focused on morphometric data because it has been collected in a similar fashion for decades (e.g., with Vernier callipers or a binocular microscope), so datasets from a range of time periods are expected to be similar in size and format. We used similar logic when selecting the analysis to reproduce: Discriminant Function Analysis (Fisher, 1936) has been applied to morphometric datasets for many decades. The function gives the best linear combination of morphometric variables that distinguishes between two or more known groups (e.g., sexes, populations, species). Typically, a sample of individuals with known affiliations is used to find the minimum set of variables that distinguishes the groups, and a discriminant function composed of the chosen variables is then used to classify unknown individuals. While computer processing power has greatly increased over the years, the way
the analysis has been performed has remained the same. We can therefore reasonably compare DFAs from papers with a wide range of publication dates, allowing us to investigate how changing analysis software or date of publication affect reproducibility. In combination with (Vines et al., 2014), our results quantify the extent of the challenges fac-ing science publication, both in terms of acquirfac-ing the original data analysed in the paper, and in terms of the proportion of analyses that are poorly curated or cannot be reproduced.
MATERIALS AND METHODS
As part of theVines et al. (2014)study, we received 100 datasets from authors. For papers reporting a classical DFA of morphometric data, linear or quadratic DFA were considered, as were stepwise analyses where (a) the variables in the final model were presented and (b) at least one of three common metrics (see below) was presented. This allowed us to attempt to reproduce the final model as a simple linear DFA. Studies employing stepwise analysis of relative warps or Fourier-transformed data were also excluded at this point, as these studies unfortunately did not indicate which variables were included in the final model. A study entirely written in a foreign language (Spanish) was also excluded.
For each remaining study, we followed the protocol below.
(1) We first assessed the description of the methodology, checking whether the paper adequately described the groupings and morphometric variables used in the analysis. (2) We examined the data files (in some cases multiple files were supplied), which
sometimes required specialised file formats to be converted to text. This was carried out using the R packages ‘foreign’ (R Core Team, 2014) and ‘RODBC’ (Ripley & Lapsley, 2013). If the data file was clearly wrong (e.g., a summary table, instead of raw data) we categorized the paper as ‘Incorrect data file.’
(3) We assessed whether the metadata contained in the data file, in other files supplied by the author or in the accompanying email were complete and could be related to their description in the paper. We classified papers missing sample or variable names and those with unclear population groupings as having ‘Insufficient metadata.’ This category also included papers for which variable labels were in a foreign language and, even when translated in English (usinghttp://translate.google.ca), could not be matched to the variables reported in the paper. However, we accepted files with unlabeled data columns where the identity of each column could be verified using information in the paper or supplied by the authors; the latter information came either from the files provided or their email message.
(4) We then went through the data deleting rows that contained missing data or other sam-ples that the paper stated were not included in the analysis. Once this was completed, we identified discrepancies between the paper and the dataset in terms of sample sizes or number of variables, and categorized papers for which variables were missing or for which sample sizes did not match those reported in the paper as ‘Data discrepancy.’ (5) In addition to simple transformations (logarithm or square root), we conducted size
adjustments based on multigroup principal components analysis (e.g.,Burnaby’s
(1966) back-projection) using theRpackages ‘multigroup’ (Eslami et al., 2014) and ‘cpcbp’ (Bolker & Phillips, 2012).
(6) When there was more than one DFA analysis that met our criteria in a paper, we selected only the first one. We recorded whether raw or standardised coefficients were presented, whether cross-validation was used in the classification of individuals, and the statistical software used. The year of publication was recorded for each paper.
Based on a preliminary survey of the papers, we identified three DFA metrics to reproduce: the percentage of variance explained (PVE), the percentage of samples assigned correctly (PAC), and the largest model coefficient. These three summary statistics are commonly reported for DFAs, and are useful for interpreting DFA in a meaningful manner (Reyment, Blackith & Campbell, 1984), although the detail in which DFAs are described varies greatly depending on the focus of the paper. PVE and PAC are complementary indicators of the discriminatory power of a discriminant function, whereas the function coefficients make up the formula for assigning unknown samples to one group or another.
Our reanalysis procedure was designed to produce a single value for each metric per paper. Where possible, we compared the PVE for the first axis, which explains the greatest amount of variance in the model. When PVE was reported as the sum of the first two or three axes, we compared the summed PVE. We calculated the overall PAC, or the PAC for a particular group if the overall percent assigned correctly was not reported in the paper. For the coefficient, we selected the variable with the largest absolute coefficient, and determined from the paper whether the raw or standardised coefficient was used.
Although the original analyses used diverse statistical packages, we performed all discriminant function reanalyses in the statistical software R v3.2.0 (R Core Development Team, 2011), using the function ‘lda’ (in the MASS package;Venables & Ripley, 2002) with default parameters. Within R, we estimated each summary statistic using proportional or flat priors and used the value that was closest to the published value. Authors reported a variety of methods for assignment when calculating PAC, ranging from standard classification functions based on all data, to omitting one quarter of the data as a validation set. In our reanalysis, classification was carried out using leave-one-out (jackknife) cross-validation or direct prediction in ‘lda’, based on the description of the analysis in the paper. When authors did not specify whether cross-validation or direct prediction was used, we performed both and selected the value that was closest to the published result. While this approach biases the results towards the published value, it avoids unfair treatment of studies that used default parameters for their chosen software.
Our R code is provided in theSupplemental Information 1, along with example datasets fromGugerli, 1997,Berzins, Gilchrist & Burness (2009a),Berzins, Gilchrist & Burness (2009b)andDechaume-Moncharmont, Monceau & Cezilly (2011). We considered the anal-ysis to have been reproduced if the PVE, coefficient, or PAC was within 1% of the published value (termed ‘matched’), or was ‘close’ if it was within 5% of the published value.
We used generalised linear models (the core ‘glm’ function in R) to assess whether publication year affected the likelihood of problems in the data sets that would prevent
Table 1 Summary of papers excluded from or included in the study, in total and listed by the statistical software originally used to analyse the data.Those included in the study are further broken down by the reasons that reanalysis was not attempted or by the results of the reanalysis. The reanalysis outcome was classified as a complete match when all reanalyzed summary statistics were within 1% of the published values, a partial match when at least one (but not all) met this criterion, and no match when none met this criterion. The metrics considered were PVE, a discriminant function coefficient, and PAC.
Software Excluded Included Incorrect data file
Insufficient metadata
Data discrepancy
No match Reanalysed partial match
Complete match
TOTAL 14 86 2 (2.3%) 7 (8.1%) 7 (8.1%) 12 (14%) 46 (53.5%) 12 (14%)
JMP 2 2 0 (0%) 1 (50%) 0 (0%) 0 (0%) 0 (0%) 1 (50%)
MATLAB 1 2 0 (0%) 0 (0%) 1 (50%) 0 (0%) 0 (0%) 1 (50%)
R 0 5 2 (40%) 0 (0%) 1 (20%) 1 (20%) 0 (0%) 1 (20%)
SAS 1 15 0 (0%) 3 (20%) 2 (13%) 3 (20%) 2 (13%) 5 (33%)
SPSS 6 30 0 (0%) 0 (0%) 2 (7%) 5 (17%) 6 (20%) 17 (57%)
STATISTICA 0 9 0 (0%) 1 (11%) 1 (11%) 2 (22%) 0 (0%) 5 (56%)
SYSTAT 0 8 0 (0%) 0 (0%) 0 (0%) 1 (12%) 2 (25%) 5 (62%)
Other 1 2 0 (0%) 1 (50%) 0 (0%) 0 (0%) 0 (0%) 1 (50%)
Unknown 3 13 0 (0%) 1 (8%) 0 (0%) 0 (0%) 2 (15%) 10 (77%)
attempts to reproduce the DFA results. Given a binomial model, we tested the effect of publication year on categorizing a study as ‘Insufficient metadata’ or ‘Data discrepancy’ (see points 3–4 above for category descriptions). A Fisher’s exact test was used to test the effect of statistical software on data problems and on the success of the reanalysis. We combined software used in just one study (S-Plus, STATGRAPHICS, and LINDA (Cavalcanti, 1999)) into a single category (“other”).
Although we contacted authors again to ask for their preferences regarding acknowl-edgment or anonymity, we did not seek further information (e.g., metadata or analysis parameters) to inform our reanalysis. We also note that we are unfortunately unable to provide all 100 of the datasets reanalysed here, in an attempt to make this study reproducible: the email sent byVines et al. (2014)requesting these datasets stated ”Our analysis will not identify individual studies, but will instead focus on overall patterns and trends. Your responses will therefore be completely confidential.” Obtaining additional permission to make all datasets public alongside this paper would be very challenging, as evidenced by the 66% response rate to our email merely asking authors how they would prefer their work to be cited.
RESULTS
The current study used 100 data sets originally gathered byVines et al. (2014). Fourteen of those data sets were excluded from our reanalysis attempt (Tables 1and2): one paper was entirely in a language other than English (Spanish); two did not perform classical DFA; two used non-morphological data in their DFA; six did not present any of the metrics that we were attempting to reproduce; and three were based on stepwise analysis for which the final set of Fourier-transformed variables or relative warps were not specified.
Of the 86 remaining studies, the data files provided for two (2.3%) were classified as ‘Incorrect data file’: summary tables were provided instead of morphometric data,
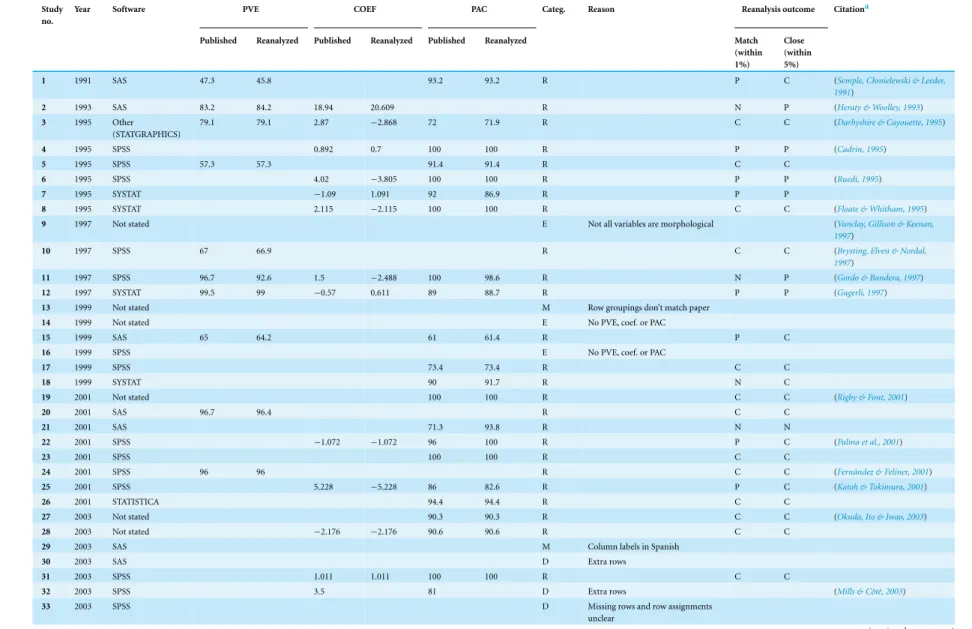
Table 2 Published results and reanalyzed values of DFAs based on data files received from authors.DFAs included in the current study were categorized according to the adequacy of data files and metadata, and the reproducibility of three metrics (percent variance explained, the largest coefficient and percent assigned correctly) among those that were able to be reanalyzed. Category indicates whether the data set was excluded from the study (E), was incorrect (I), had inadequate metadata (M), displayed data discrepancies (D) or was reanalysed (R). The reasons for excluding data sets from the study or preventing us from reanalyzing the data are summarized. The reanalysis outcome was classified as a complete match (C) when all reanalyzed summary statistics were within 1% of the published values, a partial match (P) when at least one (but not all) met this criterion, and no match (N) when none met this criterion. The same classification was applied to studies using the ‘close’ criterion (within 5%).
Study no.
Year Software PVE COEF PAC Categ. Reason Reanalysis outcome Citationa
Published Reanalyzed Published Reanalyzed Published Reanalyzed Match (within 1%)
Close (within 5%)
1 1991 SAS 47.3 45.8 93.2 93.2 R P C (Semple, Chmielewski & Leeder,
1991)
2 1993 SAS 83.2 84.2 18.94 20.609 R N P (Heraty & Woolley, 1993)
3 1995 Other
(STATGRAPHICS)
79.1 79.1 2.87 −2.868 72 71.9 R C C (Darbyshire & Cayouette, 1995)
4 1995 SPSS 0.892 0.7 100 100 R P P (Cadrin, 1995)
5 1995 SPSS 57.3 57.3 91.4 91.4 R C C
6 1995 SPSS 4.02 −3.805 100 100 R P P (Ruedi, 1995)
7 1995 SYSTAT −1.09 1.091 92 86.9 R P P
8 1995 SYSTAT 2.115 −2.115 100 100 R C C (Floate & Whitham, 1995)
9 1997 Not stated E Not all variables are morphological (Vanclay, Gillison & Keenan,
1997)
10 1997 SPSS 67 66.9 R C C (Brysting, Elven & Nordal,
1997)
11 1997 SPSS 96.7 92.6 1.5 −2.488 100 98.6 R N P (Gordo & Bandera, 1997)
12 1997 SYSTAT 99.5 99 −0.57 0.611 89 88.7 R P P (Gugerli, 1997)
13 1999 Not stated M Row groupings don’t match paper
14 1999 Not stated E No PVE, coef. or PAC
15 1999 SAS 65 64.2 61 61.4 R P C
16 1999 SPSS E No PVE, coef. or PAC
17 1999 SPSS 73.4 73.4 R C C
18 1999 SYSTAT 90 91.7 R N C
19 2001 Not stated 100 100 R C C (Rigby & Font, 2001)
20 2001 SAS 96.7 96.4 R C C
21 2001 SAS 71.3 93.8 R N N
22 2001 SPSS −1.072 −1.072 96 100 R P C (Palma et al., 2001)
23 2001 SPSS 100 100 R C C
24 2001 SPSS 96 96 R C C (Fern´andez & Feliner, 2001)
25 2001 SPSS 5.228 −5.228 86 82.6 R P C (Katoh & Tokimura, 2001)
26 2001 STATISTICA 94.4 94.4 R C C
27 2003 Not stated 90.3 90.3 R C C (Okuda, Ito & Iwao, 2003)
28 2003 Not stated −2.176 −2.176 90.6 90.6 R C C
29 2003 SAS M Column labels in Spanish
30 2003 SAS D Extra rows
31 2003 SPSS 1.011 1.011 100 100 R C C
32 2003 SPSS 3.5 81 D Extra rows (Mills & Cˆot´e, 2003)
33 2003 SPSS D Missing rows and row assignments
unclear
(continued on next page)
Table 2 (continued)
Study no.
Year Software PVE COEF PAC Categ. Reason Reanalysis outcome Citationa
Published Reanalyzed Published Reanalyzed Published Reanalyzed Match (within 1%)
Close (within 5%)
34 2003 SPSS 88.9 87.5 R N C
35 2003 SPSS 0.772 0.766 84.3 84.3 R C C
36 2003 STATISTICA M Column labels unclear
37 2003 SYSTAT 1.28 −1.275 81 80.6 R C C (Wicht et al., 2003)
38 2005 JMP E No PVE, coef or PAC (Nishida, Naiki & Nishida,
2005)
39 2005 Not stated 79.9 79.7 R C C (Hendriks, Van Duren &
Herman, 2005)
40 2005 Not stated 83 83.1 73 74.3 R P C
41 2005 Not stated 100 100 R C C (Radloffet al., 2005)
42 2005 Other (S-Plus) E No PVE, coef or PAC
43 2005 Other (LINDA) M Unclear groups (Contrafatto, 2005)
44 2005 SAS M Column labels missing (Zaitoun, Tabbaa & Bdour,
2005)
45 2005 SAS 94.3 94.9 R C C (Marhold et al., 2005)
46 2005 SPSS 46 38.2 R N N (Aparicio et al., 2005)
47 2005 SPSS 55.1 55.6 0.352 0.779 71.8 70.3 R P P
48 2005 STATISTICA 67.5 67 R C C
49 2005 STATISTICA 97 98.8 R N C
50 2005 SYSTAT 100 100 R C C
51 2007 MATLAB D Missing columns and insufficient
metadata
52 2007 Not stated 1.1 1.097 97 96.6 R C C (Svagelj & Quintana, 2007)
53 2007 Not stated 87.9 87.9 R C C (De la Hera, P´erez-Tris &
Telleria, 2007)
54 2007 SAS 8.623 3.495 97.3 98.6 R N P
55 2007 SAS 76 76.6 R C C (Williams, Dean Kildaw & Loren
Buck, 2007)
56 2007 SAS D Missing columns (Pearce, Fields & Kurita, 2007)
57 2007 SPSS E No PVE, coef or PAC
58 2007 SPSS 76.9 76.9 R C C (Rioux-Paquette & Lapointe,
2007)
59 2007 SPSS 0.689 0.647 100 85.4 R N N (Santiago-Alarcon & Parker,
2007)
60 2007 SPSS 61.8 61.6 R C C
(continued on next page)
Andre
w
et
al.
(2015),
P
eerJ
,
DOI
10.7717/peerj.1137
Table 2 (continued)
Study no.
Year Software PVE COEF PAC Categ. Reason Reanalysis outcome Citationa
Published Reanalyzed Published Reanalyzed Published Reanalyzed Match (within 1%)
Close (within 5%)
61 2007 SPSS E Final model not given (Conde-Pad´ın, Grahame &
Rol´an-Alvarez, 2007)
62 2007 SPSS 84 83.3 R C C
63 2007 STATISTICA 96.1 96.2 R C C
64 2007 STATISTICA 93.3 93.3 −0.951 −0.951 89.2 89.2 R C C
65 2007 STATISTICA 1.68 1.678 83.7 83.7 R C C (Bourgeois et al., 2007)
66 2007 SYSTAT 90.4 90.4 90 90 R C C
67 2009 Not stated 91.2 91.2 R C C
68 2009 Not stated E Not DFA
69 2009 Not stated 40.8 41.1 79 78.3 R C C (Hermida et al., 2009)
70 2009 Not stated 0.242 0.084 100 100 R P P (Buczk´o, Wojtal & Jahn, 2009)
71 2009 SAS 69 69.2 1.05 −1.053 R C C (P´erez-Farrera et al., 2009)
72 2009 SAS 0.95 0.604 80 80 R P P
73 2009 SPSS 100 100 R C C
74 2009 SPSS E Data not morphological
75 2009 SPSS 76.4 77 R C C (Thorogood, Brunton & Castro,
2009)
76 2009 STATISTICA D Missing rows
77 2009 STATISTICA 100 98.1 R N C
78 2009 SYSTAT 2.8 2.795 91 91.5 R C C (Berzins, Gilchrist & Burness,
2009a)
79 2011 JMP E No PVE, coef or PAC (Hata et al., 2011)
80 2011 JMP M Column labels unclear
81 2011 JMP −7.06 7.063 100 100 R C C (Gabrielson, Miller & Martone,
2011)
82 2011 MATLAB 65.5 65 R C C (Salcedo et al., 2011)
83 2011 MATLAB E Not classical DFA (Capoccioni et al., 2011)
84 2011 Not stated 90 90.5 R C C (Russell et al., 2011)
85 2011 R D Missing rows
86 2011 R I Wrong file
87 2011 R I Wrong file
88 2011 R 58 88.3 56 57.1 R N P
89 2011 R 80.4 80.4 R C C (Dechaume-Moncharmont,
Monceau & Cezilly, 2011) (continued on next page)
Andre
w
et
al.
(2015),
P
eerJ
,
DOI
10.7717/peerj.1137
Table 2 (continued)
Study no.
Year Software PVE COEF PAC Categ. Reason Reanalysis outcome Citationa
Published Reanalyzed Published Reanalyzed Published Reanalyzed Match (within 1%)
Close (within 5%)
90 2011 SAS E Spanish
91 2011 SAS 100 100 R C C (Parent, Plourde & Turgeon,
2011)
92 2011 SPSS 81.8 81.7 R C C (Forster, Ladd & Bonser, 2010)
93 2011 SPSS 97.7 97.7 87.5 87.5 R C C (Amado et al., 2011)
94 2011 SPSS 58.3 58.3 62.9 62.9 R C C (Ib´a˜nez & O’Higgins, 2011)
95 2011 SPSS 87.7 87.5 R C C
96 2011 SPSS E Final model not given
97 2011 SPSS E Final model not given (Asanidze, Akhalkatsi &
Gvritishvili, 2011)
98 2011 SPSS 100 100 R C C
99 2011 SPSS 95.7 93.9 R N C
100 2011 SPSS 96 89.7 1.202 0.068 100 100 R P P
Notes.
a Authors were contacted individually once reanalyses were performed. Only authors wishing to be identified are cited above. In addition, several authors agreed to be cited, but not identified directly (Amini, Zamini & Ahmadi, 2007;Audisio et al., 2001;
Bulgarella et al., 2007;Ekrt et al., 2009;Foggi, Rossi & Signorini, 1999;Ginoris et al., 2007;Gouws, Stewart & Reavell, 2001;L´opez-Gonz´alez et al., 2001;Magud, Stanisavljevi´c & Petanovi´c, 2007;Malenke, Johnson & Clayton, 2009;Schagerl & Kerschbaumer, 2009;Wasowicz & Rostanski, 2009).
Andre
w
et
al.
(2015),
P
eerJ
,
DOI
10.7717/peerj.1137
Figure 1 Summary of the reproducibility of the 71 reanalyzed data sets and of the problems prevent-ing reanalysis of 15 papers (seeTable 1).
or the data set provided was used for a different analysis from the same paper (Fig. 1,
Table 1). Six others (7.0%) were categorized as ‘Insufficient metadata’, as columns in the
data files could not be matched to the variables described in the paper. Assignment as ‘Insufficient metadata’ was due to a combination of incomprehensible abbreviations in column headings (studies #36 and #80 inTable 2), missing column labels (#44), unclear row groupings (#13 and #43) and the use of a language other than English (study #29 in
Table 2). Seven were classified as ‘Data discrepancy’: five data sets (5.8%) did not match the
expected sample sizes, and two (2.3%) were missing variables.
We found no effect of publication year on the probability of having ‘Insufficient metadata’ (odds ratio 0.98 (95%CI [0.84–1.15]),P=0.82) and no effect of year on the probability of incorrect or inconsistent data (‘Data discrepancy’ or ‘Incorrect data’: odds ratio 1.06 (95%CI [0.90–1.26]),P=0.45). Combining these main types of data problems that prevented us from attempting reanalysis (‘Incorrect data file,’ ‘Insufficient metadata,’ ‘Data discrepancy’), there was no effect of year (odds ratio 1.06 (95%CI [0.95–1.20]), P=0.28).
Where stated, the type of software (SAS®(SAS Institute, Cary, North Carolina, USA), SYSTAT (SYSTAT Software Inc., Richmond, California, USA), SPSS (SPSS Inc., Chicago, Illinois, USA), MATLAB (Mathworks, Natick, Massachusetts, USA), STATISTICA (Stat-soft, Tulsa, Oklahoma, USA), JMP (SAS Institute, Cary, North Carolina, USA), R (R Core Development Team, 2011), S-Plus®(TIBCO Software Inc., Palo Alto, California, USA), STATGRAPHICS (StatPoint Inc., Rockville, Maryland, USA) and LINDA (Cavalcanti, 1999)) used for the initial study had a significant effect on the probability of data problems (Fisher’s exact test,P=0.012). This was largely due to a high likelihood of
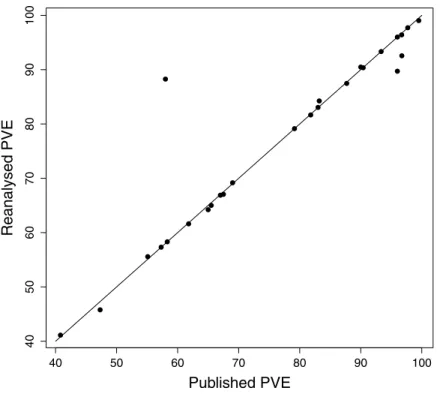
Figure 2 PVE values from reanalysis versus published DFA. Points on the 1:1 line represent analyses differing by 1% or less.
data problems (26.7%) among data sets originally analysed with SAS, compared with the overall proportion (17.4%; seeTable 1).
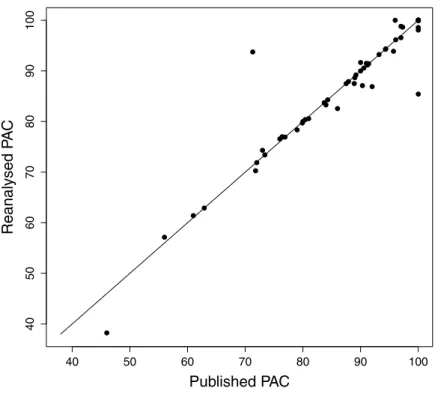
We attempted a reanalysis of the DFA for the remaining 71 studies, and the results are summarised inTable 2. Our results regarding the PVE were generally close to the published values (Pearson correlation coefficient,r=0.94,P<0.0001;Fig. 2). Of the 26 reanalysed data sets reporting this statistic, our reproduced value was within 1% of the published value in 20 cases (80%), and within 5% of the published value in 24 cases (92%). The PAC statistic was also often reproduced (Pearson’sr=0.95,P<0.0001;Fig. 3). Of 60 reanalyses of PAC attempted, our values differed from the published value by 1% or less in 44 (73%) cases, while 55 (93%) were within 5%. Discriminant function coefficients were reproduced less frequently in the reanalysis. Using the absolute value of the coefficient to exclude sign differences, reproduced values were within 5% of the published value for 15 (58%) of the 26 data sets reanalysed for this statistic, and each of these values was also within 1%. There was still a strong correlation between the published value and our estimate (using absolute values, Pearson’sr=0.96,P<0.0001;Fig. 4).
Of all 112 reanalysed PVE, PAC and coefficient values, 79 (71%) were within 1% of the published value, and 95 (85%) were within 5% (Table 2). Considering the reported summary statistics together for each paper, our reanalysis failed to replicate any value in the paper at the most stringent level (within 1%) in 12 studies (17% of the total 71 data sets;
Table 1); however, we were able to partially reproduce 13 (18%) studies and completely
Figure 3 PAC values from reanalysis versus published DFA. Points on the 1:1 line represent analyses differing by 1% or less.
Figure 4 Discriminant function coefficients from the reanalysis versus the published results.Absolute values are used because the signs of coefficients depends on the order of variables. Points on the 1:1 line represent analyses differing by 1% or less.
reproduce the results in 46 studies (65%). The reanalysed values were within 5% of the published value for all three statistics for 56 (79%) of studies.
There was no effect of publication year on discrepancies between the published and our values for PVE, coefficients or PAC (Fisher exact test,P>0.2 in each case). Sample sizes were sufficient for a reliable test of the software effect for PAC only and this effect was not significant (Fisher’s exact test,P=0.81). There was also no effect of software on the overall reanalysis success (Fisher’s exact test,P=0.81).
DISCUSSION
Confidence in scientific research is boosted when published results can be independently reproduced by other scientists (Price, 2011). Assuming that the raw data can be obtained (which is typically difficult, e.g.,Wicherts et al., 2006;Wicherts, Bakker & Molenaar, 2011;Vines et al., 2013;Vines et al., 2014), several obstacles still remain. First, poor data curation (e.g., unintelligible column headings or missing samples) or inadequate methods description can mean that the dataset obtained cannot be matched to the one described in the paper, preventing reanalysis at the outset. Second, even when the datasets do match, some aspects of the results may be inherently harder to reproduce than others, perhaps because there are multiple calculation methods for the same summary statistic, or because the calculation involves ‘random walk’ estimation (e.g.,Gilbert et al., 2012). By following recommended data sharing practices (e.g.,White et al., 2013), we can aim towards reproducible research, and re-usable datasets.
In this paper we attempted to reproduce the results of Discriminant Function Analyses (DFA) for 100 datasets from papers published between 1991 and 2011. In contrast to the striking decline in data availability over time (Vines et al., 2014), we found no evidence that the reproducibility of DFAs decreased with time since publication. There was also no relationship between publication year and the proportion of datasets with data problems that prevented reanalysis, or with the proportion of reproducible results.
We could not attempt reanalysis for 15 of the 86 eligible data sets because of obvious problems in the data file. These problems included the wrong data file being provided, missing data (individuals or variables), differences in the labels of variables between data files and published work, or unspecified subsetting of the data files prior to the analytical steps. While some of these problems could be solved through further communication with the authors, we wanted our study to reflect the long-term reusability of the data, when contacting the authors becomes increasingly difficult (Vines et al., 2014). Digital information is rapidly moving towards a more centralised online system (“the cloud,” Armbrust et al., 2010). Similarly, the responsibility for data preservation is being lifted from scientists to online repositories (e.g., Dryad (www.datadryad.org), figshare (www.figshare. com), NCBI (www.ncbi.nlm.nih.gov)). Given this paradigm shift, we recommend more attention be given to metadata quality and to the curation of the archived files (Michener et al., 1997). For instance, if data are size-adjusted or manipulated in other ways, both pre-and post-transformation data should be archived. Perhaps the most critical piece of infor-mation is the link between column labels in the data file and the variables described in the
paper. We were unable to determine the correct columns or rows for 7% of datasets. While we were able to convert all data files to text format, the loss of metadata may stem from this conversion (in one case, this had to be typed by hand, because data file provided was from a scanned hardcopy of the data in a MSc thesis appendix). In line with previous authors on this topic (Borer et al., 2009;Whitlock, 2011), we recommend storing data in text-based data formats (such as comma- or tab-separated files), as these are non-proprietary and accessible across the range of statistical software packages. Also in line with previous papers, we recommend publishing the code used in the analyses as it is often difficult to provide a full description of the parameters used for a given analysis in the methods section of a journal article (Wolkovich, Regetz & O’Connor, 2012). This can be done as part of the
Supplemental Information 1or in online repositories such as GitHub (seeRam, 2013) or
Zenodo, which provides a DOI and archives a permanent version of the code.
Among the 71 data sets that were suitable to be reanalysed, we were able to get within 1% of the published value for at least one of the three statistics that we focused on (PVE, PAC and the largest (absolute) coefficient) for 59 studies (83%). There were strong positive correlations between published and reanalysed values for statistics reported in DFA, which suggests that replication, in the broad sense, is possible when the proper metadata are provided and with adequate curation of the data file. Slight discrepancies could be due to differences in rounding, or differences in how data are handled by the various software packages. Although data file problems that preclude reanalysis appear to be associated with some software (particularly SAS, seeTable 1), there was no effect of software on the reproduction of the published results in our reanalyses.
Evaluating whether the DFA metrics analysed here fall within 5% of the published values is, in our view, a reasonable test of reproducibility. However, it is uncertain how much the original conclusions from these studies would change based on the values we have obtained. The reproducibility of inference is an aspect of reproducibility that we admittedly did not explicitly address in this study. Additionally, while DFA was not always a central or essential component of the original study, its reproducibility is an important indicator of the underlying data’s quality and completeness. Such checks are a worthwhile consideration when archived data are being re-used for new purposes.
The reproducibility of the DFA varied depending on the summary statistic examined, ranging from 58% within 1% of the original value for the largest coefficient to 73% for the more complex PAC analyses, and 77% for PVE. The discriminant function coefficients were less likely to be reproduced, even when PVE and/or PAC matched. The procedures used to standardise model coefficients and calculate PAC differed among statistical packages and studies. For instance, if we had used only jackknifing for all PAC reanalyses, only 56% of published values would have been reproduced (results not shown). While this clearly does not invalidate the original results, it does highlight another obstacle to successfully reproducing the authors’ results: some summary statistics may be inherently harder to reproduce, particularly when there are numerous calculation methods, as is the case here, or when the estimation procedure makes use of stochastic numerical optimisation methods (e.g.,Gilbert et al., 2012).
In comparison with our previous study of reproducibility of analysis using the genetic analysis program STRUCTURE (Gilbert et al., 2012), the proportion of studies with inadequate data or metadata was similar to the current reanalysis (17 of 60 studies (28%) in Gilbert et al., and 15 of 86 (17%) here). The proportion of studies where we could not reproduce the analysis was also broadly similar: 9 of 30 analyses (30%) in Gilbert et al., and 12 of 71 studies (17%) here. Despite the somewhat lower percentage of successful reanalyses, the correlation between published and reanalyzed results was consistently greater for DFA (r=0.94–0.96)than for STRUCTURE(r=0.59). In attempts to reanalyse microarray data sets, which are much more complex than morphological data sets, approximately half of the results could be reproduced from available data (Ioannidis et al., 2009). It is not surprising that analyses with more steps and parameter choices are harder to reproduce, and this is echoed within our study, where we had to explore a wide range of analysis options to obtain close matches for the most complex DFA statistic, PAC. At the same time, DFA represents a relatively simple, well documented scientific analysis, and it is likely that complex analyses with more subcomponents, larger datasets, complex software dependencies and a less objective decision process will require much more information (metadata) to re-analyse and eventually reproduce. The wider adoption of metadata standards like the Ecological Metadata Language (Michener et al., 1997,https:/
/knb.ecoinformatics.org/#tools) would go a long way towards ensuring that crucial details
about more complex datasets are not lost over time.
Shared data is an important substrate for science and is one of the levers that may be used to improve the reliability of research (Ioannidis, 2014). The system of having data re-users directly contact data generators to obtain access to their data has been in place for decades, and is absolutely necessary for data re-use within embargo periods (Roche et al., 2014), but it is not a long-term solution for the preservation of research data (Vines et al., 2014). We argue that in order for archived data to retain their full value, all of the necessary data and metadata must be stored at the time of archiving, which typically happens at or soon before/after publication. We have determined some of the common problems that can occur in self-archived data even when authors can be contacted and are able to share their data. The same factors are relevant to communal data archives. While sequence repositories such as NCBI Genbank have made the provision of metadata a key part of the submission, the decision of what additional information to archive to more generalised databases such as Dryad, figshare, Zenodo or GitHub, lies with the authors. The results presented here and those of previous studies (Savage & Vickers, 2009;Gilbert et al., 2012;Drew et al., 2013;Vines et al., 2013;Vines et al., 2014) illustrate the need for our research community to make data availability and curation a central part of the research and publication process.
ACKNOWLEDGEMENTS
We are extremely grateful to the authors who kindly provided their data, without which this research would not have been possible. We also thank our collaborators on the first part of this project, Florence D´ebarre, Michelle Franklin, Kim Gilbert and Jean-S´ebastien
Moore. We thank Michael Whitlock and Heather Piwowar for useful discussions during the planning of the project and Mary O’Connor for thoughtful comments on our manuscript.
ADDITIONAL INFORMATION AND DECLARATIONS
Funding
Diana J. Rennison was supported by an NSERC postgraduate studentship. Dan G. Bock was supported by an NSERC Vanier CGS and a Killam doctoral scholarship. Sebastien Renaut was supported by an NSERC postdoctoral fellowship. The funders had no role in study design, data collection and analysis, decision to publish, or preparation of the manuscript.
Grant Disclosures
The following grant information was disclosed by the authors: NSERC postgraduate studentship.
NSERC Vanier CGS. Killam doctoral scholarship. NSERC postdoctoral fellowship.
Competing Interests
Tim Vines is the sole proprietor of the Molecular Ecology Editorial Office.
Author Contributions
• Rose L. Andrew conceived and designed the experiments, performed the experiments, analyzed the data, wrote the paper, prepared figures and/or tables, reviewed drafts of the paper.
• Arianne Y.K. Albert conceived and designed the experiments, analyzed the data, reviewed drafts of the paper.
• Sebastien Renaut conceived and designed the experiments, performed the experiments, analyzed the data, prepared figures and/or tables, reviewed drafts of the paper.
• Diana J. Rennison and Dan G. Bock conceived and designed the experiments, performed the experiments, prepared figures and/or tables, reviewed drafts of the paper.
• Tim Vines conceived and designed the experiments, performed the experiments, analyzed the data, wrote the paper, reviewed drafts of the paper.
Supplemental Information
Supplemental information for this article can be found online athttp://dx.doi.org/
10.7717/peerj.1137#supplemental-information.
REFERENCES
Anonymous. 2013. Announcement: reducing our irreproducibility. Nature
496:398DOI 10.1038/496398a.
Amado S, Armada-da-Silva PA, Jo˜ao F, Maur´ıcio AC, Lu´ıs AL, Sim˜oes MJ, Veloso AP. 2011.
The sensitivity of two-dimensional hindlimb joint kinematics analysis in assessing functional recovery in rats after sciatic nerve crush.Behavioural Brain Research225:562–573 DOI 10.1016/j.bbr.2011.08.021.
Amini F, Zamini A, Ahmadi M. 2007.Intergeneric hybridization between Kutum,Rutilus
frisii kutum, and Bream,Abramis brama orientalis, of the Caspian Sea.Journal of the World Aquaculture Society38:497–505DOI 10.1111/j.1749-7345.2007.00123.x.
Aparicio E, Garc´ıa-Berthou E, Araguas R, Mart´ınez P, Garc´ıa-Mar´ın J. 2005.Body pigmentation
pattern to assess introgression by hatchery stocks in nativeSalmo truttafrom Mediterranean streams.Journal of Fish Biology67:931–949DOI 10.1111/j.0022-1112.2005.00794.x.
Armbrust M, Fox A, Griffith R, Joseph AD, Katz R, Konwinski A, Lee G, Patterson D, Rabkin A,
Stoica I, Zaharia M. 2010.A view of cloud computing.Communications of the ACM53:50–58
DOI 10.1145/1721654.1721672.
Asanidze Z, Akhalkatsi M, Gvritishvili M. 2011.Comparative morphometric study and
relationships between the Caucasian species of wild pear (Pyrusspp.) and local cultivars in Georgia. Flora-Morphology, Distribution, Functional Ecology of Plants206:974–986 DOI 10.1016/j.flora.2011.04.010.
Audisio P, Belfiore C, De Biase A, Antonini G. 2001.Identification ofMeligethes matronalisand
M. subaeneusbased on morphometric and ecological characters (Coleoptera: Nitidulidae). European Journal of Entomology98:87–98DOI 10.14411/eje.2001.012.
Begley CG, Ellis LM. 2012.Drug development: raise standards for preclinical cancer research.
Nature483:531–533DOI 10.1038/483531a.
Berzins LL, Gilchrist HG, Burness G. 2009a.No assortative mating based on size in black
guillemots breeding in the Canadian Arctic.Waterbirds32:459–463DOI 10.1675/063.032.0313.
Berzins LL, Gilchrist HG, Burness G. 2009b.Data from: no assortative mating based on size in
black guillemots breeding in the Canadian Arctic. Dryad Digital Repository.Available athttp://
dx.doi.org/10.5061/dryad.1bm5t.
Bolker B, Phillips PC. 2012.cpcbp: common principal components/back-projection analysis. R
package version 0.3.3.
Borer ET, Seabloom EW, Jones MB, Schildhauer M. 2009.Some simple guidelines for
effective data management.Bulletin of the Ecological Society of America 90:205–214
DOI 10.1890/0012-9623-90.2.205.
Bourgeois K, Cur´e C, Legrand J, G ´omez-D´ıaz E, Vidal E, Aubin T, Mathevon N. 2007.
Morphological versus acoustic analysis: what is the most efficient method for sexing yelkouan shearwaters Puffinus yelkouan?Journal of Ornithology 148:261–269
DOI 10.1007/s10336-007-0127-3.
Brysting A, Elven R, Nordal I. 1997. The hypothesis of hybrid origin ofPoa jemtlandica
supported by morphometric and isoenzyme data.Nordic Journal of Botany17:199–214
DOI 10.1111/j.1756-1051.1997.tb00310.x.
Buczk ´o K, Wojtal AZ, Jahn R. 2009. Kobayasialla species of the Carpathian region:
morphology, taxonomy and description ofK. tintinnusspec. nov.Diatom Research24:1–21
DOI 10.1080/0269249X.2009.9705780.
Bulgarella M, Wilson RE, Kopuchian C, Valqui TH, McCracken KG. 2007.Elevational variation
in body size of crested ducks (Lophonetta specularioides) from the central high Andes, Mendoza, and Patagonia.Ornitologia Neotropical18:587–602.
Burnaby TP. 1966.Growth-invariant discriminant functions and generalized distances.Biometrics 22:96–110DOI 10.2307/2528217.
Cadrin SX. 1995.Discrimination of American lobster (Homarus americanus) stocks offsouthern
New England on the basis of secondary sex character allometry.Canadian Journal of Fisheries and Aquatic Sciences52:2712–2723DOI 10.1139/f95-860.
Capoccioni F, Costa C, Aguzzi J, Menesatti P, Lombarte A, Ciccotti E. 2011.Ontogenetic and
environmental effects on otolith shape variability in three Mediterranean European eel (Anguilla anguilla, L.) local stocks.Journal of Experimental Marine Biology and Ecology397:1–7
DOI 10.1016/j.jembe.2010.11.011.
Cavalcanti MJ. 1999.LINDA—linear discriminant analysis and comparison of multivariate
samples with randomisation tests.Available athttp://life.biosunysb.edu/morph/.
Conde-Pad´ın P, Grahame J, Rol´an-Alvarez E. 2007.Detecting shape differences in species of the
Littorina saxatiliscomplex by morphometric analysis.Journal of Molluscan Studies73:147–154
DOI 10.1093/mollus/eym009.
Contrafatto G. 2005. Species with fuzzy borders: the taxonomic status and species limits
of Saunders’ vlei rat,Otomys saundersiaeRoberts, 1929 (Rodentia, Muridae, Otomyini). Mammalia69:297–322.
Darbyshire S, Cayouette J. 1995.Identification of the species in thePanicum capillarecomplex
(Poaceae) from eastern Canada and adjacent New York State.Canadian Journal of Botany 73:333–348DOI 10.1139/b95-035.
De la Hera I, P´erez-Tris J, Telleria JL. 2007.Testing the validity of discriminant function analyses based on bird morphology: the case of migratory and sedentary blackcapsSylvia atricapilla wintering in southern Iberia.Ardeola54:81–91.
Dechaume-Moncharmont F-X, Monceau K, Cezilly F. 2011.Sexing birds using discriminant
function analysis: a critical appraisal.The Auk128:78–86DOI 10.1525/auk.2011.10129.
Drew BT, Gazis R, Cabezas P, Swithers KS, Deng J, Rodriguez R, Katz LA, Crandall KA,
Hibbett DS, Soltis DE. 2013.Lost branches on the tree of life.PLoS Biology11:e1001636
DOI 10.1371/journal.pbio.1001636.
Ekrt L, Travnicek P, Jarolimova V, Vit P, Urfus T. 2009.Genome size and morphology of the
Dryopteris affinisgroup in Central Europe.Preslia81:261–280.
Errington TM, Iorns E, Gunn W, Tan FE, Lomax J, Nosek BA. 2014.An open investigation of the
reproducibility of cancer biology research.eLife3:e04333DOI 10.7554/eLife.04333.
Eslami A, Qannari E, Bougeard S, Sanchez G. 2014.Multigroup: methods for multigroup data
analysis. R package version 0.4.2.Available athttps://cran.r-project.org/web/packages/multigroup/
multigroup.pdf.
Fern´andez I ´A, Feliner GN. 2001. A multivariate approach to assess the taxonomic utility
of morphometric characters inDoronicum(Asteraceae, Senecioneae).Folia Geobotanica 36:423–444DOI 10.1007/BF02899989.
Fisher RA. 1936.The use of multiple measurements in taxonomic problems.Annals of Eugenics
7:179–188DOI 10.1111/j.1469-1809.1936.tb02137.x.
Floate KD, Whitham TG. 1995.Insects as traits in plant systematics: their use in discriminating
between hybrid cottonwoods.Canadian Journal of Botany73:1–13DOI 10.1139/b95-001.
Foggi B, Rossi G, Signorini M. 1999. TheFestuca violaceaaggregate (Poaceae) in the Alps
and Apennines (central southern Europe).Canadian Journal of Botany 77:989–1013
DOI 10.1139/b99-054.
Forster MA, Ladd B, Bonser SP. 2010.Optimal allocation of resources in response to shading and neighbours in the heteroblastic species,Acacia implexa.Annals of Botany107:219–228
DOI 10.1093/aob/mcq228.
Gabrielson PW, Miller KA, Martone PT. 2011.Morphometric and molecular analyses confirm
two distinct species ofCalliarthron(Corallinales, Rhodophyta), a genus endemic to the northeast Pacific.Phycologia50:298–316DOI 10.2216/10-42.1.
Gilbert KJ, Andrew RL, Bock DG, Franklin MT, Kane NC, Moore J-S, Moyers BT, Renaut S,
Rennison DJ, Veen T, Vines TH. 2012.Recommendations for utilizing and reporting
population genetic analyses: the reproducibility of genetic clustering using the program STRUCTURE.Molecular Ecology21:4925–4930DOI 10.1111/j.1365-294X.2012.05754.x.
Ginoris Y, Amaral A, Nicolau A, Coelho M, Ferreira E. 2007.Development of an image analysis
procedure for identifying protozoa and metazoa typical of activated sludge system.Water Research41:2581–2589DOI 10.1016/j.watres.2007.02.006.
Gordo FP, Bandera CC. 1997.Differentiation of Spanish strains ofEchinococcus granulosus
using larval rostellar hook morphometry.International Journal for Parasitology 27:41–49
DOI 10.1016/S0020-7519(96)00173-7.
Gouws G, Stewart BA, Reavell PE. 2001.A new species of freshwater crab (Decapoda,
Potamonautidae) from the swamp forests of Kwazulu-Natal, South Africa: biochemical and morphological evidence.Crustaceana74:137–160DOI 10.1163/156854001750096256.
Gugerli F. 1997.Hybridization ofSaxifraga oppositifoliaandS. biflora(Saxifragaceae) in a mixed alpine population.Plant Systematics and Evolution207:255–272DOI 10.1007/BF00984391.
Hata Y, Hashiba T, Nakamura T, Kitamura M, Ishida TA, Akimoto S-i, Sato H, Kimura MT.
2011. Differences in leafminer (Phyllonorycter, Gracillariidae, Lepidoptera) and
aphid (Tuberculatus, Aphididae, Hemiptera) composition among Quercus dentata, Q. crispula,Q. serrata, and their hybrids. Journal of Forest Research16:309–318
DOI 10.1007/s10310-010-0230-9.
Hendriks IE, Van Duren LA, Herman PM. 2005.Image analysis techniques: a tool for the
identifi-cation of bivalve larvae?Journal of Sea Research54:151–162DOI 10.1016/j.seares.2005.03.001.
Heraty JM, Woolley JB. 1993.Separate species or polymorphism: a recurring problem inKapala
(Hymenoptera: Eucharitidae).Annals of the Entomological Society of America86:517–531 DOI 10.1093/aesa/86.5.517.
Hermida M, San Miguel E, Bouza C, Castro J, Mart´ınez P. 2009.Morphological variation in a
secondary contact between divergent lineages of brown trout (Salmo trutta) from the Iberian Peninsula.Genetics and Molecular Biology32:42–50DOI 10.1590/S1415-47572009005000014.
Ib´a˜nez AL, O’Higgins P. 2011.Identifying fish scales: the influence of allometry on scale shape and classification.Fisheries Research109:54–60DOI 10.1016/j.fishres.2011.01.016.
Ioannidis JPA. 2014.How to make more published research true.PLoS Medicine11:e1001747
DOI 10.1371/journal.pmed.1001747.
Ioannidis JPA, Allison DB, Ball CA, Coulibaly I, Cui X, Culhane AC, Falchi M, Furlanello C, Game L, Jurman G, Mangion J, Mehta T, Nitzberg M, Page GP, Petretto E, Van Noort V.
2009.Repeatability of published microarray gene expression analyses.Nature Genetics
41:149–155DOI 10.1038/ng.295.
Katoh M, Tokimura M. 2001.Genetic and morphological identification ofSebastiscus tertius
in the East China Sea (Scorpaeniformes: Scorpaenidae).Ichthyological Research48:247–255
DOI 10.1007/s10228-001-8142-5.
L ´opez-Gonz´alez C, Presley SJ, Owen RD, Willig MR. 2001.Taxonomic status ofMyotis (Chiroptera: vespertilionidae) in Paraguay. Journal of Mammalogy 82:138–160
DOI 10.1093/jmammal/82.1.138.
Magud BD, Stanisavljevi´c L ˇZ, Petanovi´c RU. 2007.Morphological variation in different populations ofAceria anthocoptes (Acari: Eriophyoidea) associated with the Canada thistle, Cirsium arvense, in Serbia.Experimental and Applied Acarology 42:173–183
DOI 10.1007/s10493-007-9085-y.
Malenke JR, Johnson KP, Clayton DH. 2009.Host specialization differentiates cryptic species of
feather-feeding lice.Evolution63:1427–1438DOI 10.1111/j.1558-5646.2009.00642.x.
Marhold K, Jongepierov´a I, Krahulcov´a A, Kucera J. 2005.Morphological and karyological
differentiation ofGymnadenia densifloraandG. conopseain the Czech Republic and Slovakia. Preslia77:159–176.
McNutt M. 2014.Journals unite for reproducibility.Science346:679DOI 10.1126/science.aaa1724.
Michener WK, Brunt JW, Helly JJ, Kirchner TB, Stafford SG. 1997.Nongeospatial metadata
for the ecological sciences.Ecological Applications 7:330–342 DOI
10.1890/1051-0761(1997)007[0330:NMFTES]2.0.CO;2.
Mills SC, Cˆot´e IM. 2003. Sex-related differences in growth and morphology of
blue mussels. Journal of the Marine Biological Association of the UK 83:1053–1057
DOI 10.1017/S0025315403008269h.
Nishida S, Naiki A, Nishida T. 2005.Morphological variation in leaf domatia enables coexistence
of antagonistic mites inCinnamomum camphora.Canadian Journal of Botany83:93–101
DOI 10.1139/b04-152.
Okuda N, Ito S, Iwao H. 2003.Female mimicry in a freshwater goby Rhinogobius sp. OR.
Ichthyological Research50:198–200DOI 10.1007/s10228-002-0154-2.
Palma L, Mira S, Cardia P, Beja P, Guillemaud T, Ferrand N, Cancela ML. 2001.Sexing Bonelli’s
Eagle nestlings: morphometrics versus molecular techniques.Journal of Raptor Research 35:187–193.
Parent GJ, Plourde S, Turgeon J. 2011.Overlapping size ranges ofCalanusspp. offthe Canadian
Arctic and Atlantic Coasts: impact on species’ abundances.Journal of Plankton Research 33:1654–1665DOI 10.1093/plankt/fbr072.
Pearce TA, Fields MC, Kurita K. 2007.Discriminating shells ofGastrocopta pentodon(Say, 1822)
andG. tappaniana(CB Adams, 1842)(Gastropoda: Pulmonata) with an example from the Delmarva Peninsula, eastern USA.Nautilus121:66–75.
P´erez-Farrera MA, Vovides AP, Martinez-Camilo R, Melendez NM, Iglesias C. 2009.A
reassessment of theCeratozamia miquelianaspecies complex (Zamiaceae) of southeastern Mexico, with comments on species relationships.Systematics and Biodiversity7:433–443
DOI 10.1017/S1477200009990211.
Price M. 2011.To replicate or not to replicate?Science Careers.Available athttp://sciencecareers.
sciencemag.org/career magazine/previous issues/articles/2011 12 02/caredit.a1100133.
R Core Development Team. 2011.R: a language and environment for statistical computing. Version
3.1.0. Vienna: R Foundation for Statistical Computing.
R Core Team. 2014.foreign: read data stored by Minitab, S, SAS, SPSS, Stata, Systat, Weka, dBase, . . .. R package version 0.8-61.Available athttp://CRAN.R-project.org/package=foreign.
RadloffSE, Hepburn HR, Fuchs S, Otis GW, Hadisoesilo S, Hepburn C, Ken T. 2005.
Multivariate morphometric analysis of theApis ceranapopulations of oceanic Asia.Apidologie 36:475–492DOI 10.1051/apido:2005034.
Ram K. 2013.Git can facilitate greater reproducibility and increased transparency in science. Source Code for Biology and Medicine8:1–8DOI 10.1186/1751-0473-8-7.
Reyment RA, Blackith RE, Campbell NR. 1984.Multivariate Morphometrics. London: Academic
Press.
Rigby MC, Font WF. 2001. Statistical reanalysis of the distinction between
Spirocamal-lanusistiblenniandS. monotaxis (Nematoda: Camallanidae). Journal of Parasitology 87:1210–1213DOI 10.1645/0022-3395(2001)087[1210:SROTDB]2.0.CO;2.
Rioux-Paquette S, Lapointe F-J. 2007.The use of shell morphometrics for the management of the
endangered malagasy radiated tortoise (Geochelone radiata).Biological Conservation134:31–39 DOI 10.1016/j.biocon.2006.08.022.
Ripley B, Lapsley M. 2013.RODBC: ODBC Database Access.Available athttps://cran.r-project.org/
web/packages/RODBC/index.html.
Roche DG, Lanfear R, Binning SA, HaffTM, Schwanz LE, Cain KE, Kokko H, Jennions MD,
Kruuk LEB. 2014.Troubleshooting public data archiving: suggestions to increase participation.
PLoS Biology12:e1001779DOI 10.1371/journal.pbio.1001779.
Ruedi M. 1995.Taxonomic revision of shrews of the genusCrocidurafrom the Sunda Shelf and
Sulawesi with description of two new species (Mammalia: Soricidae).Zoological Journal of the Linnean Society115:211–265DOI 10.1111/j.1096-3642.1995.tb02461.x.
Russell JC, Ringler D, Trombini A, Le Corre M. 2011.The island syndrome and population
dynamics of introduced rats.Oecologia167:667–676DOI 10.1007/s00442-011-2031-z.
Salcedo N, Rodriguez D, Strauss R, Baker R. 2011. The Fitzcarrald Arch: a vicariant
event forChaetostoma(Siluriformes: Loricariidae) speciation?Copeia 2011:503–512
DOI 10.1643/CI-10-062.
Santiago-Alarcon D, Parker PG. 2007.Sexual size dimorphism and morphological evidence
supporting the recognition of two subspecies in the Gal´apagos Dove.The Condor109:132–141
DOI 10.1650/0010-5422(2007)109[132:SSDAME]2.0.CO;2.
Savage CJ, Vickers AJ. 2009.Empirical study of data sharing by authors publishing in PLoS
Journals.PLoS ONE4:e7078DOI 10.1371/journal.pone.0007078.
Schagerl M, Kerschbaumer M. 2009.Autecology and morphology of selectedVaucheriaspecies
(Xanthophyceae).Aquatic Ecology43:295–303DOI 10.1007/s10452-007-9163-6.
Semple JC, Chmielewski JG, Leeder C. 1991.A multivariate morphometric study and revision
ofAstersubg.Doellingeriasect.Triplopappus(Compositae: Astereae): theAster umbellatus complex.Canadian Journal of Botany69:256–276DOI 10.1139/b91-036.
Svagelj WS, Quintana F. 2007.Sexual size dimorphism and sex determination by morphometric
measurements in breeding imperial shags (Phalacrocorax atriceps).Waterbirds30:97–102
DOI 10.1675/1524-4695(2007)030[0097:SSDASD]2.0.CO;2.
Thorogood R, Brunton D, Castro I. 2009. Simple techniques for sexing nestling
hihi (Notiomystis cincta) in the field. New Zealand Journal of Zoology 36:115–121
DOI 10.1080/03014220909510146.
Vanclay JK, Gillison AN, Keenan RJ. 1997.Using plant functional attributes to quantify site
productivity and growth patterns in mixed forests.Forest Ecology and Management94:149–163
DOI 10.1016/S0378-1127(96)03972-2.
Venables WN, Ripley BD. 2002.Modern Applied Statistics with S. New York: Springer.
Vines TH, Albert AYK, Andrew RL, D´ebarre F, Bock DG, Franklin MT, Gilbert KJ, Moore J-S, Renaut S, Rennison DJ. 2014.The availability of research data declines rapidly with article age. Current Biology24:94–97DOI 10.1016/j.cub.2013.11.014.
Vines TH, Andrew RL, Bock DG, Franklin MT, Gilbert KJ, Kane NC, Moore J-S, Moyers BT,
Renaut S, Rennison DJ, Veen T, Yeaman S. 2013.Mandated data archiving greatly improves
access to research data.The FASEB Journal27:1304–1308DOI 10.1096/fj.12-218164.
Wasowicz P, Rostanski A. 2009.The use of quantitative characters in determination of frequently
misdiagnosed species withinLepidiumL. sect.Dileptium[Brassicaceae].Acta Societatis Botanicorum Poloniae78:221–227.
White EP, Baldridge E, Brym ZT, Locey KJ, McGlinn DJ, Supp SR. 2013. Nine simple
ways to make it easier to (re)use your data.Ideas in Ecology and Evolution 6:1–10 DOI 10.4033/iee.2013.6b.6.f.
Whitlock MC. 2011.Data archiving in ecology and evolution: best practices.Trends in Ecology & Evolution26:61–65DOI 10.1016/j.tree.2010.11.006.
Wicherts JM, Bakker M, Molenaar D. 2011.Willingness to share research data is related to the
strength of the evidence and the quality of reporting of statistical results.PLoS ONE6:e26828
DOI 10.1371/journal.pone.0026828.
Wicherts JM, Borsboom D, Kats J, Molenaar D. 2006.The poor availability of psychological
re-search data for reanalysis.American Psychologist61:726–728DOI 10.1037/0003-066X.61.7.726.
Wicht B, Moretti M, Preatoni D, Tosi G, Martinoli A. 2003.The presence of Soprano pipistrelle
Pipistrellus pygmaeus(Leach, 1825) in Switzerland: first molecular and bioacustic evidences. Revue Suisse de Zoologie110:411–426.
Williams CT, Dean Kildaw S, Loren Buck C. 2007.Sex-specific differences in body condition
indices and seasonal mass loss in Tufted Puffins.Journal of Field Ornithology78:369–378
DOI 10.1111/j.1557-9263.2007.00125.x.
Wolkovich EM, Regetz J, O’Connor MI. 2012. Advances in global change research
require open science by individual researchers.Global Change Biology 18:2102–2110
DOI 10.1111/j.1365-2486.2012.02693.x.
Zaitoun IS, Tabbaa MJ, Bdour S. 2005.Differentiation of native goat breeds of Jordan
on the basis of morphostructural characteristics.Small Ruminant Research56:173–182
DOI 10.1016/j.smallrumres.2004.06.011.