Submitted26 May 2016
Accepted 4 August 2016
Published7 September 2016
Corresponding author
Maud I. Tenaillon, [email protected]
Academic editor
Jeffrey Ross-Ibarra
Additional Information and Declarations can be found on page 10
DOI10.7717/peerj.2408
Copyright
2016 Tenaillon et al.
Distributed under
Creative Commons CC-BY 4.0
OPEN ACCESS
Testing the link between genome size and
growth rate in maize
Maud I. Tenaillon1, Domenica Manicacci1, Stéphane D. Nicolas1,
Francois Tardieu2and Claude Welcker2
1Génétique Quantitative et Evolution—Le Moulon, INRA—Université Paris-Sud—CNRS—AgroParisTech, Université Paris-Saclay, Gif-sur-Yvette, France
2Ecophysiologie des Plantes sous Stress Environnementaux, INRA, Montpellier, France
ABSTRACT
Little is known about the factors driving within species Genome Size (GS) variation. GS may be shaped indirectly by natural selection on development and adaptative traits. Because GS variation is particularly pronounced in maize, we have sampled 83 maize inbred lines from three well described genetic groups adapted to contrasted climate conditions: inbreds of tropical origin, Flint inbreds grown in temperate climates, and Dent inbreds distributed in the Corn Belt. As a proxy for growth rate, we measured the Leaf Elongation Rate maximum during nighttime (LERmax) as well as GS in all inbred
lines. In addition we combined available and new nucleotide polymorphism data at 29,090 sites to characterize the genetic structure of our panel. We found significant variation for both LERmaxand GS among groups defined by our genetic structuring.
Tropicals displayed larger GS than Flints while Dents exhibited intermediate values. LERmaxfollowed the opposite trend with greater growth rate in Flints than in Tropicals.
In other words, LERmax and GS exhibited a significantly negative correlation (r= −0.27). However, this correlation was driven by among-group variation rather than
within-group variation—it was no longer significant after controlling for structure and kinship among inbreds. Our results indicate that selection on GS may have accompanied ancient maize diffusion from its center of origin, with large DNA content excluded from temperate areas. Whether GS has been targeted by more intense selection during modern breeding within groups remains an open question.
SubjectsEvolutionary Studies, Plant Science
Keywords Adaptation, Leaf elongation rate, Zea mays, DNA content, Breeding
INTRODUCTION
(Smarda, Bures & Horova, 2007), and up to 6% in maize (Zea maysssp.mays) and its closest wild relatives (ssp.parviglumisandmexicana), the teosintes (Muñoz Diez et al., 2013).
The factors driving GS variation remain a largely controversial issue. Several competing models have been proposed to explain among-species variations in GS. Interestingly, at least two of these models involve population genetic processes that may drive GS variation within species among populations, and ultimately preside over among-species GS variation (Agren & Wright, 2011;Petrov, 2001). The ‘‘mutational hazard’’ hypothesis (Lynch et al., 2011) posits that selection to maintain a constant per-genome mutation rate indirectly impacts GS. Providing that selection overcomes drift, the per base-pair-per-generation mutation rate correlates negatively with GS (Sung et al., 2012). Under this model, one expects within-species GS variation to be driven by differences in effective population size that condition the efficiency of natural selection against genome expansion. An alternative hypothesis asserts that positive natural selection may indirectly influence GS variation through developmental or adaptive phenotypes (Knight & Beaulieu, 2008). In plants, the latter hypothesis has been sustained by a handful of empirical studies demonstrating that GS correlates negatively with development traits such as seedling (Mowforth & Grime, 1989), root meristem growth rate (Gruner et al., 2010), and cell cycle length (Francis, Davies & Barlow, 2008). Small genomes indeed presumably facilitate faster cell division and therefore a higher growth rate (Knight, Molinari & Petrov, 2005;Rayburn, Dudley & Biradar, 1994).
Improving our understanding of intra-species genome dynamics is essential for elucidating the diversification of GS among related species. Maize is an attractive model to test whether GS is fine-tuned by positive natural selection. Not only does it display the largest within-species GS variation in plants and an exceptional genome fluidity (Chia et al., 2012), but is also characterized by a large effective population size—with estimates ranging from 33,000 (Vigouroux et al., 2002) to∼600,000 (Gossmann et al., 2010) and
993,000 individuals (Beissinger et al., 2016), and a worldwide distribution with contrasted growing conditions. Actually, maize has a long-lasting history of research on GS variation (for a review, seeKnight, Molinari & Petrov, 2005). The most recent and extensive report on this question in maize landrace populations (Muñoz Diez et al., 2013) has drawn several important conclusions: (1) GS varies primarily among landraces and within-landrace variation is limited; (2) geographical coordinates (altitude, longitude, latitude) are accurate predictors of GS; (3) GS correlates negatively with altitude. These results corroborate significant GS difference between temperate and tropical inbred lines in a sample of 17 improved inbred lines as reported byChia et al. (2012).
Altogether, these findings suggest that environmental-driven selection on life cycle length and growth rate could indirectly affect GS. To further validate this hypothesis, we measured GS and leaf elongation rate in 83 improved maize inbred lines of various origins in the purpose of establishing a link between GS and growth rate.
MATERIALS AND METHODS
in Mexico (Table 1). In order to maximize GS and LERmaxvariation, we sampled inbred
lines from three of the genetic groups previously defined by Camus-Kulandaivelu et al. (2006): tropical inbreds (Tropicals) characterized by a long life-cycle from sowing to flowering, flint inbreds (Flints) grown in temperate climates with a short life-cycle, and Dent inbreds (Dents) distributed in the Corn Belt with an intermediate life-cycle. Our panel encompassed 50 Tropicals, 18 Flints and 15 Dents.
Genotyping of the 83 inbreds with the Illumina MaizeSNP50 array was either available (Bouchet et al., 2013) or generated for a subset of 11 inbred lines (Data S1). We analyzed 29,090 SNPs contributed by the Panzea project (Zhao et al., 2006) that were developed on a discovery panel of 14 maize and 16 teosinte inbreds. Genotypes of 83 lines on 29,090 SNPs are available inData S1. We utilized FastStructure v1.0 (Raj, Stephens & Pritchard, 2014) to evaluate the genetic structure of our sample usingK=2 andK=3 as the number of genetic groups. We determined the memberships of each inbred to the groups atK=2 andK=3 (Table 1). Kinship was computed fromAstle & Balding (2009)using GenABEL
(http://www.genabel.org,Aulchenko, Struchalin & Van Duijn, 2010).
Plants from each inbred line were characterized for LERmaxin the phenotyping facility
Phenodyn(http://bioweb.supagro.inra.fr/phenodyn/) in two experiments (Data S2). The first experiment included all 83 inbred lines with 3 replicated measurements per inbred. The second experiment was a biological replicate for 58 out of the 83 inbred lines, with 3 replicated measurements. Plants were grown in a Klaszmann substrate (30% clay, 70% peat) according to the protocol reported inSadok et al. (2007b). Briefly, the LERmax(in
mm per hour) of the 6th leaf was measured every 15 min during nighttime from 12 to 4 am, time at which LER is maximum. Measurements took place in the 4–7 days during which the leaf elongation rate of leaf 6 has no temporal trend over successive nights (Sadok et al., 2007a). A single measure is therefore an average of LER during 4 to 7 nights. Meristem and air temperature, light intensity and air relative humidity, were measured every 15 min. Plants were grown in the greenhouse with naturally fluctuating conditions (200 to 1,100µmol m−2 s−1at noon time) under well-watered conditions. During the
measurement period, meristem temperature was 18.5◦C±0.2◦C and 20.0±0.8◦C in
Experiment 1 and 2, respectively. Both soil water potential (−0.11 and−0.15 MPa) and vapour pressure deficit (0.93 kPa±0.14kPa and 0.98 kPa±0.14 kPa) were in the range most favorable for growth during measurements.
In parallel, we measured the GS of 3–5 individuals per inbred line—from the same seed lots used for the LERmaxmeasurements (Data S2). Inbreds were grown in a greenhouse in
Gif-sur-Yvette (France) and transferred after 3 weeks to the Imagif facility in Gif-sur-Yvette. The total nuclear DNA amount was assessed by flow cytometry according toMarie & Brown (1993) Pisum sativumL. ‘Long Express’ (2C=8.37 pg) was used as an internal standard.
Leaves of the internal standard and maize lines were chopped using a razor blade in a plastic Petri dish with 1 ml of Gif nuclei-isolation buffer (45 mM MgCl2, 30 mM sodium citrate, 60
mM MOPS, 1% (w/v) polyvinylpyrrolidone 10,000, pH 7.2) containing 0.1% (w/v) Triton X–100, supplemented with 5 mM sodium metabisulphite and RNAse (2.5 U/ml). The suspension was filtered through 50µm nylon mesh. The nuclei were stained with 50µg/ml
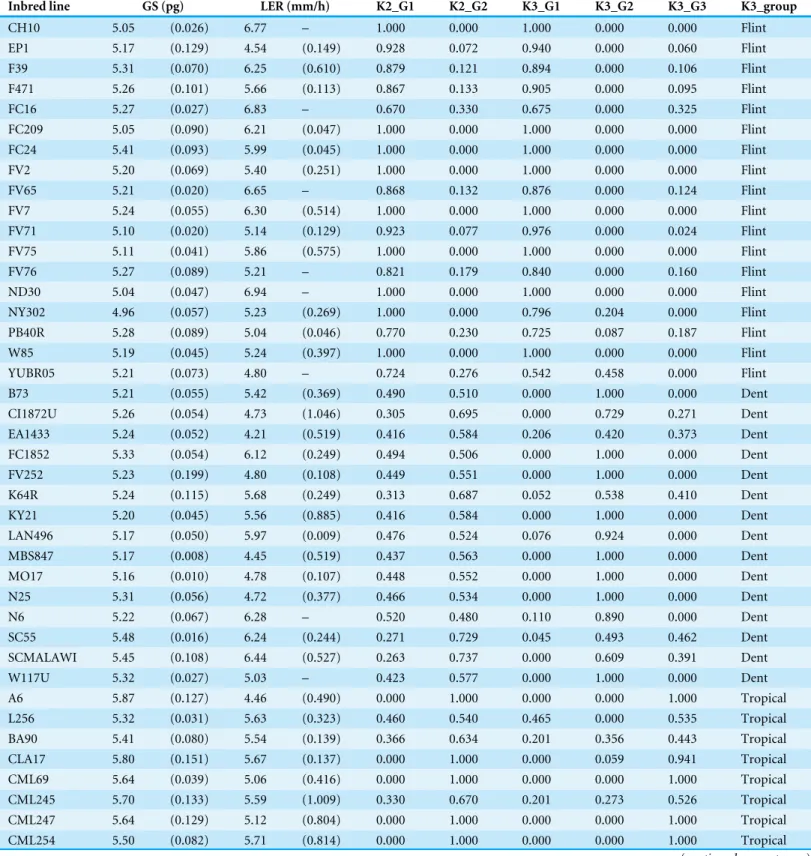
Table 1 List of inbred lines with measures of Genome Size (GS), LERmax (LER) and membership atK = 2 (Group 1, 2) andK = 3 (Group 1, 2, 3).
Inbred line GS (pg) LER (mm/h) K2_G1 K2_G2 K3_G1 K3_G2 K3_G3 K3_group
CH10 5.05 (0.026) 6.77 – 1.000 0.000 1.000 0.000 0.000 Flint
EP1 5.17 (0.129) 4.54 (0.149) 0.928 0.072 0.940 0.000 0.060 Flint
F39 5.31 (0.070) 6.25 (0.610) 0.879 0.121 0.894 0.000 0.106 Flint
F471 5.26 (0.101) 5.66 (0.113) 0.867 0.133 0.905 0.000 0.095 Flint
FC16 5.27 (0.027) 6.83 – 0.670 0.330 0.675 0.000 0.325 Flint
FC209 5.05 (0.090) 6.21 (0.047) 1.000 0.000 1.000 0.000 0.000 Flint
FC24 5.41 (0.093) 5.99 (0.045) 1.000 0.000 1.000 0.000 0.000 Flint
FV2 5.20 (0.069) 5.40 (0.251) 1.000 0.000 1.000 0.000 0.000 Flint
FV65 5.21 (0.020) 6.65 – 0.868 0.132 0.876 0.000 0.124 Flint
FV7 5.24 (0.055) 6.30 (0.514) 1.000 0.000 1.000 0.000 0.000 Flint
FV71 5.10 (0.020) 5.14 (0.129) 0.923 0.077 0.976 0.000 0.024 Flint
FV75 5.11 (0.041) 5.86 (0.575) 1.000 0.000 1.000 0.000 0.000 Flint
FV76 5.27 (0.089) 5.21 – 0.821 0.179 0.840 0.000 0.160 Flint
ND30 5.04 (0.047) 6.94 – 1.000 0.000 1.000 0.000 0.000 Flint
NY302 4.96 (0.057) 5.23 (0.269) 1.000 0.000 0.796 0.204 0.000 Flint
PB40R 5.28 (0.089) 5.04 (0.046) 0.770 0.230 0.725 0.087 0.187 Flint
W85 5.19 (0.045) 5.24 (0.397) 1.000 0.000 1.000 0.000 0.000 Flint
YUBR05 5.21 (0.073) 4.80 – 0.724 0.276 0.542 0.458 0.000 Flint
B73 5.21 (0.055) 5.42 (0.369) 0.490 0.510 0.000 1.000 0.000 Dent
CI1872U 5.26 (0.054) 4.73 (1.046) 0.305 0.695 0.000 0.729 0.271 Dent
EA1433 5.24 (0.052) 4.21 (0.519) 0.416 0.584 0.206 0.420 0.373 Dent
FC1852 5.33 (0.054) 6.12 (0.249) 0.494 0.506 0.000 1.000 0.000 Dent
FV252 5.23 (0.199) 4.80 (0.108) 0.449 0.551 0.000 1.000 0.000 Dent
K64R 5.24 (0.115) 5.68 (0.249) 0.313 0.687 0.052 0.538 0.410 Dent
KY21 5.20 (0.045) 5.56 (0.885) 0.416 0.584 0.000 1.000 0.000 Dent
LAN496 5.17 (0.050) 5.97 (0.009) 0.476 0.524 0.076 0.924 0.000 Dent
MBS847 5.17 (0.008) 4.45 (0.519) 0.437 0.563 0.000 1.000 0.000 Dent
MO17 5.16 (0.010) 4.78 (0.107) 0.448 0.552 0.000 1.000 0.000 Dent
N25 5.31 (0.056) 4.72 (0.377) 0.466 0.534 0.000 1.000 0.000 Dent
N6 5.22 (0.067) 6.28 – 0.520 0.480 0.110 0.890 0.000 Dent
SC55 5.48 (0.016) 6.24 (0.244) 0.271 0.729 0.045 0.493 0.462 Dent
SCMALAWI 5.45 (0.108) 6.44 (0.527) 0.263 0.737 0.000 0.609 0.391 Dent
W117U 5.32 (0.027) 5.03 – 0.423 0.577 0.000 1.000 0.000 Dent
A6 5.87 (0.127) 4.46 (0.490) 0.000 1.000 0.000 0.000 1.000 Tropical
L256 5.32 (0.031) 5.63 (0.323) 0.460 0.540 0.465 0.000 0.535 Tropical
BA90 5.41 (0.080) 5.54 (0.139) 0.366 0.634 0.201 0.356 0.443 Tropical
CLA17 5.80 (0.151) 5.67 (0.137) 0.000 1.000 0.000 0.059 0.941 Tropical
CML69 5.64 (0.039) 5.06 (0.416) 0.000 1.000 0.000 0.000 1.000 Tropical
CML245 5.70 (0.133) 5.59 (1.009) 0.330 0.670 0.201 0.273 0.526 Tropical
CML247 5.64 (0.129) 5.12 (0.804) 0.000 1.000 0.000 0.000 1.000 Tropical
CML254 5.50 (0.082) 5.71 (0.814) 0.000 1.000 0.000 0.000 1.000 Tropical
Table 1(continued)
Inbred line GS (pg) LER (mm/h) K2_G1 K2_G2 K3_G1 K3_G2 K3_G3 K3_group
CML287 5.48 (0.042) 5.89 (0.660) 0.000 1.000 0.000 0.000 1.000 Tropical
CML312 5.31 (0.073) 4.06 – 0.000 1.000 0.000 0.000 1.000 Tropical
CML333 5.54 (0.073) 4.88 (0.640) 0.051 0.949 0.023 0.061 0.917 Tropical
CML340 5.51 (0.068) 5.27 – 0.000 1.000 0.000 0.000 1.000 Tropical
CML341 5.50 (0.046) 4.53 – 0.000 1.000 0.000 0.000 1.000 Tropical
CML344 5.58 (0.092) 3.80 – 0.000 1.000 0.000 0.000 1.000 Tropical
CML440 5.60 (0.028) 4.21 – 0.063 0.937 0.063 0.000 0.937 Tropical
CML91 5.44 (0.053) 4.60 (0.802) 0.109 0.891 0.032 0.149 0.819 Tropical
CMLP1 5.60 (0.087) 4.83 (0.020) 0.000 1.000 0.000 0.000 1.000 Tropical
CMLP2 5.59 (0.080) 5.21 (0.457) 0.000 1.000 0.000 0.000 1.000 Tropical
CZL04006 5.51 (0.142) 6.33 – 0.090 0.910 0.000 0.260 0.740 Tropical
CZL0617 5.55 (0.097) 5.27 – 0.000 1.000 0.000 0.000 1.000 Tropical
CZL071 5.30 (0.054) 6.52 – 0.089 0.911 0.028 0.119 0.853 Tropical
EA1197 5.55 (0.124) 5.90 (0.268) 0.234 0.766 0.246 0.000 0.754 Tropical
EA1201 5.56 (0.164) 5.74 (0.492) 0.152 0.848 0.152 0.000 0.848 Tropical
EA1866 5.44 (0.078) 6.47 (0.536) 0.234 0.766 0.237 0.000 0.763 Tropical
EA1712 5.34 (0.012) 6.25 (0.486) 0.199 0.801 0.208 0.000 0.792 Tropical
F2834T 5.44 (0.060) 5.14 (0.431) 0.245 0.755 0.136 0.224 0.640 Tropical
G37 5.65 (0.096) 4.70 (0.010) 0.000 1.000 0.000 0.000 1.000 Tropical
DTPWC9-F115 5.55 (0.072) 5.35 – 0.000 1.000 0.000 0.000 1.000 Tropical
DTPWC9-F104 5.52 (0.030) 4.59 – 0.000 1.000 0.000 0.062 0.938 Tropical
DTPWC9-F31 5.65 (0.068) 4.09 – 0.000 1.000 0.000 0.000 1.000 Tropical
DTPYC9-F74 5.46 (0.092) 5.37 – 0.000 1.000 0.000 0.000 1.000 Tropical
DTPYC9-F46 5.49 (0.105) 5.89 – 0.000 1.000 0.000 0.018 0.982 Tropical
LPSC7-F64 5.45 (0.004) 4.84 – 0.000 1.000 0.000 0.000 1.000 Tropical
LPSC7-F71 5.41 (0.044) 5.49 – 0.000 1.000 0.000 0.000 1.000 Tropical
LPSC7-F103 5.45 (0.019) 4.14 – 0.000 1.000 0.000 0.000 1.000 Tropical
LPSC7-F86 5.49 (0.084) 4.45 – 0.000 1.000 0.000 0.000 1.000 Tropical
H16 5.37 (0.029) 4.36 (0.150) 0.000 1.000 0.000 0.000 1.000 Tropical
KUI44 5.26 (0.101) 4.63 (0.823) 0.050 0.950 0.041 0.016 0.942 Tropical
KUI11 5.54 (0.050) 5.58 (0.073) 0.000 1.000 0.000 0.042 0.958 Tropical
KUI3 5.64 (0.052) 4.17 (0.265) 0.000 1.000 0.000 0.000 1.000 Tropical
LP1037 5.30 (0.037) 6.21 (0.678) 0.340 0.660 0.249 0.175 0.576 Tropical
LP1233 5.39 (0.054) 5.97 (0.458) 0.240 0.760 0.243 0.000 0.757 Tropical
LP35 5.40 (0.158) 5.69 (0.168) 0.243 0.757 0.242 0.008 0.750 Tropical
MO22 5.45 (0.097) 5.40 (0.117) 0.069 0.931 0.065 0.000 0.935 Tropical
NC298 5.75 (0.107) 4.77 (0.815) 0.000 1.000 0.000 0.000 1.000 Tropical
NC304 5.48 (0.026) 5.02 (0.124) 0.000 1.000 0.000 0.000 1.000 Tropical
NC320 5.40 (0.099) 5.61 (0.750) 0.210 0.790 0.000 0.465 0.535 Tropical
NC338 5.78 (0.107) 4.98 (0.145) 0.000 1.000 0.000 0.000 1.000 Tropical
TZI18 5.89 (0.044) 5.39 (0.112) 0.000 1.000 0.000 0.000 1.000 Tropical
determined for each sample using a flow cytometer (CyFlow SL3, Partec-Sysmex. Excitation 532 nm, 30 mW; emission through a 630/30 nm band-pass filter). The total 2C DNA value was calculated using the linear relationship between the fluorescent signals from stained nuclei of the maize and the internal standard. We performed three technical replicates per plant. In addition, we employed the inbred line B73 (maize reference genome) to verify the flow cytometer calibration at regular time intervals.
The LERmaxand GS values were averaged among technical replicates (Data S2). LERmax
of 58 inbred lines replicated over the two experiments were compared using theBland and Altman’s method (1986). The replicates were highly concordant with differences between replicates that did not differ from 0 (t= −1.3,df =28,P=0.20), and no correlation
between differences between replicates and inbred line mean values (t= −1.6;df =27,
P=0.13). GS measurement was replicated on 3–5 plants per line, except for three that
were replicated twice and B73 for which we had 14 replicates. Given the high and variable replicates number, the Bland and Altman’s method could not be applied. Instead, we performed a one-way ANOVA and showed that GS variation was mainly owed to inbred line differences (R2=89.7%), with only 10.3% variation across biological replicates. Means
and standard deviations for LERmaxand GS across biological replicates for each inbred
line are reported inTable 1, and mean values were used for further statistical analyses. All statistical analyses were performed using the R software.
The effect of genetic groups on LERmaxand GS was first tested using linear regression
on quantitative memberships obtained from FastStructure. We also employed a one-way ANOVA with a qualitative classification of inbreds as Flints, Dents or Tropicals. In this case, inbreds were assigned to a group based on its highest membership coefficient as determined by FastStructure atK=3. We computed pairwise differences between groups using Tukey-Kramer contrasts. We tested the correlation between LERmaxand GS first
by simple regression; second we corrected for genetic structure by adding qualitative or quantitative memberships obtained from FastStructure as covariates in the linear model; third, we used a mixed model declaring FastStructure quantitative membership as a fixed effect and kinship as a random effect (Yu et al., 2006).
RESULTS
We assembled a panel of 83 maize inbred lines to test the link between genome size (GS) and the leaf elongation rate (LERmax). We extracted genotyping data from 29,090 SNPs
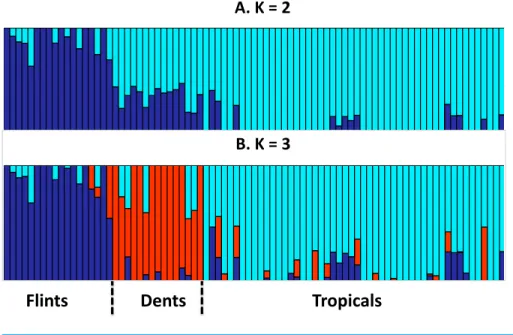
and assess genetic structuring of the panel. Our results revealed a clear separation between Tropicals and Flints, while Dents were found as admixed individuals whenK=2. With K=3, the Dent inbreds form a distinct genetic group (Fig. 1).
GS varied between 4.96 pg and 5.89 pg (Table 1) with a coefficient of variation of 3.6%. LERmax ranged from 3.80 to 6.94 mm h−1 (Table 1) with a coefficient of variation of
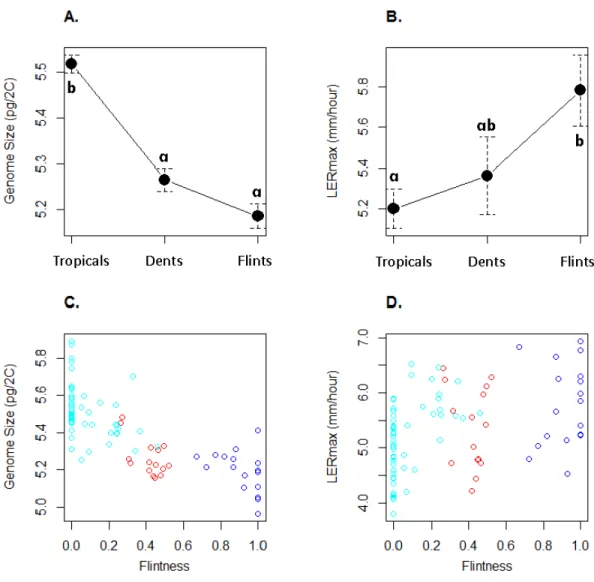
13.7%.Figure 2illustrates GS and LERmaxvariation within and among the three genetic
groups, each inbred being assigned to the genetic group of greatest membership. For both traits, mean values significantly differed among groups (one-way ANOVA, GS :F(2;80)=
52.7,P=2.5 10
−15; LER :F
(2;80)=4.47,P=0.014). Confirming previous observations,
Figure 1 Group membership of 83 maize inbred lines inferred using FastStructure v1.0 (Raj, Stephens & Pritchard, 2014) from 29,090 SNPs with ancestral group numberK =2 (A) orK =3 (B).The 83 inbred lines are ordered as inTable 1. Group names were a posteriori defined from the inbred lines with greatest membership with Flints (blue), Dents (red), and Tropicals (cyan).
intermediate GS although non-significantly different from the Flints (Fig. 2A). LERmax
followed the opposite trend with Flints exhibiting higher values than Tropicals (Fig. 2B). Consistently we found a significant effect of the degree of ‘‘Flintness’’—membership to the Flint group forK=2—on GS (Fig. 2C) and LERmax(Fig. 2D). The Pearson correlation
coefficients were highly significant (r= −0.77,P=2.1 10
−17 andr=0
.40,P=2.0 10 −4
respectively for GS and LERmax).
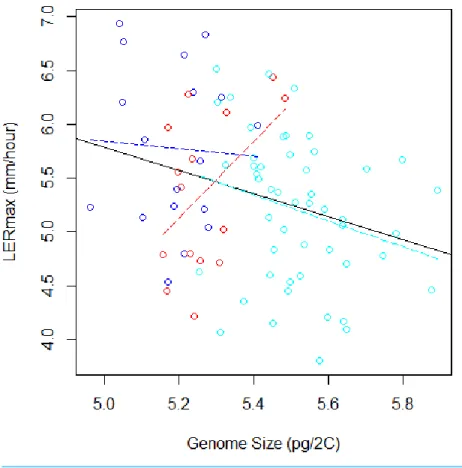
To validate further this pattern, we investigated the correlation between LERmaxand GS
and found a significantly negative correlation (r= −0.29,F(1;81)=7.28,P=0.008,Fig. 3).
However, GS may correlate with relatedness among inbreds because measures of closely related inbreds, i.e., those that form a genetic group, are not independent observations. In order to control this effect, we re-analysed the correlation between GS and LERmax
controlling for qualitatively (group assignation from the highest membership coefficient) or quantitatively (group membership coefficient) defined groups. We found that the group effect was significant (F(2;77)=4.68,P=0.012). Additionally, the correlation was no longer
significant when controlling for either qualitative group origin (F(1;77)=1.07,P=0.31,
Fig. 3) or quantitative group membership (F(1;77)=0,003,P=0.95). As expected when
kinship was added to the model, the effect of GS on LERmaxremained not significant
(P=0.95). The regression slope between GS and LER did not differ among groups as
indicated by the non-significant Group X GS interaction on the LER measurements (F(2;77)=2.84,P=0.065).
Figure 2 Mean and standard errors across inbred lines for genome size (A) and LERmax (B) for Tropicals, Dents and Flints as defined inTable 1atK=3. Relationship between genome size (C) and LERmax (D) with Flintness as measured by the membership to the Flint group atK =2 (Table 1).In (A) and (B), pairs of groups with similar letters exhibit non-significant difference in mean values. In (C) and (D), groups are colored as inFig. 1.
displaying a tendency towards faster growth rate than larger genome inbreds (r= −0.26,
F(1;48)=3.35,P=0.073).
DISCUSSION
Figure 3 Relation between Genome Size and LERmax within and among groups (Flints in blue, Dents in red, and Tropicals in cyan). The plain line illustrates the linear regression for all data, while colored dotted lines correspond to linear regressions within each group. When the group variable is included in the ANOVA to correct for genetic structure, the relation between LERmax and GS becomes non-significant. The Tropical group, that contains 50 inbred lines, displays a tendency for negative correlation between LERmax and GS.
GS may evolve rapidly under selection (Rayburn, Dudley & Biradar, 1994).Realini et al. (2015)have recently reported a positive correlation between heterochromatin content and length of the vegetative cycle in 9 maize populations sampled from Northeastern Argentina. However a more direct effect of GS variation on growth rate has never been formally tested. Here, we determined GS and leaf elongation rate (LERmax) in 83 improved maize inbred
lines selected under contrasted climates. We measured LERmaxin the developing 6th leaf
during the linear phase of elongation, considered as a steady-state (Salah & Tardieu, 1997). This state is commonly used for measuring cell division and/or tissue expansion (Tardieu et al., 2000). It therefore is a good proxy for growth rate in relation with the timing of cell cycle. Besides, the LERmaxin maize is reproducible and independent of environmental conditions
if corrected for temperature effect (Sadok et al., 2007b). It is also a highly heritable trait (Dignat et al., 2013).
admixture between Tropicals and Flints to form the Dent inbreds at the end of the 19th century (Labate et al., 2003).
Our sample corroborates previous observations from a restricted set of inbreds with temperate inbreds (Flints) exhibiting a significantly smaller GS than tropical (Tropicals) inbreds (Chia et al., 2012) (Figs. 2Aand2C). Interestingly, LERmaxfollowed the opposite
trend with Flints exhibiting higher values than Tropicals whether inbred group membership was considered as qualitative (Fig. 2B) or a quantitative trait (Fig. 2D). Note that Dents exhibit intermediate values bot for GS and LERmaxconsistent with their admixed status.
At a first glimpse our results therefore support the hypothesis that smaller genomes exhibit a faster development rate. Because LERmaxis a good indicator of growth ability of
other organs including reproductive organs (Dignat et al., 2013), it is tempting to speculate that selection for a faster-life cycle in early flowering Flint inbreds has indirectly impacted genome size.
However the negative correlation between GS and LERmax was mainly driven by among-group variation (Fig. 3), suggesting that the existing link between these variables at the origin of the groups was followed by uncorrelated changes during subsequent evolutionary history. Such a pattern has been reported among species, whereby accounting for the phylogenetic history of species altered the relationship between effective population size and GS (Whitney & Garland , 2010). Noteworthy, within Tropicals smaller genomes displayed a tendency towards faster growth rate than larger genomes. The coefficient of variation of GS was also greater in this group (26%) than in either Flints (22%) or Dents (19%). Tropicals are subjected to high variation in altitude that may exert selective pressure on GS. Additional sampling with limited structuring will be necessary to validate further this result.
Altogether, our results show that selection on GS may have accompanied ancient maize geographical diffusion from its center of origin, consistently with the idea that landraces/in-breds with large DNA content may be excluded from more extreme temperate climates.
ACKNOWLEDGEMENTS
We are grateful to Jessica Mélique and Spencer Brown for their help in performing the GS measurements and to Spencer Brown for sharing his expertise. We thank Mickaël Bourge and Béatrice Jeunemaitre at the Imagerie-Gif flow cytometry facility for their help in interpreting GS histograms. We also thank Stephane Berthezene and Benoit Suard for their technical support at the phenotyping facility. Delphine Madur handled the samples genotyping. Jean-Tristan Brandenburg provided help with SNP data extraction. Jeff Ross-Ibarra provided helpful comments on the manuscript.
ADDITIONAL INFORMATION AND DECLARATIONS
Funding
Grant Disclosures
The following grant information was disclosed by the authors:
Agence Nationale de la Recherche, Investissements d’avenir: ANR-10-BTBR-03.
Competing Interests
The authors declare there are no competing interests.
Author Contributions
• Maud I. Tenaillon conceived and designed the experiments, performed the experiments,
analyzed the data, contributed reagents/materials/analysis tools, wrote the paper.
• Domenica Manicacci analyzed the data, contributed reagents/materials/analysis tools,
prepared figures and/or tables, reviewed drafts of the paper.
• Stéphane D. Nicolas analyzed the data, contributed reagents/materials/analysis tools,
reviewed drafts of the paper.
• Francois Tardieu contributed reagents/materials/analysis tools, reviewed drafts of the paper.
• Claude Welcker conceived and designed the experiments, performed the experiments, analyzed the data, contributed reagents/materials/analysis tools, reviewed drafts of the paper.
Data Availability
The following information was supplied regarding data availability: The raw data has been supplied asSupplemental Information.
Supplemental Information
Supplemental information for this article can be found online athttp://dx.doi.org/10.7717/ peerj.2408#supplemental-information.
REFERENCES
Agren JA, Wright SI. 2011.Co-evolution between transposable elements and their
hosts: a major factor in genome size evolution?Chromosome Research19:777–786 DOI 10.1007/s10577-011-9229-0.
Astle W, Balding DJ. 2009.Population structure and cryptic relatedness in genetic
association studies.Statistical Science24:451–471DOI 10.1214/09-STS307.
Aulchenko YS, Struchalin MV, Van Duijn CM. 2010.ProbABEL package for
genome-wide association analysis of imputed data.BMC Bioinformatics11:134–143 DOI 10.1186/1471-2105-11-134.
Beissinger TM, Wang L, Crosby K, Durvasula A, Hufford MB, Ross-Ibarra J. 2016.
Recent demography drives changes in linked selection across the maize genome. Nature Plants2:16084DOI 10.1038/nplants.2016.84.
Bland JM, Altman DG. 1986.Statistical method for assessing agreement between two
Bouchet S, Servin B, Bertin P, Madur D, Combes V, Dumas F, Brunel D, Laborde J,
Charcosset A, Nicolas S. 2013.Adaptation of maize to temperate climates:
mid-density genome-wide association genetics and diversity patterns reveal key genomic regions, with a major contribution of the Vgt2 (ZCN8) locus.PLoS ONE8:e71377 DOI 10.1371/journal.pone.0071377.
Camus-Kulandaivelu L, Veyrieras JB, Madur D, Combes V, Fourmann M, Barraud S,
Dubreuil P, Gouesnard B, Manicacci D, Charcosset A. 2006.Maize adaptation to
temperate climate: relationship between population structure and polymorphism in the Dwarf8 gene.Genetics172:2449–2463DOI 10.1534/genetics.105.048603.
Chia J-M, Song C, Bradbury PJ, Costich D, De Leon N, Doebley J, Elshire RJ, Gaut B, Geller L, Glaubitz JC, Gore M, Guill KE, Holland J, Hufford MB, Lai J, Li M, Liu X, Lu Y, McCombie R, Nelson R, Poland J, Prasanna BM, Pyhaejaervi T, Rong T, Sekhon RS, Sun Q, Tenaillon MI, Tian F, Wang J, Xu X, Zhang Z, Kaeppler SM, Ross-Ibarra J, McMullen MD, Buckler ES, Zhang G, Xu Y, Ware D. 2012.
Maize HapMap2 identifies extant variation from a genome in flux.Nature Genetics
44:803–U238DOI 10.1038/ng.2313.
Dignat G, Welcker C, Sawkins M, Ribaut JM, Tardieu F. 2013.The growths of leaves,
shoots, roots and reproductive organs partly share their genetic control in maize plants.Plant Cell and Environment36:1105–1119DOI 10.1111/pce.12045.
Ellul P, Boscaiu M, Vicente O, Moreno V, Rossello JA. 2002.Intra- and interspecific
variation in DNA content inCistus(Cistaceae).Annals of Botany90:345–351 DOI 10.1093/aob/mcf194.
Francis D, Davies MS, Barlow PW. 2008.A strong nucleotypic effect on the cell cycle
regardless of ploidy level.Annals of Botany101:747–757DOI 10.1093/aob/mcn038.
Gossmann TI, Song B-H, Windsor AJ, Mitchell-Olds T, Dixon CJ, Kapralov MV,
Filatov DA, Eyre-Walker A. 2010.Genome wide analyses reveal little evidence
for adaptive evolution in many plant species.Molecular Biology and Evolution
27:1822–1832DOI 10.1093/molbev/msq079.
Grover E, Wendel JF. 2010.Recent insights into mechanisms of genome size change in
plants.Journal of Botany2010:Article 382732DOI 10.1155/2010/382732.
Gruner A, Hoverter N, Smith T, Knight CA. 2010.Genome size is a strong predictor of
root meristem growth rate.Journal of Botany2010:390414 DOI 10.1155/2010/390414.
Huang H, Tong Y, Zhang Q-J, Gao L-Z. 2013.Genome size variation among and within
Camelliaspecies by using flow cytometric analysis.PLoS ONE8(5):e64981 DOI 10.1371/journal.pone.0064981.
Jakob SS, Meister A, Blattner FR. 2004.Considerable genome size variation of Hordeum
species (Poaceae) is linked to phylogeny, life form, ecology, and speciation rates. Molecular Biology and Evolution21:860–869DOI 10.1093/molbev/msh092.
Knight CA, Beaulieu JM. 2008.Genome size scaling through phenotype space.Annals of
Knight CA, Molinari NA, Petrov DA. 2005.The large genome constraint hypothesis: evolution, ecology and phenotype.Annals of Botany95:177–190
DOI 10.1093/aob/mci011.
Labate JA, Lamkey KR, Mitchell SE, Kresovich S, Sullivan H, Smith JSC. 2003.
Molecu-lar and historical aspects of corn belt dent diversity.Crop Science43:80–91 DOI 10.2135/cropsci2003.8000.
Long Q, Rabanal FA, Meng D, Huber CD, Farlow A, Platzer A, Zhang Q, Vilhjalmsson BJ, Korte A, Nizhynska V, Voronin V, Korte P, Sedman L, Mandakova T, Lysak
MA, Seren U, Hellmann I, Nordborg M. 2013.Massive genomic variation and
strong selection inArabidopsis thalianalines from Sweden.Nature Genetics
45:884–U218DOI 10.1038/ng.2678.
Lynch M, Bobay L-M, Catania F, Gout J-F, Rho M. 2011. The repatterning of eukaryotic
genomes by random genetic drift. In: Chakravarti A, Green E, eds.Annual review of genomics and human genetics. Vol. 12, 347–366.
Marie D, Brown SC. 1993.A cytometric exercise in plant DNA histograms, with
2C-values for 70 species.Biology of the Cell78:41–51.
Matsuoka Y, Vigouroux Y, Goodman MM, Sanchez GJ, Buckler E, Doebley J. 2002.
A single domestication for maize shown by multilocus microsatellite genotyping. Proceedings of the National Academy of Sciences of the United States of America
99:6080–6084DOI 10.1073/pnas.052125199.
Moscone EA, Baranyi M, Ebert I, Greilhuber J, Ehrendorfer F, Hunziker AT. 2003.
Analysis of nuclear DNA content inCapsicum(Solanaceae) by flow cytometry and Feulgen densitometry.Annals of Botany92:21–29DOI 10.1093/aob/mcg105.
Mowforth MA, Grime JP. 1989.Intra-population variation in nuclear-DNA amount,
cell-size and growth-rate in Poa annua L.Functional Ecology3:289–295 DOI 10.2307/2389368.
Muñoz Diez C, Gaut BS, Meca E, Scheinvar E, Montes-Hernandez S, Eguiarte L,
Tenaillon MI. 2013.Genome size variation in wild and cultivated maize along
altitudinal gradients.New Phytologist199:264–276 DOI 10.1111/nph.12247.
Muñoz Diez C, Vitte C, Ross-Ibarra J, Gaut BS, Tenaillon MI. 2012. Using nextgen
sequencing to investigate genome size variation and transposable element content. In: Casacuberta M-AGaJ, ed.Plant transposable elements. Topics in current genetics, vol. 24. Berlin Heidelberg: Springer, 41–58.
Petrov DA. 2001.Evolution of genome size: new approaches to an old problem.Trends in
Genetics17:23–28DOI 10.1016/S0168-9525(00)02157-0.
Raj A, Stephens M, Pritchard JK. 2014.fastSTRUCTURE: variational inference of
population structure in large SNP data sets.Genetics197:573–U207 DOI 10.1534/genetics.114.164350.
Rayburn AL, Dudley JW, Biradar DP. 1994.Selection for early flowering results in
simultaneous selection for reduced nuclear-DNA content in maize.Plant Breeding
Realini MF, Poggio L, Camara-Hernandez J, Gonzalez GE. 2015.Intra-specific variation in genome size in maize: cytological and phenotypic correlates.Annals of Botany Plants8:plv138DOI 10.1093/aobpla/plv138.
Sadok W, Boussuge B, Welckeir C, Tardieu F. 2007a.A modelling approach to genotype
x environment interaction.Scale and Complexity in Plant Systems Research: Gene– Plant–Crop Relations21:77–91DOI 10.1007/1-4020-5906-X_7.
Sadok W, Naudin P, Boussuge B, Muller B, Welcker C, Tardieu F. 2007b.Leaf growth
rate per unit thermal time follows QTL-dependent daily patterns in hundreds of maize lines under naturally fluctuating conditions.Plant Cell and Environment
30:135–146DOI 10.1111/j.1365-3040.2006.01611.x.
Salah HBH, Tardieu F. 1997.Control of leaf expansion rate of droughted maize plants
under fluctuating evaporative demand—a superposition of hydraulic and chemical messages?Plant Physiology114:893–900 DOI 10.1104/pp.114.3.893.
Smarda P, Bures P. 2010.Understanding intraspecific variation in genome size in plants.
Preslia82:41–61.
Smarda P, Bures P, Horova L. 2007.Random distribution pattern and non-adaptivity
of genome size in a highly variable population ofFestuca pallens.Annals of Botany
100:141–150DOI 10.1093/aob/mcm095.
Sung W, Ackerman MS, Miller SF, Doak TG, Lynch M. 2012.Drift-barrier hypothesis
and mutation-rate evolution.Proceedings of the National Academy of Sciences of the United States of America109:18488–18492DOI 10.1073/pnas.1216223109.
Tardieu F, Reymond M, Hamard P, Granier C, Muller B. 2000.Spatial distributions of
expansion rate, cell division rate and cell size in maize leaves: a synthesis of the effects of soil water status, evaporative demand and temperature.Journal of Experimental Botany51:1505–1514DOI 10.1093/jexbot/51.350.1505.
Vigouroux Y, Jaqueth JS, Matsuoka Y, Smith OS, Beavis WF, Smith J, Doebley J. 2002.
Rate and pattern of mutation at microsatellite loci in maize.Molecular Biology and Evolution19:1251–1260DOI 10.1093/oxfordjournals.molbev.a004186.
Whitney KD, Garland Jr T. 2010.Did genetic drift drive increases in genome
complex-ity?PLoS Genetics6(8):e1001080DOI 10.1371/journal.pgen.1001080.
Yu J, Pressoir G, Briggs WH, Vroh Bi I, Yamasaki M, Doebley JF, McMullen MD, Gaut
BS, Nielsen DM, Holland JB, Kresovich S, Buckler ES. 2006.A unified mixed-model
method for association mapping that accounts for multiple levels of relatedness. Nature Genetics38:203–208DOI 10.1038/ng1702.
Zhao W, Canaran P, Jurkuta R, Fulton T, Glaubitz J, Buckler E, Doebley J, Gaut B,
Goodman M, Holland J, Kresovich S, McMullen M, Stein L, Ware D. 2006.Panzea: