QUANTITATIVE VARIATION IN THE TROPICAL MAIZE
POPULATION, ESALQ-PB1
João Antonio da Costa Andrade1*; José Branco de Miranda Filho2
1
UNESP/FE - Depto. de Biologia e Zootecnia, C.P. 31 - 15385-000 - Ilha Solteira, SP - Brasil. 2
USP/ESALQ - Depto. de Genética, C.P. 83 - 13418-900 - Piracicaba, SP - Brasil. *Corresponding author <[email protected]>
ABSTRACT: Good yield and intermediate plant height, ear height, and tassel size characterize the maize population ESALQ-PB1 as an outstanding breeding population. Estimates of genetic parameters are reported for 13 traits: plant height (PH), ear height (EH), ear placement (EP), tassel length (TL), tassel weight (TW), tassel branch number (TB), ear weight (EW), total grain weight (GW), ear length (EL), ear diameter (ED), kernel row number (RN), kernel number per row (KR) and prolificacy (PR). Results refer to one location and one year. Genetic variation was detected for all traits, and the estimates of the additive genetic variance are presented. The coefficients of heritability (individual basis) varied from 0.14 to 0.72 and were considered high for PH, EH and TB; intermediate for EP, TL, TW, EL, EP, ED and RN, and low for EW, GW, KR and PR. The coefficient of heritability (progeny mean basis) showed approximately the same trend and varied from 0.40 to 0.75. The highest expected gain from selection was for TB (27% per cycle) under mass selection and for TW (16.4%) under progeny selection; the lowest expected gain was for ED either for mass selection (1.9%) or progeny selection (2.9%). Additive correlation coefficients (rA) of 0.5<rA<0.6 were found for PH or EH and yield traits (EW and GW) and its components EL and KR, and 0.10<rA<0.44 for PH or EH and tassel traits. For the tassel traits the highest correlation was rA = 0.63 (TB.TW). EP was positively correlated with TB, TW, PH, EH and PR; and negatively correlated with ED and RN. The expected correlated responses in several traits after selection for GW, EH and TB are given. Key words: genetic parameters, genetic variability, heritability, recurrent selection
VARIAÇÃO QUANTITATIVA NA POPULAÇÃO
TROPICAL DE MILHO, ESALQ-PB1
RESUMO: A boa produtividade e os valores intermediários para altura da planta e altura da espiga caracterizam a população de milho ESALQ-PB1 como agronomicamente promissora. São relatadas estimativas de parâmetros para 13 caracteres: altura da planta (PH), altura da espiga (EH), posição relativa da espiga (EP), comprimento do pendão (TL), peso do pendão (TW), número de ramificações do pendão (TB), peso de espigas (EW), peso de grãos (GW), comprimento da espiga (EL), diâmetro da espiga (ED), número de fileiras de grãos (RN), número de grãos por fileira (KR) e prolificidade (PR). Os resultados se referem a um único ambiente (um local e um ano). Foi detectada variação genética para todos os caracteres, e são apresentadas estimativas da variância genética aditiva. Os coeficientes de herdabilidade (indivíduos) variaram de 0,14 a 0,72 e foram considerados altos para PH, EH e TB; intermediários para EP, TL, TW, EL e ED, e baixos para EW, GW, KR e PR. O coeficiente de herdabilidade para médias de progênies mostrou aproximadamente a mesma tendência, variando de 0,40 a 0,75. O maior ganho esperado por seleção foi para TB (27% por ciclo) sob seleção massal e para TW (16,4%) por seleção entre progênies; o menor ganho esperado foi para ED, tanto por seleção massal (1,9%) como por seleção entre progênies (2,9%). Coeficientes de correlação aditiva (rA) 0.5<rA<0.6 foram observados para PH ou EH e para os caracteres de produção (EW e GW) e seus componentes EL e KR, e 0,10<rA<0,44 para PH ou EH e caracteres do pendão. Para os caracteres do pendão a maior correlação foi rA = 0,63 (TB.TW). EP foi correlacionada positivamente com TB, TW, PH, EH e PR; e negativamente correlacionada com ED e RN. As respostas correlacionadas esperadas em diversos caracteres após seleção para GW, EH e TB são apresentadas.
Palavras-chave: parâmetros genéticos, variabilidade genética, herdabilidade, seleção recorrente
INTRODUCTION
Maize is a typically allogamous species with prevalence of cross pollination. The amount of
female gametes unite at random. The probability of an individual in the next generation be homozygous by descent is 1/2N (N is the population size) and a popu-lation sufficiently large can be maintained in equilib-rium if no other forces (mutation, gamete migration, selection, random drift) lead to departure from its ba-sic structure.
The genetic structure of a maize population under panmixy is very complex (Shull, 1908). For quantitative traits that are polygenically inherited the complexity arises from the great number of genotypes within a population and from allelic, non-allelic and genotype by environment interactions. For breeding purposes, the genetic structure of maize populations for quantitative traits has been studied on the basis of statistical parameters (e.g., mean, variance, correlation coefficient, and others). The basic concepts and sta-tistical methods for estimation of genetic parameters are given by Cockerham (1963), Hallauer & Miranda Filho (1995), Falconer & Mackay (1996), Lynch & Walsh (1997) and Cruz & Carneiro (2003).
Parameter estimates refer to a particular popu-lation of genotypes (reference popupopu-lation) for a defined population of environmental effects (Cockerham, 1963); the estimates can, however, be compared among populations for their relative magnitudes and be used as a guide for effective handling in breeding pro-grams. Parameter estimates for some important traits in maize populations were summarized in several op-portunities (Miranda Filho, 1985; Vencovsky et al., 1987; Hallauer & Miranda Filho, 1995). More recently, genetic parameters also estimate for others specific populations by Paterniani et al. (2004), Carvalho et al. (2005), Yazdi-Samadi et al. (2004), El-Bagoury et al. (2005), Zivanovic et al. (2005) and Salami et al. (2007).
The purpose of this study was to report about parameter estimates of 13 quantitative traits in the maize population ESALQ-PB1 and its potential for breeding. Particular attention was given to tassel branch number and ear height because ESALQ-PB1 was used as a base population for divergent selection of these traits.
MATERIAL AND METHODS
The reference population, ESALQ-PB1, is a composite formed from crosses among seven short plant varieties (Miranda Filho, 1974). After three gen-erations of recombination and homogenization, it has undergone one cycle of stratified mass selection and one cycle of half-sib family selection. One thousand half-sib families were evaluated in the last cycle and high selection intensity (2%) was used. After recom-bination of the selected 20 half-sib families, 147
open-pollinated ears (half-sibs) were used to represent the base population of this study.
The 147 half-sib families were evaluated in three 7 × 7 lattice experiments with four replications, at Piracicaba-Brazil (22°39’ S and 47°35’ W, and 597 m of altitude), in 1978/79. Plots were 5 m long, spaced 1 m apart, with 25 plants after thinning. The follow-ing traits were taken for analysis: PH - plant height (m); EH - ear height (m); EP - ear placement; TL - tassel length (cm); TW - tassel weight (g); TB - tassel branch number; EW - ear weight (g); GW - grain weight (g); EL - ear length (cm); ED - ear diameter (cm); RN - kernel row number; KN - kernel number per row; and PR - prolificacy. The traits EL, ED, RN, KN and PR were taken in only two experiments (98 families). Actually, this is a selection project and the experimental layout was designed according to this purpose. The quantitative traits analyzed herein took only part of the experiments, so that a sample of size five was taken within plots to measure plant, tassel or ear characteristics.
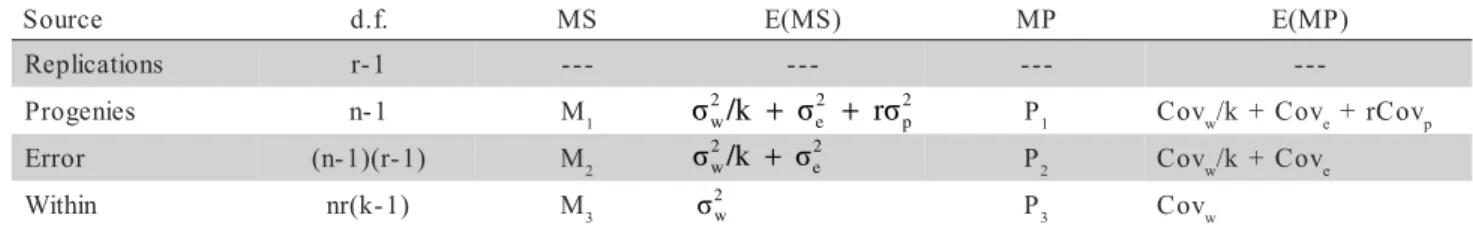
Because the low efficiency of the lattice sign in relation to the randomized complete block de-sign, all the analyses of variance and covariance were performed as complete block design with plot means and the variation within plots was included. The basic model is:
Yijk= m + pi+ bj+ eij+ sijk ,
where Yijk is the observation of the kth plant of the ith
progeny in the jth replication; m the overall mean; p i
the random progeny effect (mean: 0; variance: σ²p); bj the random block effect; eij the experimental error (mean: 0; variance: σ²e), and sijk the effect of the kth
plant (mean: 0; variance σ²w) in the ijth plot. The analy-ses of variance and covariance are shown in Table 1 with the mean squares (M1 and M2), mean products (P1 and P2) and their respective expectations in terms of variance and covariance components. The follow-ing estimates were obtained of the individual analyses grouping:
• Genetic variance among progenies..σˆ2p = (M1 - M2)/r
• Plot-to-plot environmental variance.. 2 e
ˆ
σ = M2 - M3/k
• Phenotypic variance within progenies... 2 w
ˆ
σ = M3
• Additive genetic variance... 2 A
ˆ
σ = 4(M1 - M2)/r
• Additive genetic covariance (traits x and y)
...CovA = 4(P1 - P2)/r
• Coefficient of heritability (individual) ...h2 = 2
A
σ /( 2
p
σ + 2
e
σ + σ2w) = σ2A/ 2
F
• Coefficient of heritability (progeny mean) ...h2
p = (M1 - M2)/M1
• Additive correlation coefficient...rA = CovAx.y/σAx.σAy
• Phenotypic (means) correlation coefficient
...rm = P1xy/(M1x.M1y)½
• Expected genetic gain: HS selection ...GHS = i h2
p (M1/r) 1/2
• Expected genetic gain: Mass selection
...GM = i h² σF
• Expected correlated response: HS selection
...RHS = i 41CovAx.y /(M1/r)1/2
• Expected correlated response: Mass selection ...RM = i CovAx.y / σFx
• Experimental coefficient of variation
...CVe (%) = 100 [M2]1/2/m
• Genetic coefficient of variation
...CVg (%) = 100 σˆp/m
• Index of variation... Iv = CVg/CVe
The estimates involving PH, EH, EP, TL, TW, TB, EW and GW, were calculated on basis in 147 fami-lies (three experiments). For EL, ED, RN, KN and PR such as its correlations with PH, EH, EP, TL, TW, TB, EW and GW, were considered only 98 families (two experiments).
RESULTS AND DISCUSSION
Means of half-sib families and their respective ranges for 13 traits in the maize population ESALQ-PB1 are shown in Table 2. For plant height (PH) and ear height (EH) the population should be classified as intermediate, as compared to other brazilian popula-tions. Ear placement (EP) indicates that on the aver-age the ear is located in the upper half of the stalk, but the range of variation (0.475 to 0.535) indicates that EP can be reduced through selection. The tassel characteristics did not differ greatly from other popu-lations (Geraldi et al., 1985; Souza Jr. et al., 1985). Tassels had an average length (TL) of 40.9 cm and the average weight (TW) was 5.9 g. The tassel branch number (TB) deserves special attention because it is the primary trait used in the selection for tassel size
s t i a r
T mean min. max. CVe(%) CVg(%) Iv
) m c ( t h g i e h t n a l
P 231.3 194.5 257.7 4.38 3.80 0.869
) m c ( t h g i e h r a
E 124.0 100.8 146.0 7.21 5.33 0.740
t n e m e c a l p r a
E 0.535 0.475 0.593 5.29 3.02 0.570
) m c ( h t g n e l l e s s a
T 40.90 36.09 45.99 5.02 4.10 0.815
) g ( t h g i e w l e s s a
T 5.87 3.92 7.98 13.2 10.9 0.827
r e b m u n h c n a r b l e s s a
T 18.4 12.6 23.8 11.4 9.99 0.873
) g ( t h g i e w r a
E 185.5 142.6 234.7 14.6 5.92 0.406
) g ( t h g i e w n i a r
G 150.8 110.1 192.6 15.7 6.34 0.403
) m c ( h t g n e l r a
E 17.54 13.88 19.77 6.71 4.63 0.690
) m c ( r e t e m a i d r a
E 4.81 4.47 5.13 3.89 2.18 0.560
r e b m u n w o r l e n r e
K 14.11 12.59 16.79 5.67 4.76 0.840
w o r r e p s l e n r e
K 35.3 26.4 41.4 9.17 4.67 0.509
y c a c i f i l o r
P 1.12 1.00 1.40 14.2 5.93 0.416
Table 2 - Mean, range (minimum and maximum), coefficients of variation (CVe: experimental; CVg: genetic) and index of variation (Iv) for 13 traits of the maize population ESALQ-PB1.
Table 1 - Analysis of variance and covariance for individual experiments.
MS and MP: mean squares and mean products; n, r, k: number of progenies, replications and plants per plot, respectively; k was not constant for all traits
e c r u o
S d.f. MS E(MS) MP E(MP)
s n o i t a c i l p e
R r-1 --- --- --- --
-s e i n e g o r
P n-1 M1 P1 Covw/k+Cove+rCovp
r o r r
E (n-1)(r-1) M2 P2 Covw/k+Cove
n i h t i
W nr(k-1) M3 P3 Covw
2 p 2 e 2
w/k σ rσ
σ + +
σ /k σ 2 e 2 w +
(Mock & Pearce, 1975). Tassel branch number aver-aged 18.4 branches per tassel, varying from 12.6 to 23.8, which would be considered as intermediate val-ues as compared to other populations. Average of 26.5 branches per tassel was reported for 338 samples rep-resenting races of maize from several countries, vary-ing from 17.7 (Bolivian races) to 42 (Colombian races) (Paterniani, 1981). Averages of 18.1, 22.4 and 18.7 branches/tassel in three broad-base populations (Centralmex, Flint Composite and Dent Composite, re-spectively) also were reported (Geraldi et al., 1985). Variation from 17.5 to 33.2 for TB are found in the maize population SUWAN (Souza Jr. et al., 1985). Av-erage of 15.8 branches/tassel, varying from 6.9 to 22.5, were found among 15 exotic populations (Miranda Filho, 1992), while the mean for the population ESALQ-PB1 was 20.4.
The means for EW (185.5 g) and GW (150.8 g) per plant were greater than the average of 107 mean estimates of Brazilian populations (Miranda Filho, 1985) and the population RPM (Resistant to
Phaeosphaeria maydis) and RET (Resistant to
Exserohilum turcicum) (Miranda Filho & Gorgulho,
2003) and Composite I-Mo (Paterniani et al., 2004). The greater range of variation (Table 2) for these traits is an expression of their high genetic variability, how-ever other populations of broad genetic basis present larger estimates (Cárdenas, 2005; El-Bagoury et al., 2005). The EL varied from 13.9 to 19.8 cm,
averag-ing 17.5 cm. For ED a small variation (4.5 to 5.1 cm) was observed, while the RN and KR showed a wide variability, ranging from 12.6 to 16.8 and 26.4 to 41.4, respectively. Prolificacy, as measured by the average number of ears per plant under a population density of 50,000 plants ha-1, varied from 1.0 to 1.4 among
half sib families.
The experimental coefficient of variation (CVe) varied from 3.9% to 15.7% among traits and the ge-netic coefficient of variation (CVg) ranged from 2.2% to 10.0% (Table 2). The ratio Iv = CVg/CVe (Vencovsky, 1987; Vencovsky & Barriga, 1992) des-ignated as index of variation (Valois, 1982) showed
higher estimates (0.7 to 0.9) for PH, EH, TL, TW, TB, EL and RN, while smaller estimates (0.4 to 0.6) were found for EP, EW, GW, ED, KR and PR. Estimates of Iv for EW (0.7 and 0.5), PH (0.4 and 0.7) and EH (0.5 and 0.7) in two population (Miranda Filho & Gorgulho, 2003), were similar those showed in this study and also the estimates for a dwarf population in reduced spacing (Candido, 2005). However, estimates greater than one for this traits in dwarf population evaluated in density of 80,000 plants/ha were obtained for Garcia (2005). Higher Iv estimates indicate greater opportunities for selection, and Iv>1 would indicate a favorable condition for selection purposes (Vencovsky, 1987).
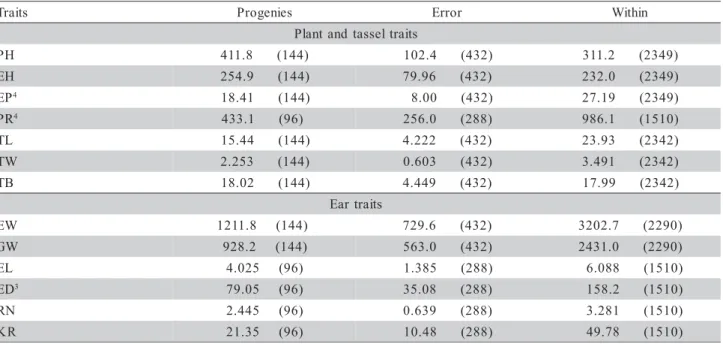
In the analysis of variance (Table 3) signifi-cant variation was detected for all traits, thus
allow-s t i a r
T Progenies Error Within
s t i a r t l e s s a t d n a t n a l P
H
P 411.8 (144) 102.4 (432) 311.2 (2349)
H
E 254.9 (144) 79.96 (432) 232.0 (2349)
P
E 4 18.41 (144) 8.00 (432) 27.19 (2349)
R
P 4 433.1 (96) 256.0 (288) 986.1 (1510)
L
T 15.44 (144) 4.222 (432) 23.93 (2342)
W
T 2.253 (144) 0.603 (432) 3.491 (2342)
B
T 18.02 (144) 4.449 (432) 17.99 (2342)
s t i a r t r a E
W
E 1211.8 (144) 729.6 (432) 3202.7 (2290)
W
G 928.2 (144) 563.0 (432) 2431.0 (2290)
L
E 4.025 (96) 1.385 (288) 6.088 (1510)
D
E 3 79.05 (96) 35.08 (288) 158.2 (1510)
N
R 2.445 (96) 0.639 (288) 3.281 (1510)
R
K 21.35 (96) 10.48 (288) 49.78 (1510)
Table 3 - Analysis of variance (mean squares and degrees of freedom between parenthesis) for traits plant height (PH), ear height (EH), ear placement (EP), tassel length (TL), Prolificacy (PR), tassel weight (TW), tassel branch number (TB), ear weight (EW), grain weight (GW), ear length (EL), ear diameter (ED), kernel row number (RN) and kernels per row (KR), of the maize population ESALQ-PB1.
ing estimates of variance components and other pa-rameters (Table 4). The estimates of the additive ge-netic variance for PH (309.3 cm²) and EH (175.0 cm²) did not differ greatly from the average (321.0 and 218.0 cm², respectively) of 16 estimates summarized by Miranda Filho (1985) in brazilian populations, but smaller than seven populations (972.4 cm2 and 749.2
cm2), evaluated by Cárdenas (2005). The estimates
were, however, greater for PH and about the same for EH in relation to 45 estimates summarized by Hallauer & Miranda Filho (1995). The additive variance for GW also was greater (365.2 g²) as compared to the aver-age (306.0 g²) of 36 populations reported by Miranda Filho (1985), for CMS population (Carvalho et al., 2002) and CPATC-3 population (Carvalho et al., 2003). Estimates of 854.0 g2 and 865.0 g2, same after five
and six selection cycles in BR5011 population, were obtained by Carvalho et al. (2000). The same level of variability was also observed for EW that was smaller than obtained by Miranda Filho & Gorgulho (2003), Paterniani et al. (2004) and Cárdenas (2005). The ad-ditive variance for EL (2.64 cm²) and for ED (0.044 cm²) were greater and similar as compared to the av-erage (1.52 cm², 0.046 cm², respectively) of 36 popu-lations (Hallauer & Miranda Filho, 1995). The estimate for PR (0.018), however was lower than the average (0.046) reported by Hallauer & Miranda Filho (1995). The estimates of the additive genetic variance for the
tassel traits were 11.2 cm², 1.65 g² and 13.6 for TL, TW, and TB, respectively. The estimate for TB (13.6) was smaller than that reported (18.9) by Kassouf & Miranda Filho (1986) for ESALQ-PB1, but was greater than estimates for three different broad base popula-tions reported by Geraldi et al. (1985). Additive vari-ance estimates for TB varied from 4.0 to 53.1 in 40 estimates summarized by Araújo (1992), who found an estimate of 15.4 for ESALQ-PB1. For RN and KR the estimated additive variance were 0.018 and 10.9, respectively.
The estimates of the coefficients of heritabil-ity on an individual plant basis (Table 4) varied from 0.141 to 0.721 and were higher for PH, EH, and TB, intermediate for EP, TL, TW, EL, ED, and RN, and low for EW, GW, KR, and PR. The heritability esti-mates on progeny mean basis followed approximately the same trend and varied from 0.394 to 0.753, show-ing that some traits such GW and the yield compo-nents KR and PR can be more effectively selected on the basis of progeny means, while others exhibiting high individual heritability can be effectively selected on the basis of phenotypic expression. In general, the heritability estimates did not differ from estimates summarized by Geraldi et al. (1985), Miranda Filho (1985), Souza Jr. et al. (1985), Hallauer & Miranda Filho (1995) and Miranda Filho & Gorgulho (2003). For PH, EH, PR, EW and GW, estimates consistently
n i a g d e t c e p x E
s t i a r
T h2 G
H % GM %
H
P 309.3 0.721 0.751 13.4 5.78 26.2 11.3
H
E 175.0 0.566 0.686 9.62 7.76 17.4 14.1
P
E 5 104.1 0.322 0.565 0.02 3.98 0.03 6.00
L
T 11.22 0.429 0.727 2.51 6.13 1.92 4.71
W
T 1.65 0.433 0.732 0.96 16.4 0.74 12.6
B
T 13.57 0.610 0.753 2.81 15.2 5.05 27.4
W
E 482.1 0.141 0.398 12.1 6.55 7.24 3.90
W
G 365.2 0.141 0.394 10.5 6.98 6.29 4.17
L
E 2.640 0.382 0.656 1.15 6.58 0.88 5.02
D
E 4 439.7 0.255 0.556 0.14 2.85 0.09 1.93
N
R 1.805 0.486 0.738 1.01 7.18 0.82 5.83
R
K 10.86 0.205 0.509 2.06 5.84 1.31 3.71
R
P 4 177.1 0.163 0.409 0.07 6.64 0.09 8.41
Table 4 - Estimates of the additive genetic variance ( 2 A
σ ), coefficients of heritability (h2 to individual and h2m to progeny
mean basis) and expected gain from selection (GH to half-sib family selection and GM to mass selection) for the traits plant height (PH), ear height (EH), ear placement (EP), tassel length (TL), Prolificacy (PR), tassel weight (TW), tassel branch number (TB), ear weight (EW), grain weight (GW), ear length (EL), ear diameter (ED), kernel row number (RN) and kernels per row (KR), of the maize population ESALQ-PB1.
4, 5 - Estimates of 2
A
σ multiplied by 104 and 105, respectively. G
H - 10%: both sexes; GM - 10% for both sexes for PH, EH, TB and PR and for female sex for other traits.
2 A
σ h2
greater were obtained by Candido (2005), Cárdenas (2005) and Garcia (2005). For GW, similar estimates were obtained in the BR 5011, CMS 35 and CPATC-3 brazilian populations (Carvalho et al., 2000, 2002 and 2003). All the estimates presented herein refer to only one environment (one location and one year) so that they may be overestimated by an amount proportional to the genotype by environment interaction when con-sidering a sample of environments represented by sev-eral locations and/or years.
The expected gains from selection (Table 4) re-flect, in most of the traits, their estimates of heritabil-ity; i.e., traits that exhibited higher heritability showed
higher predicted gains for both mass selection and prog-eny selection. The greatest predicted gain from mass selection was for TB (27% per cycle) and from prog-eny selection was for TW (16.4% per cycle). The low-est expected gain was for ED from either mass selec-tion (1.9%) or progeny selecselec-tion (2.8%). When com-paring mass selection with progeny selection on a per cycle basis, the mass selection was expected to be more effective for PH (11.3 vs. 5.8%), EH (14.1 vs. 7.8%) and TB (27.4 vs. 15.2%). PH, EH, and TB had the high-est high-estimates for heritability coefficient and index of variation. The same comparison indicated progeny se-lection as more effective for TW (12.6 vs. 16.4%), EW (4.0 vs. 6.5%) and GW (4.2 vs. 7.0%). TW, GW, and EW had lower heritability estimates and are selected af-ter flowering; i.e., for the female sex only. For the other traits, the expected gains showed smaller differences between selection schemes.
The efficiency of mass selection for increasing GW, as based on expected gains, is relatively lower as compared to those reported by Ayala Osuna (1977), Rissi (1980) and Bianco (1984) for other populations. Progeny selection, however, was more effective as re-ported by Souza Jr. (1983), Bianco (1984), Santos & Naspolini Filho (1986), Candido (2005), Garcia (2005) and Carvalho et al. (2005). The realized gains tend to be lower than the expected ones, as indicated by the results summarized by Hallauer & Miranda Filho (1995), which varied from 1.1 to 3.4% per cycle for mass se-lection and from 1.8% to 13.6% per cycle for progeny selection. In progeny selection scheme, the expected gain for PH and EH (5.8 and 7.8%) were smaller than other populations: 7.9 and 12.3% (Candido, 2005); 12.2 and 19.1% (Garcia, 2005); 10.3 and 15.5% (Cárdenas, 2005). For GW and PR the estimates of Candido (2005) (16.9 and 11.1%) and Garcia (2005) (23.7 and 12.4%) also were consistently greater than in the ESALQ-PB1 population (7.0 and 6.6%).
The expected gain for PH and EH in the base population ESALQ-PB1 indicated mass selection as more effective than selection among half-sib progenies.
The same trends were not observed by other authors when considering selection within progenies in the re-combination block (Ayala Osuna, 1977; Lordelo, 1982; Souza Jr., 1983; Soares Filho, 1987). For TB the effi-ciency of mass selection (27% per cycle) is comparable to that expected for the variety Centralmex (23.2% per cycle) and higher than that expected for Dent Compos-ite (10.9%) and Flint ComposCompos-ite (13.4%) in which, how-ever, a lower selection pressure (20%) was considered (Geraldi et al., 1985). Among the tassel traits, TB is in-dicated when selecting for tassel size due to its high heritability, and because it is easily evaluated in the field and highly correlated to TW (Geraldi et al., 1985).
The additive genetic correlation (rA) and phe-notypic correlation (rp) on progeny mean basis (Table 5) were positive for most pairs of traits. PH and EH had rA between 0.48 and 0.60 with yield traits (EW and GW) and its components (EL and KR), which are in a higher level in relation to reports summarized by Hallauer & Miranda Filho (1995) as well as in relation to some Brazilian populations (Lima, 1977; Lima & Paterniani, 1977; Crisóstomo, 1978; Sampaio, 1986; Soares Filho, 1987). Positive correlations, however, do not preclude selection for pairs of traits in opposite di-rection to be effective. PH and EH were positively cor-related to tassel traits with rA varying from 0.10 (EH.TL) to 0.44 (EH.TB). Also are reported positive genetic and phenotypic correlations between PH and EH with tassel traits (TB and TL) in the range of 0.135 to 0.438 (Farias Neto & Miranda Filho, 2001). For the tassel traits (Table 5) the highest correlation was for TB.TW (rA = 0.63). Correlation of TB and TW were positive and low (rA between 0.02 and 0.22) with the yield traits and higher (rA between 0.19 and 0.40) with EL. Both additive and phenotypic correlation between TW and TL was around 0.22, which are very close to the genetic correlation (0.232) reported by Farias Neto & Miranda Filho (2001).
# Numbers in black: estimated with 147 progenies (three experiments); otherwise: estimated with 98 progenies (two experiments).
Table 5 - Correlation coefficients (additive genetic above diagonal and phenotypic between means below diagonal) in combinations of traits plant height (PH), ear height (EH), ear placement (EP), tassel length (TL), prolificacy (PR), tassel weight (TW), tassel branch number (TB), ear weight (EW), grain weight (GW), ear length (EL), ear diameter (ED), kernel row number (RN) and kernels per row (KR), of the maize population ESALQ-PB1.
H
P EH EP TL TW TB EW GW EL ED RN KR PR
H
P --- 0.842 0.202 0.273 0.246 0.379 0.594 0.598 0.541 -0.267 -0.207 0.575 0.179
H
E 0.803 --- 0.698 0.101 0.386 0.436 0.506 0.497 0.513 -0.471 -0.338 0.480 0.318 P
E 0.184 0.730 --- -0.166 0.398 0.272 0.138 0.117 0.180 -0.528 -0.379 0.074 0.471 L
T 0.235 0.094 -0.106 --- 0.427 0.217 0.207 0.139 0.313 -0.128 0.006 0.023 -0.186
W
T 0.233 0.347 0.317 0.411 --- 0.626 0.084 0.023 0.188 0.012 0.015 0.009 -0.483 B
T 0.339 0.382 0.226 0.224 0.603 --- 0.216 0.207 0.398 -0.022 0.084 0.340 -0.406
W
E 0.417 0.378 0.149 0.165 0.223 0.178 --- 0.977 0.581 -0.038 -0.009 0.479 0.090 W
G 0.415 0.363 0.127 0.126 0.184 0.174 0.983 --- 0.556 -0.039 -0.034 0.518 0.086 L
E 0.437 0.394 0.108 0.298 0.258 0.318 0.591 0.569 --- -0.547 -0.227 0.648 -0.015
D
E -0.112 -0.233 -0.260 -0.047 0.116 0.023 0.254 0.257 -0.197 --- 0.407 0.266 -0.646 N
R -0.131 -0.219 -0.229 0.048 0.071 0.107 0.060 0.045 -0.138 0.415 --- 0.024 -0.210
R
K 0.435 0.355 0.056 0.062 0.133 0.235 0.563 0.575 0.664 0.020 0.022 --- -0.216 R
P 0.104 0.237 0.325 -0.081 -0.245 -0.225 0.245 0.222 -0.023 -0.369 -0.124 0.052 --
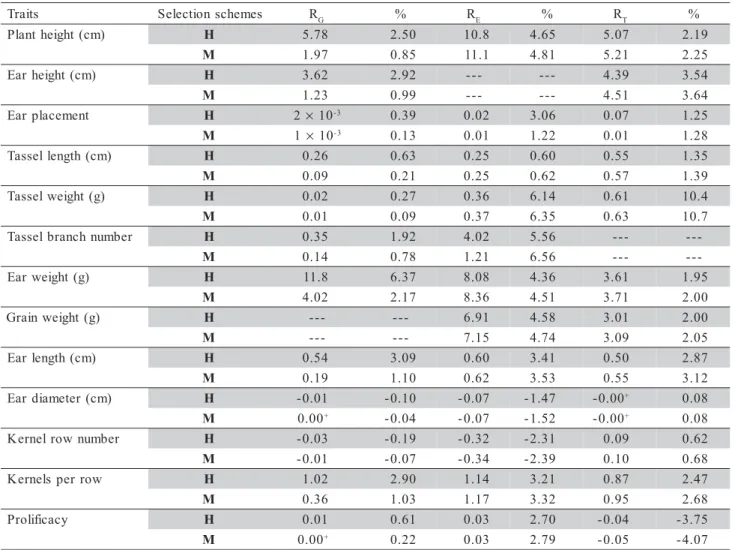
-Table 6 - Expected correlated response on other traits after mass selection (M) and half-sib family selection (H) for grain yield (RG), ear height (RE), and tassel branch number (RT) of the maize population ESALQ-PB1.
+approximated values; H- 10% both sexes; M- 10% female sex in R
G and for both sexes in RE and RT. s
t i a r
T Selectionschemes RG % RE % RT %
) m c ( t h g i e h t n a l
P H 5.78 2.50 10.8 4.65 5.07 2.19
M 1.97 0.85 11.1 4.81 5.21 2.25 ) m c ( t h g i e h r a
E H 3.62 2.92 --- --- 4.39 3.54
M 1.23 0.99 --- --- 4.51 3.64 t n e m e c a l p r a
E H 2× 10⁻³ 0.39 0.02 3.06 0.07 1.25
M 1× 10⁻³ 0.13 0.01 1.22 0.01 1.28 ) m c ( h t g n e l l e s s a
T H 0.26 0.63 0.25 0.60 0.55 1.35
M 0.09 0.21 0.25 0.62 0.57 1.39 ) g ( t h g i e w l e s s a
T H 0.02 0.27 0.36 6.14 0.61 10.4
M 0.01 0.09 0.37 6.35 0.63 10.7 r e b m u n h c n a r b l e s s a
T H 0.35 1.92 4.02 5.56 --- --
-M 0.14 0.78 1.21 6.56 --- -- -) g ( t h g i e w r a
E H 11.8 6.37 8.08 4.36 3.61 1.95
M 4.02 2.17 8.36 4.51 3.71 2.00 ) g ( t h g i e w n i a r
G H --- --- 6.91 4.58 3.01 2.00
M --- --- 7.15 4.74 3.09 2.05 ) m c ( h t g n e l r a
E H 0.54 3.09 0.60 3.41 0.50 2.87
M 0.19 1.10 0.62 3.53 0.55 3.12 ) m c ( r e t e m a i d r a
E H -0.01 -0.10 -0.07 -1.47 -0.00+ 0.08 M 0.00+ -0.04 -0.07 -1.52 -0.00+ 0.08 r e b m u n w o r l e n r e
K H -0.03 -0.19 -0.32 -2.31 0.09 0.62
M -0.01 -0.07 -0.34 -2.39 0.10 0.68 w o r r e p s l e n r e
K H 1.02 2.90 1.14 3.21 0.87 2.47
M 0.36 1.03 1.17 3.32 0.95 2.68 y c a c i f i l o r
P H 0.01 0.61 0.03 2.70 -0.04 -3.75
Another important trait for the characterization of a better plant architecture in maize is EP, which was additively correlated with TB (0.27), TW (0.40), PH (0.20), EH (0.70), ED (-0.53), RN (-0.38), and PR (0.47). Although the correlation of EP with TB is not high (0.27), direct selection for decreasing TB will af-fect EP in the same direction; in the same way, selec-tion for EH will affect both TB and EP.
The expected correlated responses in several traits through direct selection for GW, EH, and TB are shown in Table 6 for mass selection and progeny se-lection. If negative selection is practiced for TB or EH for better plant architecture, negative changes are ex-pected in GW (2.0% and 4.7% respectively); however, the changes in GW can be minimized by using no trun-cated selection to avoid undesirable genotypes for yield. A combined selection, including TB as selec-tion criterion for three populaselec-tions, based on the nega-tive correlation between GW and TB to increase the gain in GW were suggested by Geraldi et al. (1985). The low correlation between GW and TB observed in ESALQ-PB1 makes the selection for TB to be feasible without great changes in the mean yield. In a progeny selection program, selection in ESALQ-PB1 should be performed among progeny means for yield and within progenies for EH and TB. In other populations and en-vironments the expected correlated responses may be different as related by Garcia (2005) for dwarf maize in density of 80,000 plants/ha and reduced spacing. The expected correlated responses to family selection in GW was 8.8%, 15.1% and 9.5%, respectively for PH, EH and PR. With selection in EH, the expected correlated responses was 10.9%, 18.0% and 7.1%, for PH, GW and PR, respectively. The same tendency of larger correlated responses so that obtained in ESALQ-PB1, also was observed by Candido (2005).
The estimates of parameters related to genetic variability in the maize population ESALQ-PB1, shown in this study, refer to only one environment (one lo-cation and one year), so that a random model for en-vironment cannot be considered and the genotype ´ environment interactions are not taken into account.
REFERENCES
ARAÚJO, P.M. Variabilidade genética em subpopulações de milho (Zea mays L.) obtidas por seleção divergente. Piracicaba: USP/ ESALQ, 1992. 153p. Dissertação (Mestrado).
AYALA OSUNA, J. Avaliação da seleção massal estratificada combinada com despendoamento de plantas inferiores em duas populações de Zea mays L. (milho) e da heterose dos seus cruzamentos. Jaboticabal: UNESP/FCAV, 1977. 138p. Tese (Livre-Docência).
BIANCO, S. Avaliação do potencial genético de populações de milho (Zea mays L.) braquítico para o teor de óleo na semente. Piracicaba: USP/ESALQ, 1984. 98p. Dissertação (Mestrado).
CANDIDO, L.S. Potencial do Composto Flintisa Anão de milho para melhoramento em condições de espaçamento reduzido e na safrinha. Ilha Solteira: UNESP/FE, 2005. 93p. Dissertação (Mestrado).
CÁRDENAS, F.E.N. Valor genético de populações de milho adaptadas para a região sudoeste de Goiás. Piracicaba: USP/ ESALQ, 2005. 169p. Tese (Doutorado).
CARVALHO, H.W.L.; LEAL, M.L.S.; SANTOS, M.X. Estimativas de parâmetros genéticos na população de milho CMS 35 no Estado de Sergipe. Pesquisa Agropecuária Brasileira, v.37, p.1399-1405, 2002.
CARVALHO, H.W.L.; LEAL, M.L.S.; SANTOS, M.X.; PACHECO, C.A.P. Potencial genético da cultivar de milho BR 5011: sertanejo nos tabuleiros costeiros do nordeste brasileiro.
Pesquisa Agropecuária Brasileira, v.35, p.1169-1176, 2000.
CARVALHO, H.W.L.; LEAL, M.L.S.; SANTOS, M.X.; SOUZA, E.M. Estimativas de parâmetros genéticos na população de milho CPATC-3 em dois locais de Sergipe. Pesquisa Agropecuária Brasileira, v.38, p.73-78, 2003.
CARVALHO, H.W.L.; LEAL, M.L.S.; SANTOS, M.X.; SOUZA, E.M. Genetic parameters estimates in the maize variety BR 5033-Asa Branca in the State of Sergipe. Revista Científica Rural, v.10, p.95-101, 2005.
COCKERHAM, C.C. Estimation of genetic variances. In: HANSON, W.D.; ROBINSON, H.F. (Ed.) Statistical genetics and plant breeding. Washington: National Academy of Science, 1963. p.53-94. (NAS-NRC Publication, 982).
CRISÓSTOMO, J.R. Estimação de parâmetros genéticos visando seleção em dois compostos de milho (Zea mays L.). Piracicaba: USP/ESALQ, 1978. 71p. Dissertação (Mestrado).
CRUZ, C. D.; CARNEIRO, P.C.S. Modelos biométricos aplicados ao melhoramento genético. Viçosa: Editora UFV, 2003. 585p.
EL-BAGOURY, O.H.; EL-SHOUNY, K.A.; AL-AHMAD, S.A.; IBRAHIM, K.I.M. Genetic parameters of some agronomic traits in yellow maize under two planting dates. Arab Universities Journal of Agricultural Sciences, v.13, p. 309-325, 2005. FALCONER, D.S.; MACKAY, T.F.C. Introduction to quantitative genetics. 4 ed. Harlow: Pearson Education, 1996. 464p.
FARIAS NETO, A.L.; MIRANDA FILHO, J.B. Genetic correlation between traits in the ESALQ-PB1 maize population divergently selected for tassel size and ear height. Scientia Agricola, v.58, p.119-123, 2001.
GARCIA, F.Q. Potencial do Composto Flintisa Anão de milho para melhoramento em condições de alta densidade populacional. Ilha Solteira: UNESP/FE, 2005. 84p. Dissertação (Mestrado). GERALDI, I.O.; MIRANDA FILHO, J.B.; VENCOVSKY, R.
Estimates of genetic parameters for tassel characters in maize (Zea mays L.) and breeding perspectives. Maydica, v.30, p.1-14, 1985.
HALLAUER, A.R.; MIRANDA FILHO, J.B. Quantitative genetics in maize breeding. 2 ed. Ames: Iowa State University Press, 1995. 468p.
KASSOUF, A.L.; MIRANDA FILHO, J.B. Variabilidade genética e endogamia na população de milho ESALQ-PB1. In: CONGRESSO NACIONAL DE MILHO E SORGO, Maceió, 1984. Anais. Brasília: EMBRAPA-DDT, 1986. p.119-131. KIESSELBACH, T.A. Corn investigations. Nebraska Agricultural
Experiment Station Research Bulletin, v.20, p.5-151, 1922. LIMA, M.; PATERNIANI, E. Estimativas de parâmetros genéticos e fenotípicos em progênies de meios irmãos de milho (Zea mays
L.) ESALQ-VD2-MI-HSIII e suas implicações no melhoramento.
Relatório Científico do Instituto de Genética. ESALQ-USP, v.11, p.84-89, 1977.
LIMA, T.S.O. Avaliação das capacidades geral e específica de combinação e correlação entre caracteres em oito populações de milho (Zea mays L.). Viçosa: UFV, 1977. 71p. Dissertação
LORDELO, J.A.C. Parâmetros genéticos das populações de milho Piranão VD-2 e Piranão VF-1. Piracicaba: USP/ESALQ, 1982. 63p. Dissertação (Mestrado).
LYNCH, M.; WALSH, B. Genetics and analysis of quantitative traits. Sunderland: Sinauer, 1997. 980p.
MIRANDA FILHO, J.B. Breeding methodologies for tropical maize. In: BRANDOLINI, A.; SALAMINI, F. (Ed.) Breeding strategies for maize production improvement in the tropics. Rome: FAO, 1985. p.177-206.
MIRANDA FILHO, J.B. Cruzamentos dialélicos e síntese de compostos de milho (Zea mays L.) com ênfase na produtividade e no porte da planta. Piracicaba: USP/ESALQ, 1974. 116p. Tese (Doutorado).
MIRANDA FILHO, J.B. Exotic germplasms introduced in a Brazilian maize breeding program. Brazilian Journal of Genetics,
v.15, p.631-642, 1992.
MIRANDA FILHO, J.B.; GORGULHO, E.P. Yield potential and variability of two maize composites. Brazilian Journal of Maize and Sorghum, v.2, p.90-98, 2003.
MOCK, J.J.; PEARCE, R.B. An ideotype of maize. Euphytica,
v.24, p.613-623, 1975.
PATERNIANI, E. Influence of tassel size on ear placement in maize (Zea mays L.). Maydica, v.26, p.85-91, 1981. PATERNIANI, M.E.A.G.Z.; SAWAZAKI, E.; GALLO, P.B.;
LUDERS, R.R.; SILVA, R.M. Estimates of genetic parameters in a maize composite and potential for recurrent selection.
Crop Breeding and Applied Biotechnology, v.4, p.81-85, 2004.
RISSI, R. Estimação de parâmetros genéticos em duas subpopulações da variedade de milho (Zea mays L.) Piranão. Piracicaba: USP/ ESALQ, 1980. 87p. Dissertação (Mestrado).
SALAMI, A.E.; ADEGOKE, S.A.O.; ADEGBITE, O.A. Genetic variability among cultivars grown in Ekiti-State, Nigéria.
Middle-East Journal of Scientific Research, v.2, p.9-13, 2007.
SAMPAIO, N.F. Propriedades genéticas e potencial para o melhoramento dos compostos de milho (Zea mays L.)
ESALQ-PB4 e ESALQ-PB5. Piracicaba: USP/ESALQ, 1986. 105p. Dissertação (Mestrado).
SANTOS, M.X.; NASPOLINI FILHO, V. Estimativas de parâmetros genéticos em três ciclos de seleção entre e dentro de famílias de meios irmãos no milho (Zea mays L.) Dentado Composto
Nordeste. Brazilian Journal of Genetics, v.9, p.307-319, 1986.
SHULL, G.H. The composition of a field of maize. American Breeding Association Report, v.4, p.296-301, 1908. SOARES FILHO, W.S. Características fenotípicas e genéticas das
populações de milho (Zea mays L.) braquítico Piranão-VD2B e
Piranão-VF1B. Piracicaba: USP/ESALQ, 1987. 185p. Tese (Doutorado).
SOUZA JR., C.L. Variabilidade genética em milho e relações com a seleção recorrente intra e interpopulacional. Piracicaba: USP/ ESALQ, 1983. 151p. Tese (Doutorado).
SOUZA JR., C.L.; GERALDI, I.O.; ZINSLY, J.R. Influence of tassel size on the expression of prolificacy in maize (Zea mays L.).
Maydica, v.30, p.321-328, 1985.
VALOIS, A.C.C. Eficiência comparativa de quatro métodos de seleção em uma população melhorada de milho (Zea mays L.).
Piracicaba: USP/ESALQ, 1982. 119p. Tese (Doutorado). VENCOVSKY, R. Herança quantitativa. In: PATERNIANI, E.;
VIEGAS, G.P. (Ed.) Melhoramento e produção do milho.
Campinas: Fundação Cargill, 1987. cap.5, p.137-212. VENCOVSKY, R.; BARRIGA, P. Genética biométrica no
fitomelhoramento. Ribeirão Preto: Sociedade Brasileira de Genética, 1992. 496p.
VENCOVSKY, R.; MIRANDA FILHO, J.B.; SOUZA JR., C.L. Quantitative genetics and corn breeding in Brazil. In: WEIR, B.; EISEN, E.J.; GOODMAN, M.M.; NAMKOONG, N. (Ed.) Second International Conference on Quantitative Genetics.
Proceedings. Sunderland: Sinauer, 1987. cap.42, p.465-477. YAZDI-SAMADI, B.; ZALI, A.A.; TALEEI, A.; REZAIE, A.H.;
REZAIE, A.M.; ZEINNALI, H. An estimate of some genetic parameters in corn (Zea mays L.) base on diallel crossing system. Iranian journal of Agricultural Sciences, v.35, p.337-345, 2004.
ZIVANOVIC, T.; SECANSKI, M.; TODOROVIC, G. Components of genetic variability and heritability of the number of rows per ear in silage maize. Biotechnology in Animal Husbandry, v.21, p.109-121, 2005.