Investigating Performance Management in Postal
Systems
Thabiso John Mokoena¹ Charles Mbohwa²
Abstract—This paper investigates and discusses the practices of
performance management in postal organizations. The postal industry has in the past decade been faced with negative business performance where mail volumes have declined, customers lost to competition and revenue gradually declining. Including other factors, performance management has been identified as a significant question as to whether do challenges exist in the manner in which employees, resources and activities are connected to the overall achievement of goals and objectives set by postal systems and whether does performance management have an impact to the loss of business, customers and revenue. This study reveals that factors such leadership, organizational strategy, process and resource management should be regarded highly important and have a positive strong relationship towards effective performance management in postal systems.
Index Terms— Mail, Performance Management, Postal organizations
I. INTRODUCTION
As a result of global recessions, declined revenues, mail volume decline, inconsistent service quality, reduced customers, political constraints, technological diversity and a number of related negative factors, performance management has become one of the most pivotal areas of business review within postal systems. Storey and Sisson (1993) define
performance management as: “An interlocking set of policies and practices which have as their focus the enhanced
achievement of organizational objectives through a
concentration on individual performance.” Postal
organizations have in the past few decades to date embarked on implementing a number of related models and strategies, these included cost accounting models where they restructured their operations and refined their pricing strategies to being cost defined with the aim of maximizing profits at lower processing costs;
Manuscript received April 02, 2013; revised April 09, 2013. This paper was supported in part by the University of Johannesburg. Title: Investigating Performance Management in Postal Systems. T. J. Mokoena is currently with the University of Johannesburg, Department of Quality and Operations Management, Bunting Road Campus, P.O. Box 524, Auckland Park 2006; corresponding author: T. J. Mokoena; Tel: +27 (0) 21 590 5511; fax: +27 (0) 86 225 8785; e-mail: [email protected]/[email protected]. C. Mbohwa is currently with the University of Johannesburg, Department of Quality and Operations Management, Bunting Road Campus, P.O. Box 524, Auckland Park 2006; e-mail: [email protected]
the industry further looked into the practise of human resource management thereby implementing concepts such as relative performance evaluation (RPE) and performance appraisals (PA). A bigger problem emerged when traditional mailing systems started being replaced with the electronic age; postal organizations are struggling to secure new business while they are battling to retain their current markets due to fierce competition imposed by electronic communication that brings forth convenience, reduced cost, speed, reliability and eco friendliness to customers. With electronic communications taking charge, traditional physical mailing systems are replaced by alternative communiqué forms for instance statements sent to clients through emails, text messaging services, internet banking and a number of other types of instant communication which customers find appealing considering factors such as time saving, privacy, and cost effectiveness among many other benefits.
This paper therefore investigates and discusses the practices and implementation of performance management in postal organizations; the study has been chosen to focus on this industry because including other considerable reasons postal operators play a very significant role in the distribution of mail items including parcels globally. Having a look just at the South African context, postal services reach an area of more than 1.2 million square kilometres with deliveries having more than 2400 outlets and 5500 service points nationwide (SAPO, 2010). Postal organizations offer services such as Mail Business, Consumer Services, Logistics and Financial services; The mail business divisions usually offer activities related to effective and reliable processing and ensuring mail items and related parcels are delivered to intended customers, while logistics play a vital role in ensuring secured and accurate distribution of these items across all defined points, with financial services offering banking and related payment services for a variety of products, while consumer services cater for all point of sale services found in retail post offices where direct contact is made with clients daily.
It would be perceived complex because it is neither a framework nor a specific methodology but merely a strategic
approach to totally organizing an organization’s day to day
functions, people and activities structurally such that they produce the best possible outcomes for a longer term. From the postal point of view, the questions are:
o What areas of the postal business would performance
management be best implemented?
o Does performance management serve a significant role
towards sustaining the postal business?
o Has the postal industry been following correct approaches
to defining its objectives, visions and strategies and aligning them with its day to day activities thereby allowing them to maintain a strongest link towards organizational performance deliverables and targets?
II. METHODOLOGY
This study was conducted in a postal organization based in the southern region of the African continent and due to privacy
policy purposes the organization’s name was altered to ABC
Post. The methodology that was employed in this study was the mixed methods approach, which involved both qualitative and quantitative methods (Creswell, 2003). The qualitative aspect of this study involved informal interviews and observations that were conducted to capture a finer understanding of processes, activities and business of ABC Post and to test and refine the objectives of the study; the quantitative method involved conducting pilot studies, developing a structured questionnaire and statistical techniques were applied to analyze data. Both primary and secondary data were used for the study, primary data involved observations and drawing of questionnaires while secondary data involved sources such as databases, published papers from academic and industry sources, books, internet and journals. A total of 150 questionnaires were distributed to
ABC Post’s two divisions for data collection; the challenge
with this method was to check whether these divisions could be representative of the population of postal organization to allow generalization of findings to apply for the whole
industry. To overcome this, factors such as the organization’s
previous performance reports, policy and objectives and published empirical papers on similar topics were also referred to when drawing conclusions; furthermore Pallant (2005) also recommend that a sample of more than 100 participants is considered robust enough to make representation of larger populations in a study. A combination of probability, convenience and purposeful sampling was employed in that questionnaires were distributed to different levels of the organization where most responses were likely to be received. A total of 102 questionnaires were returned with responses from those that were distributed; they were analyzed with SPSS Version 15 software package to convert data into meaningful information and techniques that were followed are detailed on the results section.
III. RESULTS AND DISCUSSIONS
The results from this study were subjected to factor analysis so as to determine if any meaningful interrelations can be further extracted from the variables in question. SPSS version 15 was utilized and Principal component Analysis (PCA) method was used to extract data and a number of factors were determined from the questionnaire. The suitability of data for factor analysis was assessed before running PCA, the Kaizer Meyer-Oklin Measure of Sampling Adequacy (KMO) was used to verify that values are above the recommended value of .6 for
both factors and furthermore Bartlett’s tests of Sphericity
confirmed to be significant. The suitability of data was confirmed at KMO being .889 at .000 sig. value supporting the factorability of the correlation matrix. Extracted components from principal components analysis were also confirmed to be having eigenvalues exceeding 1 as recommended. A total variance of 50.3% was explained for two factors extracted; The Varimax with Kaizer Normalization rotation method was also used to identify highest loading factor and variables all questions and Direct Oblimin rotation used for second order factor matrix rotation.
Tests for Normality: Normality tests were also conducted for the study and confirmed prior to proceeding with detailed analyses. It is imperative for analysis that distributions be perused and confirmed for normality because the data is determined whether it is reliable, robust and justifiable for use.
Table I: Normality tests for two factors- F (1) Organizational Strategy, Leadership & Process Management; F (2) Human Resources variables
Table 1 indicates analyses conducted for two factors named F1 Organizational Strategy, Leadership & Process Management; F(2) Human Resources variables. Kolmogrov-Smirnov test was used for variables because the values on degrees of freedom were above 50; both factor 1 and factor 2 were not normally distributed at significant values of .034 and .003 respectively being both lower than the recommended sig.
value of (p ≥ .05) therefore violating the assumption of
normality. Pallant (2005:57) indicates that this is quite common in larger samples, being those with respondents from 100 to 150; for further scrutiny on normality, a box plot was also done below.
Statistic df Sig. Statistic df Sig.
F1- Org str, Ldrship & Process Management
.092 102 .034 .971 102 .023
F2- H R variables .112 102 .003 .968 102 .013 Tests of Normality
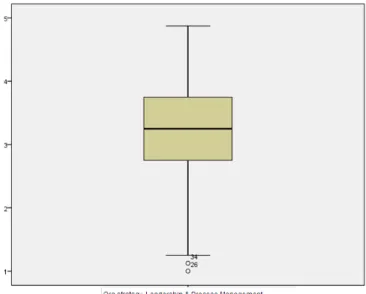
Fig 1: Box plot analysis on Organizational strategy, leadership & Process management factor
Figure 1 above provided an indication of the skewness of the box plot with a median value of 3.250, the mean value of 3.144 and just a little skewness value of -.534 and two outliers that are not at extreme points showing that although the distribution is negatively skewed, it should be considered reasonably normal.
Fig 2: Box plot analysis for the human resource factor
Figure 2 also indicated a little negative skewness at a median value of 3.792, mean value of 3.631 and skewness value of -.455 and a single outlier not at extreme points of the data set thereby the distribution being considered reasonably normal considering the sample size.
Correlation Analysis: Table 2 below indicates the correlation tests conducted between the two factors extracted from the
questionnaire; non-parametric correlation tests were
considered best for use since both factor’s scores were not
normally distributed as per normality tests above.The Spearman Rank Order Correlation (rho) was deemed applicable for use because more than one variable was involved in the analysis. Sizes of coefficients (r) or sizes of absolute values, the relationship between the variables in question, the sample sizes (N) and the level of significance [sig. (2-tailed)] were confirmed correct.
Table II: Correlation analysis for F1 Org strategy,
leadership & Process management and F2 human resource factors
Mean_SecB_F1 Mean_SecB_F2
Correlation Coefficient 1.000 0.724**
Sig. (2-tailed) .000
N 102 102
Correlation Coefficient 0.724** 1.000
Sig. (2-tailed) .000
N 102 102
Spearman's rho
F1_Org strategy, leadership & Process management
F2_human resources
A very strong positive correlation was observed between the organizational strategy, leadership and process management factor and the human resource factor (r=.724, n=102, p< .05); the result indicates an existence of a strong relationship between the two factors and further that respondents felt that organizational strategy, leadership and process management with human resources should be in line with and equally considered highly while approaches are being implemented for integrating them to performance management objectives and goals in the organization. The result also further show that a positive outcome of one factor in the organization will consequently result to a positive outcome of the other therefore careful consideration is important when dealing with the concepts at functional level. This means if postal organizations are to improve on their performance management systems; these factors need to be equally highly regarded and overlooking some while considering some will not be consistent and sustainable going forward.
Comparisons: This section discusses and establishes if differences existed between how groups of employees viewed subjects that were questioned by the study. Both parametric and non-parametric tests were considered however parametric tests were preferred to be applied since they are generally considered robust enough to produce reliable comparisons regardless of whether or not the distributions were normal. One way Analysis Of Variance approaches were also used for analysis and Multiple Comparisons were used where applicable as per statistical guidelines.
correct and accurate therefore will not affect the results of subsequent analyses.
ANOVA Tests
Parametric tests were used for comparing both age group and level of education factors, although a few were not normally distributed as per normality tests that were conducted earlier and not indicated in this case, parametric techniques were used because of their robustness. A one way between groups analysis of variance was run to explore the impacts of both
respondents’ age group and level of education on how they
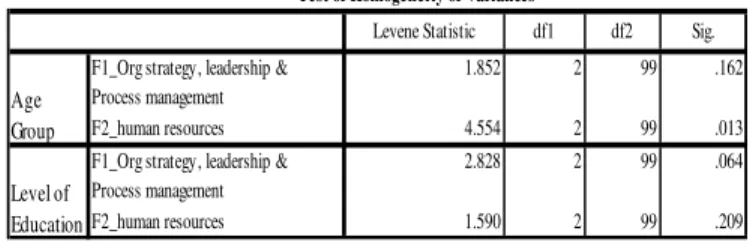
regarded factors of the study on questions related to performance management in ABC Post. For age group, subjects were classified into three groups (Group 1: 30 years or younger; Group 2: 31 to 40 years and group 3: older than 40 years) and for level of education, three subjects were also identified for measure (Group 1: below matric; Group 2: matric and group 3: tertiary level). The Levene’s homogeneity of variance tests were used to analyze the extent of equality on variance scores for both factors and the grouping measures; as indicated on table 4, the human resources factor resulted to inequality of variances by the significant value of .013 being lower than the recommended sig. value of .05 violating the assumption of equality on the age group leading to subsequent robust test of equality of means conducted to tests the differences. There was no significant difference found on the mean scores on the age group for the human resource factor at sig. value of .157.
Table III: Descriptives for Age Group and Level of Education variables (Comparisons)
Lo we r Bo u n d
Up p e r Bo u n d 3 0 ye a rs o r
yo u n g e r
2 5 3 .2 5 .6 8 5 .13 7 2 .9 7 3 .5 3 2 5
3 1 - 4 0 ye a rs 4 0 3 .0 7 .8 17 .12 9 2 .8 1 3 .3 3 1 4
Old e r th a n 4 0 ye a rs
3 7 3 .15 .9 0 5 .14 9 2 .8 5 3 .4 6 1 5
To ta l 10 2 3 .14 .8 16 .0 8 1 2 .9 8 3 .3 0 1 5
3 0 ye a rs o r yo u n g e r
2 5 3 .7 9 .6 16 .12 3 3 .5 3 4 .0 4 3 5
3 1 - 4 0 ye a rs 4 0 3 .6 8 .8 0 7 .12 8 3 .4 3 3 .9 4 2 5
Old e r th a n 4 0 ye a rs
3 7 3 .4 2 .9 4 2 .15 5 3 .10 3 .7 3 1 5
To ta l 10 2 3 .6 1 .8 2 6 .0 8 2 3 .4 5 3 .7 8 1 5
Be lo w Ma tric 16 2 .8 1 .8 7 3 .2 18 2 .3 5 3 .2 8 1 4
Ma tric 5 0 3 .2 5 .6 3 9 .0 9 0 3 .0 7 3 .4 4 2 5
Te rtia ry Le ve l
3 6 3 .14 .9 7 7 .16 3 2 .8 1 3 .4 7 1 5
To ta l 10 2 3 .14 .8 16 .0 8 1 2 .9 8 3 .3 0 1 5
Be lo w Ma tric 16 3 .11 .7 3 2 .18 3 2 .7 2 3 .5 0 2 5
Ma tric 5 0 3 .6 9 .7 2 0 .10 2 3 .4 8 3 .8 9 2 5
Te rtia ry Le ve l
3 6 3 .7 3 .9 3 5 .15 6 3 .4 1 4 .0 5 1 5
To ta l 10 2 3 .6 1 .8 2 6 .0 8 2 3 .4 5 3 .7 8 1 5 F1_ Org
s tra te g y, le a d e rs h ip & P ro c e s s ma n a g e me n t
F2 _ h u ma n re s o u rc e s
F1_ Org s tra te g y, le a d e rs h ip & P ro c e s s ma n a g e me n t
F2 _ h u ma n re s o u rc e s
De s c rip tiv e s
N Me a n S td . De via ti
o n S td . Erro r
9 5 % Co n fid e n c e In te rva l fo r Me a n
Min imu m
Ma ximu m
Table IV:Test of Homogeneity of Variances (Comparisons)
Levene Statistic df1 df2 Sig.
F1_Org strategy, leadership & Process management
1.852 2 99 .162
F2_human resources 4.554 2 99 .013
F1_Org strategy, leadership & Process management
2.828 2 99 .064
F2_human resources 1.590 2 99 .209
Test of Homogeneity of Variances
Age Group
Level of Education
ANOVA tests were further conducted for all variables that indicated equality of variances, this was to test if differences existed on the mean scores of both the groups and table 5 showed that there was a significant difference on the human resources factor at sig. value of .029 for the level of education group being statistically different since it was lower than the required (p > .05). This result is an indication that age was not a contributing factor in this regard on how respondents perceived organizational strategies, leadership and process management factor and the human resources factor in ABC Post, while the level of education construct was a factor that determined how respondents regarded the human resource approaches in the organization but not necessarily the
organization’s strategies, leadership and process management methodologies in ABC Post.
Table V: ANOVA analyses for Age Group and Level of Education variables (Comparisons)
S um of S qua re s df
Me a n
S qua re F S ig.
Be twe e n Groups
.508 2 .254 .377 .687
Within Groups
66.759 99 .674
Tota l 67.267 101
Be twe e n Groups
2.356 2 1.178 1.754 .178
Within Groups
66.504 99 .672
Tota l 68.860 101
Be twe e n Groups
2.383 2 1.192 1.818 .168
Within Groups
64.884 99 .655
Tota l 67.267 101
Be twe e n Groups
4.759 2 2.379 3.675 .029
Within Groups
64.101 99 .647
Tota l 68.860 101 ANO VA
Age Group
F1_Org s tra te gy, le a de rs hip & P roc e s s ma na ge me n t
F2_huma n re s ourc e s
Le ve l of Educ a tion
F1_Org s tra te gy, le a de rs hip & P roc e s s ma na ge me n t
Table VI: Robust tests for Age Group and Level of Education variables (Comparisons)
S ta tis tic d f1 d f2 S ig .
F1_ Org s tra te g y, le a d e rs h ip & P ro c e s s ma n a g e me n t
Bro wn -Fo rs yth e
.3 9 6 2 9 6 .5 7 6 .6 7 4
F2 _ h u ma n re s o u rc e s
Bro wn -Fo rs yth e
1.8 8 7 2 9 5 .3 9 8 .15 7
F1_ Org s tra te g y, le a d e rs h ip & P ro c e s s ma n a g e me n t
Bro wn -Fo rs yth e
1.6 2 2 2 5 4 .8 4 0 .2 0 7
F2 _ h u ma n re s o u rc e s
Bro wn -Fo rs yth e
3 .7 10 2 6 7 .9 8 2 .0 3 0
Ro b u s t Te s ts o f Eq u a lity o f Me a n s
Ag e Gro u p
Le ve l o f Ed u c a tio n
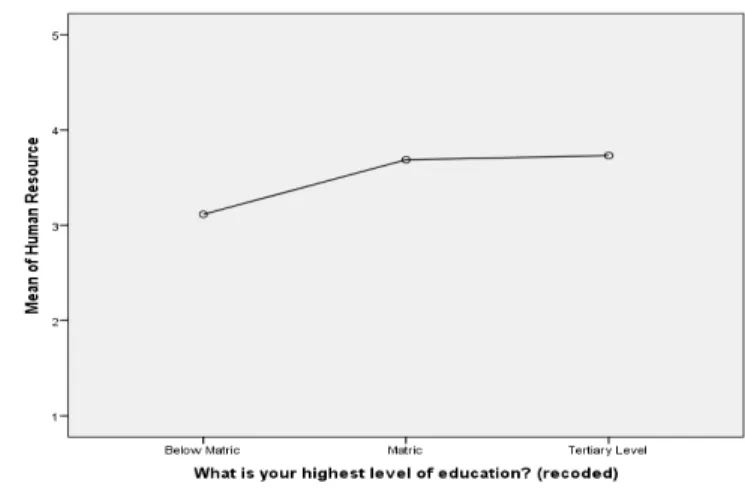
The statistical difference found on the human resources factor for the educational group from the ANOVA analysis dictated that a further analysis to identify specific groups that were different in perception was required as per statistical guidelines; the post-hoc multiple comparison using Scheffe test were done on table 7 and indicated a significant difference on the mean scores for the below matric respondents group (M=3.11, SD=.732) and respondents with the tertiary level qualifications (M=3.73, SD=.935). Respondents with matric qualifications (M=3.69, SD=.720) indicated no statistical difference with either below matric or tertiary level group of respondents.
Table VII: Multiple Comparisons for level of education
Lower Bound
Upper Bound Matric -.573 .231 .051 -1.15 .00 T ertiary Level -.617* .242 .043 -1.22 -.02
Below Matric .573 .231 .051 .00 1.15 T ertiary Level -.044 .176 .969 -.48 .39
Below Matric .617* .242 .043 .02 1.22
Matric .044 .176 .969 -.39 .48
Multiple C omparisons Dependent Variable: Mean_SecB_F2
Scheffe
(I) rA4.2
Mean Differen ce (I-J)
Std. Error Sig.
9 5 % Co n fid e n c e In te rva l
Below Matric
Matric
T ertiary Level
Fig 3: Multiple Comparisons for level of education
The mean plot at figure 3 also indicates the significant difference below matric being the lowest and tertiary group being highest; although there was an observation of the significant difference, the actual variation on the mean scores (3.11, 3.69, 3.73) was very small. It is therefore affirmed that a difference existed between how respondents with below matric and tertiary qualifications actually perceived human
resource factor’s impact towards performance management in
ABC Post.
Based on table 8, it was clearly observed that a significant amount of 47.5% of the total respondents felt that their
organization’s performance was generally good while 40.6%
were between neutral and disagreeing. A significant number of respondents totalling to 85.3% also indicated that they contribute positively to the performance results of their ABC Post, their responses were between agree and strongly agree scales of measure; it was also discovered that 43.1% of respondents agreed that they are encouraged to be involved in enhancing the performance of ABC Post while 24.5% strongly agreed. 51.5% of respondents did indicate that the performance of their organization was related to processes and activities while 25.7% were both disagreeing and strongly disagreeing.
An interesting indication was also observed when a total of 35.7% of respondents both disagreed and strongly disagreed to
being aware of ABC Post’s performance strategies while
41.6% both agreed and strongly agreed to being aware of them and 22.8% remained unsure; furthermore 41% of respondents
agreed that ABC Post’s performance strategies are aligned
with its goals and objectives whilst 32% were not really sure. A combination of respondents both disagreeing and strongly
disagreeing on management’s support of better employee
respondents both disagreed and strongly disagreed that there was sufficient communication while 29.5 both agreed and disagreed. It was also realized that 47.1% of the total respondent believed that ABC Post embarks on efforts to improve on performance management.
IV. CONCLUSIONS
The main conclusions drawn from the study are as follows:
The concept and practice of performance management
approaches is not only relevant to the business of postal organizations but remains pivotal and functionally inherent to the processes, activities and people responsible for day to day results achieved by the industry.
Efforts to performance management implementation have
already been established in the postal systems however the approaches and methodologies followed are not structured and guided by defined principles and therefore cannot be measured at functional level for improvements purposes
Effective performance management systems integrate
processes, activities with human factors and the combination of these factors should be directly linked to and result to organizational objectives and policies.
Respondents who are employees of ABC Post do consider
their involvement as critical to the organization’s
performance however are not very clear how their contribution serve significantly to the benefits of performance management. This indicates that a number of
factors are not properly addressed including
communication and total involvement towards high performance cultures.
Postal systems were observed to be faced with considerable performance challenges both internally and externally, Donahoe (2009:2) reveals the weakness of postal services in terms of workforce flexibility compared to other benchmarked industry competitors; a more rigid and structured approach to defining areas and activities of the business that are most significant to achieving organizational performance targets would be useful in that improvement strategies can always be implemented and monitored. Furthermore as Oruchub, et al
(2012) and Abernathy (2010:15) indicated, postal
organizations stand a very good opportunity of achieving desired performance results when detailed and involved methodologies are to be followed, the methodologies themselves should consider assessing the organization’s readiness prior to implementing any strategy and thereby follow a systematic guideline that will define all possible areas of improvements and identify risks and potential failures during implementation to eliminate unnecessary fruitless expenditures.
This study was focused and limited on investigating performance management in postal systems; more research
should be extended to have a look at other strategies in the service sector and their applicability on the postal business. More research should also be conducted on the possibilities of integrating courier services into the mail business in efforts to improve the performance of the industry; furthermore more attention should also be given in detail to areas such as electronic communications avenues and global liberalization of the industry as to whether they can be sustainable performance improvement strategies to the business.
REFERENCES
[1] Abernathy, W. B., (2010), A Comprehensive Performance Analysis and Improvement Method. Performance Improvement, vol 49, No 5. [2] Creswell, J. W. (2003). Research design: Qualitative, Quantitative and
mixed method approaches. Thousand Oaks, Ca: Sage.
[3] Donahoe, P., R. (2009). Benchmarking Postal Service Parcel Productivity. EN-MA-09-002
[4] Ochurub, M., Bussin, M., & Goosen, X. (2012). Organisational readiness for introducing a performance management system. SA Journal of Human Resource Management/SA Tydskrif vir Menslikehulpbronbestuur, 10(1), Art. #389, 11 pages. http://dx.doi.org/10.4102/ sajhrm.v10i1.389 [5] Pallant, J. (2005). SPSS Survival Manual: A step by step guide to data
analysis using SPSS for windows (Version12). Allen & Unwin
[6] Rohr, C., Trinkner, U., Lawrence, A., Hunt, P., Kim, C.W., Potogou, D., Sheldon, R. (2011). Study on Appropriate Methodologies to Better Measure Consumer Preferences for postal Services. Rand Europe, Cambridge CB4 1YG
[7] South African Post Office, (2010-12). www.postoffice.co.za
[8] Storey J, Sisson K, (1993). Managing Human Resources and Industrial Relations. Open University Press. Stewart V, 1990. The David Solution. Gower, Aldershot.