•
FUNDAÇÃO GETULIO VARGAS
'0
FGV
EPGE
SEMINÁRIOS DE ALMOÇO
DA EPGE
Dois ensaios em economia da saúde
GENARO DUEIRE LINS
(EPGE/FGV)
Data: 29/04/2004 (Sexta-feira)
Horário: 12h
Local:
Praia de Botafogo, 190 - 110
andar Auditório nO 1
A Morbidity-Based Test for Asymmetric Information in
Health Insurance*
Luis H. B. Braido Genaro D. Lins
July 9, 2004
Abstract
\Ve test for asymmetric information in health insurance by means of a special survey conducted in 1998 in Brazil. The distinct features of the database are twofold. First, it displays information on individual morbidity-an issue still unexplored in the empiricalliterature on insurance. Second, unlike other coun-tries studied in the literature, the coverage leveI offered by the Brazilian free public health service is much lower than its private counterpart-making infor-mational problems more likely. We find evidence of information asymmetries associated with some diseases (e.g., hypertension and heart disease) but not with others (e.g., cancer and chronic renal disease).
Keywords: Health insurance, empirical test, PNAD, risk, coverage. JEL Clas-sification: C52, D82, G22, 111.
1
Introduction
Contract theory has become a leading field in economics, but yet little is known about which markets these models account for. Recently, the predictions of con-tract theory have been confronted with data from different insurance markets. In this paper, we test for information asymmetries in the Brazilian health insurance market by means of a unique survey conducted in 1998 by the Brazilian Institute of Geography and Statistics (Instituto Brasileiro de Geografia e Estatística-IBGE).
In 1998, the IBGE included a supplementary health schedule in the Brazilian Na-tional Household Survey (Pesquisa Nacional por Amostra de Domicílios-P!\:AD).
The Pl\AD is an annual survey containing general information about individuaIs and their living conditions. It is designed to represent the entire Brazilian popula-tion (about 160 million people). The 1998 health supplement provides addipopula-tional information about the morbidity of individuaIs and health insurance coverage.
Two distinguishing features of this work are worth of note. First, the 1998 P::'\AD displays morbidity information and allows one to measure the risk of an individual having different types of health problems-namely, arthritis or rheumatism, bron-chitis or asthma, canceI. chronic renal disease, cirrhosis, depression. diabetes, heart disease, hypertension, lumbar pain, tendonitis, and tuberculosis. The existing liter-ature on insurance focuses on data about healthcare utilization and indicates that individuaIs with extra coverage tend to overuse health services. Here, we test the conditional independence of individuaIs' coverage decisions and their risk of suffer-ing from cancer, heart disease, and other types of health problems. This type of exercise is nO\'el and addresses a controversial issue with important health policy implications.
The second feature concerns the fact that the free public health service in Brazil provides much lower coverage leveIs than its private counterpart. This makes in-formational problems more likely here than in the countries usually studied in the literature (such as Australia, USA, France, Switzerland, Argentina, and Chile),
\vhere the public and the private plans are more similar in terms of coverage.
The Test
equilibrium, riskier types select contracts with higher premiums and higher coverage leveIs, while safer agents prefer contracts with lower premiums and lower coverage leveIs (see Rothschild and Stiglitz, 1976). The standard moral hazard theory ex-plores a different mechanism that delivers the same prediction. In these models, agents choose contracts and privately observed preventive actions that affect the probability of an accident. In equilibrium, agents with more coverage choose lower leveIs of preventive actions and suffer accidents more frequently (see Holmstrom, 1979; and Grossman and Hart, 1983). In order to test the presence of either of these problems, one must estimate the likelihood of an accident conditional on the insurance coverage and other observable characteristics.
We perform empirical tests using the entire population as welI as a subsample of individuaIs living in urban metropolitan areas. We identify presence of asymmetric information when we pool alI diseases together-Le., there is a positive conditional correlation between the individual's coverage level and the number of different dis-eases observed. vVhen analyzing each disease separately, we find that the probability of being ill is not statisticalIy affected by the coverage leveI for diseases like cancer. chronic renal disease, and tuberculosis. On the other hand, we find a positive risk-coverage relationship for bronchitis, diabetes, heart disease, hypertension, lumbar pain, and tendonitis. The results are not conclusive for arthritis or rheumatism. cirrhosis, and depression.
The remainder of this paper is organized as folIows. Section 2 comments on some related papers; Section 3 describes the data set; Section 4 performs the econometric test; and Section 5 concludes.
2
Related Literature
Pauly's (1986) review of the literature points out for a lack of empirical evidence on the importance of asymmetric information in health insurance. Since then, a large number of papers have addressed this issue. We discuss a few of them here. This discussion is not intended to survey the extensive existing literature, but rather present an overview on the topic.1
Cameron, Trivedi, Milne, and Piggott (1988) test the existence of asymmetric 1 Additional references include: Rosset and Huang (1973); Keeler, Morrow, and Newhouse (1977);
information using the 1977-78 Australian Health Survey. Four dummy variables are used to indicate different leveIs of insurance coverage. Health care utilization is measured by different variables, such as the number of: visits to a doctor; admis-sions to a hospital; nights spent in a hospital; consultations to non-doctor health professionals; and prescribed and nonprescribed medications used in the previous two years. Using a negative binomial model, they find a positive relation between coverage and demand for health care.2
Dowd, Feldman, Cassou, and Finch (1991) investigate channels through which health plan membership affect service utilization. They use a discrete-choice equa-tion to model the agents' decisions among the different health plans and a censored linear equation to model health service utilization. Household characteristics are used as control variables in both equations. Deductibles and coinsurance rates are included as explanatory variables in the service utilization equation. üsing a survey of 10,798 employees, drawn from firms located in the Twin Cities (Minneapolis and St. Paul, :\Iinnesota, USA), in 1984, they do not reject the null hypothesis of zero correlation between the error terms of these two equations. Furthermore. utilization of physician services does not vary across samples with different leveIs of coverage. But the number of days spent in a hospital is significantly higher for families with plans that pay providers based on a fee-for-services, as opposed to plans that pay a fiat capitation per patient.
Browne (1992) and Browne and Doerpinghaus (1993) use the 1977-78 Xational MedicaI Care Expenditure Survey (USA) and find that low-risk agents purchase less insurance in the individual market for health insurance than they do in the group market (which is an environment relatively free of asymmetric information).
~loreoveL low-risk agents tend to subsidize high-risk consumers, which support pooling equilibrium models.
Chiappori. Durand, and Geoffard (1998) use longitudinal data from France to test for moral hazard in the demand for physician services. They explore an exoge-nous increase in copayment rates for a group of individuaIs (treatment group) that
was not immediately applied to another part of the population (control group). The number of medicaI home visits is smaller for the individuaIs who faced the increase in their copayment rates. The effect is not statistically significant for office visits-a service in which individuaIs have substantial non-monetary cost.3
Holly, Gardiol, Domenighetti, and Bisig (1998) apply a simultaneous biprobit model to the 1992-1993 Swiss Health Survey. The first equation describes the agents' demands for supplemental insurance and the second equation models the propensity to have at least one hospital stay as the patient has used some medicaI treatment (controlling for the type of insurance plan). Agents with a supplemental insurance plan are more likely to have at least one inpatient stay, conditional on some medicaI treatment being used.4
Cardon and Hendel (2001) study the presence of asymmetric information in the health insurance market using data from the 1987 National MedicaI Expenditure Survey (USA). They test the conditional correlation of insurance coverage and de-mand for health services and find no evidence of information asy-mmetries.
Finally, there are two recent studies conducted in developing economies. Bertra-nou (1998) and Sapelli and Vial (2003) use data from Argentina and Chile, respec-tively, and find a positive relation between health-insurance coverage and health-care utilization in these countries.
It is worth stressing that all papers in the literature focus on testing the rela-tionship between insurance coverage and healthcare utilization. We are unaware of any paper linking health coverage to the occurrence of specific diseases.
3
Data
The data set used here is part of the 1998 Brazilian National Household Survey
(Pesquisa Nacional por Amostra de Domicílios-PNAD) , which is an annual
re-search conducted by the Brazilian Institute of Geography and Statistics (Instituto Brasileiro de Geografia e Estatística-IBGE). The PNAD contains permanent
ques-tions about general characteristics of household members (such as place of residence,
3Helms, l\"ewhouse, and Phelps (1978) and l\Ianning, Kewhouse, Duan, Keeler, Leibowitz. and l\Iarquis (1987) also find evidence of moral hazard by means Df experimental data.
I A recent working paper by Gardiol, Geoffard, and Grandchamp (2003) also reports a strong
education leveI, personal income, and employment status) as well as questions about home characteristics (such as type of home, ownership status, and the number of rooms in the household). In 1998, the IBGE also implemented a supplementary health schedule that is used herein.
The 1998 survey has approximately 344,975 interviews distributed across all regions of the country and intended to represent the entire Brazilian population (about 160 million people). Weights for expanding the sample to represent the national population were computed by the IBGE, considering the population pattern projected from the 1980 and 1991 demographic censuses under usual assumptions about the path for fertility, mortality, and migration rates. (For additional details, see Instituto Brasileiro de Geografia e Estatística, 1998.)
The 1998 health supplement contains individual-leveI data on morbidity-namely, whether the individual suffers or not from twelve different types of diseases: arthri-tis or rheumaarthri-tism, bronchiarthri-tis or asthma, cancer, chronic renal disease, cirrhosis. depression, diabetes, heart disease, hypertension. lumbar pain, tendonitis, and tu-berculosis. This information is used to construct different dummy variables intended to measure the risk of each disease. Furthermore, the data also report whether in-dividuaIs V,'ere covered by at least one health-insurance plan (other than the free public service) during the last year. This information is used to construct a dummy variable indicating the individual coverage status (covered by a health plan versus covered only by the free public service). Brazilian citizens are eligible to a free public health service (Sistema Único de Saúde, SUS). In principIe, the SUS offers
comprehensive coverage. In practice, it presents some structural problems-ranging from long queues to uneven material conditions across health units-which reduces its effective coverage. A significant part of the Brazilian population only searches for assistance at the SUS when not entitled to other options. This is a distinguish-ing feature of the Brazilian case: the difference in effective coverage between the free public health service and the health plans is much larger than in the countries studied in the literature.
Information describing the individuaIs and their households is used to create about 140 control variables that affect individual risk and insurance decision. These variables describe: (i) individual general characteristics (such as gender: age, posi-tion in the family and in the household,5 race, and whether the individual's mother
is still alive); (ii) individual education, type of job, and income; (iii) family and household characteristics (such as the number of members and income); (iv) family composition; (v) home characteristics; (vi) state where the individuallives; and (v) the person in the household who actualIy answered the IBGE survey. Table 1 defines alI variables relevant to the analysis and lists the PN AD codes used to construct them.
[Table 1]
Around 24.5% of the Brazilian population had a health insurance plan in 1998. When we further divide the sample into males and females, we notice that the population is composed of 11.32% of insured males; 13.13% of insured females; 37.67% of uninsured males: and 37.89% of uninsured females. Table 2 shows the frequency of each disease in these four different population graups. Each celI in Table 2 displays the average value of the variable listed in the first column, conditional on the group described in the first row. For instance, celI aI shows that 3.92% of the insured males suffer fram arthritis or rheumatism. This number rises to 6.41% in the group of uninsured males (cell a2). One must be careful when interpreting these sample means since the characteristics of the insured and uninsured population differ considerably. Table 3 shows that both groups have similar average ages but that insured individuaIs are more educated, belong predominantly to the white race, live predominant1y in urban metropolitan areas, and have average family income about three times higher than that of uninsured individuaIs. These patterns are very similar between males and females.
[Tables 2-3]
4
Empirical Analysis
In standard adverse selection models, agents are assumed to have different pri-vately observed leveIs of risk. In equilibrium, riskier types demand more coverage (see Rothschild and Stiglitz, 1976). In moral hazard models, agents with lower coverage voluntarily choose higher leveIs of preventive actions and end up with a
lower likelihood of having health problems (see Holmstrom, 1979; and Grossman and Hart, 1983). Thus. independently of the causal direction, the standard models of asymmetric information predict a positive correlation between coverage and the risk of health problems. These theoretical predictions are derived under the assump-tion that agents are homogeneous in their observable characteristics; we then use a parametric mo deI to control for observed heterogeneity.
Our risk metric is the incidence of different types of health problems. For each type of disease, let Yi be a dummy variable that equals 1 if individual i is ill; Xi
be a vector of observed characteristics of individual i; and Zi be a dummy that
equals 1 if individual i has a heath insurance plano Under the null hypothesis of no informational asymmet r~'" .li, must be independent of Zi (conditional on Xi)' One
could thus test whether:
This test is perfurIIlt'd \\"it h different parametric models-namely, the probit, logit, and linear probahility IIIodcls. \Ve estimate the model:
Pr (.li,
I
Xi, Zi) = F (Xi6+
zn) ,where F indicates the underlying distribution function, and test the hypothesis that
,=
O.4.1 Specification Problems
A main issue in empirical tests for asymmetric information is that specification errors could lead one to reject the null hypothesis that Pr (Yi
I
Xi, Zi) = Pr (YiI
Xi)' ~1issing explanatory variables as well as wrong functional forms could generate a spurious correlation between Yi and Zi.Being aware that one can never be fully protected from this problem, we try to tackle it on different fronts. Besides using different functional forms for the dis-tribution function F, \\"e also use a methodology proposed in Dionne, Gouriéroux, and Vanasse (2001) and Dionne, Gouriéroux, and Vanasse (2003). This method-ology is intended to smooth linear scoring functions and consists in estimating
As occurs with specification error tests, the variable Êi would capture potential cross-effects that were omitted in the model specification. Technically, we model:
and
Pr (Yi
I
Xi,
Êi'Zi)
= F(Xil
3 -+-ÊiD:+
ZiI) ,
where G and F stand for the underlying probability distributions used in the exer-cise.
4.2 Empirical Results
vVe perform different estimations using the 1998 PKAD. About 140 control vari-ables are included in the vector
Xi.
All quantitative and dummy variables described in Table 1 are considered. Furthermore, in order to account for potential nonlinear-ities, we also include four powers of the following quantitative variables: number of rooms in the household; individual's age, years of schooling, and income; household and family incomes; total number of members in the household and in the family: number of other insured members in the family and in the household.Table 4 presents the results in two blocks. The first block displays the OLS estimations performed without and with the correction term Êi. Similarly, the second block displays the logit results without and with the term Êi.6 vVe use a
logistic distribution for G when generating the term Êi. The standard errors are corrected for potential heteroskedasticity across families and autocorrelation among family members (Huber-White cluster correction).
The null hypothesis of no informational problems, "(
=
O, is not rejected at the 5% leveI of significance for the following diseases: arthritis and rheumatism (for most specifications), cancer, chronic renal disease, and tuberculosis. There is evidence of informational problems associated with bronchitis or asthma, cirrhosis, depression, diabetes, heart disease, hypertension, lumbar pain, and tendonitis. In general, the point estimation for I becomes more positive when the correction termÊi is introduced, suggesting that cross-effects among explanatory variables would
not be driving the results.
é Logit and probit estimations presented very similar results, therefore we chose to present only
[Table 4]
Urban Metropolitan Areas
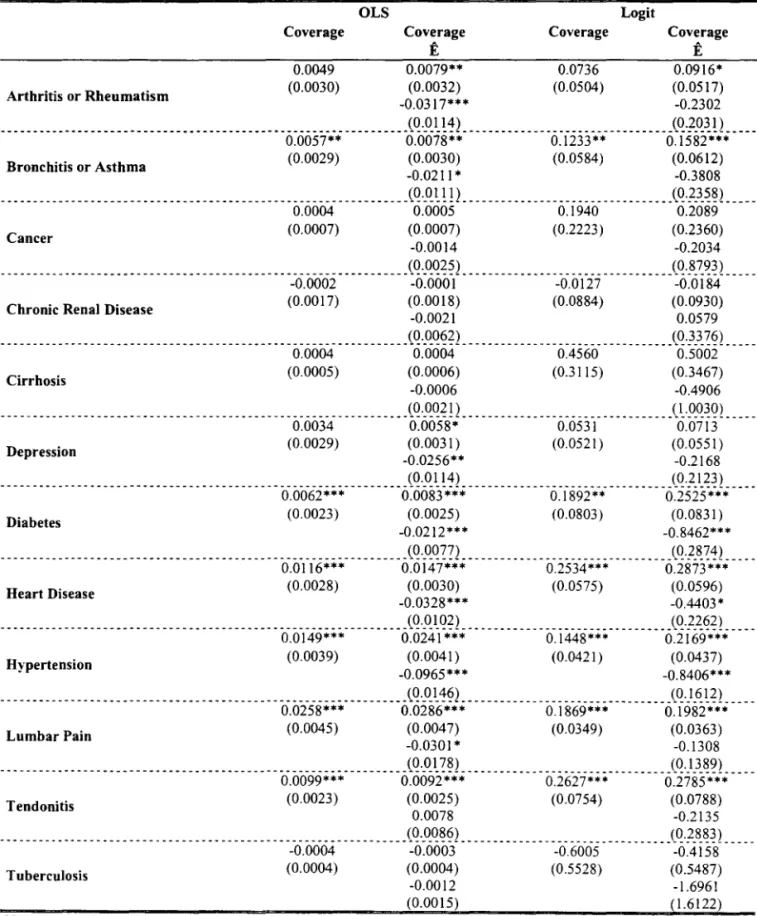
In order to check robustness of these results we perform the same exercise using data only from urban metropolitan areas. The results displayed in Table 5 are essentially the same--except for cirrhosis and depression.
[Table
5]
4.3 Ordered Analysis
One could be curious about which results would be obtained if all diseases were pooled into a single risk metric. This is the exercise performed here. We define
Wi E {I, 2, ... , 12} as the number of health problems presented by individual i and
model this variable as function of Xi and Zi. The results displayed in Table 6 show
that there is a positive correlation between the coverage dummy and the number of health problems presented by individuaIs. I\ote that the results do not change when we introduce the term Êi into the regression model (check the second and
the forth columns). Just as before, the relationship between illness and coverage becomes marginally more positive once we control for potential specification errors.
[Table 6]
5
Conclusion
This paper tests for informational asymmetries in the Brazilian health insurancf' market by means of a special schedule attached to the Brazilian National Household Survey (PNAD) in 1998.
The number of diseases manifested by individuaIs is found to be positively related to their insurance coverage leveI. This same relation is robustly found for six different diseases: bronchitis or asthma, diabetes, heart disease, hypertension, lumbar pain. and tendonitis. No risk-coverage correlation is found for other three diseases: cancer. chronic renal disease, and tuberculosis. The results for arthritis or rheumatism. cirrhosis, and depression are ambiguous.
\\Te believe this exercise is important for two reasons. First, this is the fi13t
paper testing whether individuaIs with extra insurance are more likely to suffer
from different diseases (so far, the literature has focused on the correlation between coverage and health care utilization). Second, there are very few tests for asymmetric informatian in developing ecanomies. Information asymmetries are more likely in these economies since the coverage leveI af their free public service is typically low.
References
[1] Bertranou, Fabio. "Health Care Services Utilization and Health Insurance Coverage Evidence from Argentina." Mimeo, 1998, AAEP, Argentina.
[2] Browne, Mark J. "Evidence of Adverse Selection in the Individual Health Insurance Market." Journal of Risk and Insurance, 1992, 59, 13-33.
[3] Browne, Mark J.i Doerpinghaus, Helen I. "Information Asymmetries and Adverse Selection in the ~Iarket for Individual :Yledical Expense Insurance." Journal af Risk and Insurance, 1993, 60, 300-312.
[4] Cameron, Andrew C.; Trivedi, Pravin K.i Milne, Franki Piggott, Jonh. "A Microeconometric Model of the Demand for Health Care and Health Insurance in Australia." Review of Economic Studies, 1988, 55, 85-106.
[5] Cardon, James H.i Hendel, Igal. "Asymmetric Information in Health In-surance: Evidence From the ~ational MedicaI Expenditure Survey." RAXD Journal of Economics, 2001, 32, 408-427.
[6] Chiappori, Pierre-André; Durand, Francki Geoffard, Pierre-Yves. "Moral Hazard and the Demand for Physician Services: First Lessons fram a French Natural Experiment." European Economic Review, 1998, 42, 499-511. [7] Dionne, Georgesi Gouriéroux, Christiani Vanasse, Charles. "Testing
for Evidence of Adverse Selection in the Automobile Insurance Market: A Comment." Journal af Political Economy, 2001, 109,444-453.
[9] Dowd, Bryan; Feldman, Roger; Cassou, Steven; Finch, Michael. "Health Plan Choice and the Utilization of Health Care Services." Review of Economics and Statistics, 1991, 73, 85-93.
[10] Ettner, Susan L. "Adverse Selection and the Purchase of Medigap Insurance by the Elderly." Journal of Health Economics, 1997, 16, 543-562.
[ll]
Frank, Richard G.; Glazer, Jacob; McGuire, Thomas G. "Measuring Adverse Selection in Managed Health Care." Journal of Health Economics, 2000. 19. 829-854.[12] Gardiol, Lucien; Geoffard, Pierre-Yves; Grandchamp, Chantal. "Sep-arating Selection and Incentives Effects: An Econometric Study of Swiss Health Insurance Claims Data." DELTA \Vorking Paper 2003-37, 2003.
[13] Grossman, Sanford J.; Hart, Oliver D. "An Analysis of the Principal-Agent Problem." Econometrica, 1983, 51, 7-45.
[1{ Helms, Jay; Newhouse, Joseph P.; Phelps, Charles E. "Copayments and Demand for :Medical Care: The California ~ledicaid Experience." Bell Journal of Economics. 1978, 9, 192-208.
[15: Holly, Alberto; Gardiol, Lucien; Domenighetti, Gianfranco; Bisig, Brigitte. "An Econometric Model of Health Care Utilization and Health In-surance in Switzerland." European Economic Review, 1998, 42, 513-522. [16: Holmstrom, Bengt R. ":\cloral Hazard and Observability." BeU Journal of
Economics, 1979, 10, 74-91,
[17] Instituto Brasileiro de Geografia e Estatística. ":.\'otas ~letodológicas:
Pesquisa :"l"acional por Amostra de Domicílios." 1998.
[18: Keeler, Emmett B.; Morrow, Daniel T.; Newhouse, Joseph P. "The Demand for Supplementary Health Insurance, or Do Deductibles Matter?" Journal of Political Economy, 1977, 85, 789-801,
and the Demand for MedicaI Care: Evidence from a Randomized Experiment." American Economic Review, 1987, 77, 251-277.
[20] Pauly, Mark V. "Taxation, Health Insurance, and Market Failure in the MedicaI Economy." Journal of Economic Literature, 1986, 24, 629-675.
[21] Rosett, Richard N.; Huang, Lien-fu. "The Effect of Health Insurance on the Demand for MedicaI Care." Journal ofPolitical Economy, 1973,81,281-305. [22] Rothschild, Michael; Stiglitz, Joseph. "Equilibrium in Competitive
Insur-ance Markets: An Essay on the Economics ofImperfect Information." Quarterly Journal of Economics, 1976, 90, 629-649.
Variables
Morbidity
Table 1. Data Description
Description
Twelve dummy variables assuming value equal to I if the individual is iH and O otherwise-the diseases considered are: lumbar pain
PNADCodes
(vI309); arthritis or rheumatism (v13IO); cancer (vI311); diabetes v1309-v1320 (v1312); bronchitis or asthma (vI313); hypertension (vI314); heart
disease (vI315); chronic renal disease (vI316); depression (vI317);
. ________________________________ ~p_e!~~J~~!~ SyJ}}_~K !t:l!~~!1i!i~_ ('.:~~ l~); _c_i!1.:~<?~~s_ {:,J
?_2_q) _______________________________ .
Dummy variable: I if the individual has at least one health insurance Coverage policy, and
°
if the individual is only covered by the free public v1321... ....s)'ste.I11... ... ... ... . ... .
Individual's General Characteristics
Education
Type of Job
Gender; age; position in the family (head, spouse, child, other relative, or non-relative); position in the household (same categories as for family position-some households are composed of more than one family); race (white, black, aborigine, yellow, and medium brown); and a dummy variable indicating whether the individual's mother is stiH alive
... --... -... .
Highest grade initiated (pre-school, elementary school, high school, and college); and years of schooling
...
A dummy variable describing whether the individual was economically active in the study period; and fifteen dummy variables
v0302, v8005, v040 I, v0402, v0404,v0405
v0607, v4703
v4713,v4715 ... . ... f()r. t~ e. j()1:I. cat eg()rie.s .re.gi.s~e.r.e.<:I. i.n .. }>.N.:AP ... .
Income Variables
Family and Household Size
Individual income; household income (including ali members); and family income (excluding non-relatives)
Number ofpeople Iiving in the family and in the household (there are cases in which different families Iive in the same household)
v4720, v4722, v4726
v0401,v0402 ... . ... __ ... .-... .
Number of other insured members in the family and in the household
Family and Household v0401 v0402
Insurance Pattem (variables intended to capture family and household effects on the v 1321' , ... .ill<:li yi<:lllill ' s. il1S.ll~lll1 ce.de.(;i~ i 9(1). ... ... .
Family Composition
Dummy variables indicating whether there is a spouse in the family aged between 0-20, 20-40, or above 40 years old; and variables indicating the number of children, relatives, and non-relatives in
v8005,v0402 different age groups (for children, the age groups are: newborns, 1-5,
6-10, 11-20, 21-40, and above 40 years old; for relatives and non-... re.l.atiyes,t~.e.llge..gr9.1Ip..s .. a.re.:.()~.2-º,.2..1.~º.'lln~a~()\'e.<l-O')'eil~s.oI<:I)
Home Characteristics
State
Who Answered the Survey
Number of rooms; a dummy variable for the presence of public
garbage collection; and four dummies for the location (urban v0205, v0218, metropolis, urban non-metropolis, rural metropolis, or rural non- v4727, v4728 .... I11e.t:r9P()lis.) ..
Dummies for the state where the individual Iives: 27 Brazilian states or foreign country
Dummies describing whether the individuaIs' information was provided by themselves or by another household member
UF
v1301
Table 2. Summary Statistics: Morbidity
Insured Males Uninsured Insured Uninsured
Males Females Females
(11.32%) (37.67%) (13.13%) (37.89%)
Arthritis or Rheumatism 3.92% 6.41% 8.82% 10.93%
Bronchitis or Asthma 5.28% 4.59% 5.22% 4.86%
Cancer 0.29% 0.18% 0.28% 0.22%
Chronic Renal Disease 1.74% 2.52% 2.18% 2.83%
Cirrhosis 0.21% 0.21% 0.12% 0.07%
Depression 2.91% 2.96% 7.16% 6.80%
Diabetes 2.22% 1.27% 2.68% 2.35%
Heart Disease 3.64% 2.91% 4.94% 4.58%
Hypertension 9.68% 7.59% 12.83% 13.02%
LumbarPain 13.06% 15.65% 19.98% 19.57%
Tendonitis 1.72% 1.07% 3.97% 1.89%
Tuberculosis 0.05% 0.13% 0.03% 0.09%
Table 3. Summary Statistics: Observed Characteristics
Insured Males Uninsured Insured Uninsured
Males Females Females
(11.32%) (37.67%) (13.13%) (37.89%)
Age 29.60 27.06 32.13 28.13
Individual Income (in R$) 827.48 214.14 3,63.41 84.90
Famil)' Income (in R$) 1,997.92 602.34 1.862.22 557.45
Household Income (in R$) 2,079.62 654.07 1.965.78 623.26
Attended High School or College 55.60% 17.48% 54.05% 19.47%
White Race 70.87% 47.65% 72.16% 48.99%
Black Race 4.10% 6.37% 3.73% 6.18%
Other Races 24.84% 45.71% 23.92% 44.60%
Urban Metropolitan Area 46.37% 23.96% 46.98% 25.02%
Table 4. Conditional Effect or Coverage on 12 Diseases (Entire Population)
Arthritis or Rheumatism
Coverage
-0.0014 (0.0022)
OLS Logit
Coverage Ê
Coverage Coverage
Ê
0.0052** 0.0456 0.0540
(0.0024) (0.0317) (0.0336)
-0.04 73 *** -0.0659
---___ ---_. ---_ .. ----_ ---(Q.~Q?º) --_______________________________ (Q·9.~~~! ____ _
0.0060*** 0.0099*** 0.1242*** 0.2064***
(0.0019) (0.0020) (0.0391) (0.0412)
-0.0277*** -0.6309***
Bronchitis or Asthma
---________________ -_ ---_ -_______ --- __ - _ ---- _ (Q.'<~Q~~) --_______________________________ (Q·X~~~) ____ _
0.0002 0.0000 -0.0166 -0.0202
(0.0005) (0.0006) (0.1496) (0.1665)
0.0011 0.0314
Cancer
_______________________________________________________________ (Q._QQ!~) _________________________________ (Q·~~~~L ___ _
0.0008 0.0023* 0.0518 0.0695
(0.0013) (0.0014) (0.0513) (0.0542)
-0.0111*** -0.1399
Chronic Renal Disease
_______________________________________________________________ (Q._QQ~!) _________________________________ (Q.}_5_~º! ____ _
0.0006* 0.0010*** 0.4800*** 0.6262***
(0.0003) (0.0004) (0.1851) (0.1903)
-0.0029** -1.2080**
Cirrhosis
_______________________________________________________________ (Q.~Q!?2. ________________________________ (Q·.?_~~n ____ _
0.0093*" 0.0114*** 0.1310*** 0.1633***
(0.0020) (0.0022) (0.0347) (0.0367)
-0.0147** -0.2674**
Depression
---- ---- ---- ---- --- ---(Q._QQ~?) --- -- -- ---- --- -- --- -- --- ---(Q'})-~~!
---0.0042*** 0.0065*** 0.0678 0.1887***
(0.0015) (0.0017) (0.0541) (0.0564)
-0.0161 *** -1.1274***
Diabetes
_______________________________________________________________ (Q._QQ~?) ________________________________ '(Q.}_5_?~! ____ _
Heart Disease
0.0110*** (0.0019)
0.0140*** 0.2190*** 0.2711 ***
(0.0021) (0.0395) (0.0418)
-0.0209*** -0.4648***
_______________________________________________________________ (Q._QQ~~) ________________________________ .(Q.) _~~?L ___ _
0.0086*** 0.0183*** 0.0675** 0.1537***
(0.0026) (0.0028) (0.0280) (0.0293)
-0.0689*** -0.6896***
Hypertension
_______________________________________________________________ (Q._QQ??) ________________________________ '(Q·9_~~~! ____ _
LumbarPain
0.0181 ***
(0.0030)
0.0217*** 0.1319*** 0.1414***
(0.0032) (0.0227) (0.0239)
-0.0256*** -0.0733
(0.0097) (0.0722)
---(i. OeiS5
*** ---
Õ:ÕÕ73-'-';'; ---
Õ:ii73- --Õ:i656-'-'-';
----(0.0014) (0.0015) (0.2033) (0.0558)
0.0087** -0.0854
Tendonitis
_______________________________________________________________ (Q .~Q~?) _________________________________ (Q.) _6..??! ____ _
-0.0002 -0.000 I -0.2795 -0.0511
(0.0002) (0.0003) (0.5980) (0.3560)
-0.0008 -1.5209*
Tuberculosis
(0.0008) (0.8630)
Arthritis or Rheumatism
Table 5. Robustness Analysis (Urban Metropolitan Areas)
Coverage
0.0049 (0.0030)
OLS Logit
Coverage Coverage Coverage
Ê Ê
0.0079** 0.0736 0.0916*
(0.0032) (0.0504) (0.0517)
-0.0317*** -0.2302
_______________________________________________________________ (~.~ I_! ~) _______________ . _________________ (~·f_Q.~! 1 ____ _
0.0057** 0.0078** 0.1233** 0.1582***
(0.0029) (0.0030) (0.0584) (0.0612)
-0.0211 * -0.3808
Bronchitis or Asthma
_______________________________________________________________ (~._Q.I_!!) __________________________ . _____ _ (~.f.3.~~l ____ _
0.0004 0.0005 0.1940 0.2089
(0.0007) (0.0007) (0.2223) (0.2360)
-0.0014 -0.2034
Cancer
(0.0025) (0.8793)
-. ---- --. --- -- --- --- --- ---- ---- ---õ.ooõi ---- --- -- --
:Õ~ÕÕÕ-( --- ---O.ÕÚ-j -- --- ---:õ~õi
84----(0.0017) (0.0018) (0.0884) (0.0930)
-0.0021 0.0579
Chronic Renal Disease
_________________________________ . _____________________________ (~·_Q.~~?2 ________________________________ _ (~}}_~~l ____ _
0.0004 0.0004 0.4560 0.5002
(0.0005) (0.0006) (0.3115) (0.3467)
-0.0006 -0.4906
Cirrhosis
______________ . _________ . _____________________________ . ________ (~._Q.~~! 2 __ . ______________________________ (~·9_Q.~º1. ___ _
0.0034 0.0058* 0.0531 0.0713
(0.0029) (0.0031) (0.0521) (0.0551)
-0.0256** -0.2168
Depression
-- ________ -. -- ________________ . _. _____________ . ________________ (~._Q.I_!~l ________________________ . _______ ,(~'f}_~~l ____ _
Diabetes 0.0062*** (0.0023) 0.0083*** (0.0025) 0.1892** (0.0803) 0.2525*** (0.0831 )
-0.0212*** -0.8462***
---_ -___ ---- -_____ -____________________ ---________ ---________ (~·_Q.~~?2 ________________________________ _ (~.f_~~~2 ____ _
0.0116*** 0.0147*** 0.2534*** 0.2873***
(0.0028) (0.0030) (0.0575) (0.0596)
-0.0328 *** -0.4403 *
Heart Disease
________________________ . ______________________________________ (Q._Q.I_º?2 ___ . _______ . ____________________ ,(~'f_~~?l ____ _
0.0149*** 0.0241 *** 0.1448*** 0.2169***
(0.0039) (0.0041) (0.0421) (0.0437)
-0.0965*** -0.8406***
Hypertension
_____ -- -- _____________ -- __________________ -- ___________________ (~._Q.I.'!?2 __________________________ . ______ (~'}_~!?l ____ _
0.0258*** 0.0286*** 0.1869*** 0.1982***
(0.0045) (0.0047) (0.0349) (0.0363)
-0.030 1* -0.1308
LumbarPain
_______________________________________________________________ (~._Q.l_ ~~l ________________________ . _. _____ '(~·}}_~~l ____ _
0.0099*** 0.0092*** 0.2627*** 0.2785***
(0.0023) (0.0025) (0.0754) (0.0788)
0.0078 -0.2135
Tendonitis
--- ---. _ -- -- --____ ----. ________________ -_____________________ (~·_Q.~~?l ___________________ . ____________ J~'f_8_~~ 1 ____ _
-0.0004 -0.0003 -0.6005 -0.4158
(0.0004) (0.0004) (0.5528) (0.5487)
-0.0012 -1.6961
Tuberculosis
(0.0015) (1.6122)
N.Lham. t'/~t'lJ~ SA L759d Autor: Lins, Genaro Dueire
Título: Dois ensaios em economia da saúde.
111111111111111111111111111111111111111111111 1111
~~~;62530
•
Table 6. Ordered Analysis
Dependent Variable: Number ofDiseases Entire Population
OLS Ordered Logit
Coverage
0.0657*** (0.0080)
Coverage
Ê
0.0975*** (0.0087)
-0.2265*** (0.0261)
Coverage Coverage
Ê
0.1808*** 0.2382*** (0.0191) (0.0201 )
-0.4258*** (0.0614)
Coverage
0.0827*** (0.0120)
Urban Metropolitan Areas
OLS Ordered Logit
Coverage Coverage Coverage
Ê Ê
0.1072*** 0.2280*** 0.2791 *** (0.0126) (0.0285) (0.0297)
-0.2566*** -0.5550***
(0.0477) (0.1143)