INTRODUCTION
Exploitation of fossil fuels such as lignite, brown coal, crude oil and natural gas comes from the oxidation of carbon stored over millions of years in the Earth’s crust; the combustible energy when released in the atmosphere emits carbon dioxide (CO2). Increased concentration of CO2 in the atmosphere causes global warming, because it is a greenhouse gas. Fossil fuels are limited and concentrated in several geographic areas of our planet. The permanent status of the countries located outside of the oil-rich areas is uncertain and they are dependent on imported energy. Thus, the most European countries largely depend on imported fossil fuels from fossil fuel-rich regions such as Russia and Middle East countries. Due to limited fossil fuels in terms of availability and the ecology and the need for
finding other sources of energy, the European Union has focused on the production of a number of alternative fuels: biogas, biodiesel, bioethanol and hydrogen. Of all the renewable energy, the fastest development is expected from biomass (Van Dam et al., 2007). Biomass is plant or animal origin material that can be used as fuel or for industrial production. It is a renewable energy source, and can be divided into the wood raw material, wood processing industry waste material, agriculture
UDK = 662.767.2:636.5
COMPARISON BETWEEN BIOGAS PRODUCTION
FROM MANURE OF LAYING HENERS AND BROILERS
S. Kukić (1), B. Bračun (2), D. Kralik (2), R.T.Burns (3), S. Rupčić (4), Daria Jovičić (2)
Original scientific paper Izvorni znanstveni ~lanak
SUMMARY
Biogas plants that process raw materials from agriculture, such as poultry manure, are one of the most significant applications of anaerobic fermentation. In Asian countries, particularly in China, India, Nepal and Vietnam, there are several million very simple, small biogas plants that produce gas for household cooking and ligh-ting. In Europe and North America a number of agricultural biogas plants now, are increasing daily, a few thousand biogas plants exist, most of which use modern technologies, anaerobic fermentation. The aim of this paper is to determine the possibility of biogas production from poultry manure with 10% of total solids and through the segments of the quality and quantity, determine the content of total solids (DM), volatile solids (OM), and the amount and composition of biogas. The aim was also to justify the use of poultry manure in biogas production and its application for specific purposes Laboratory research showed that 1 kg of poultry manure produced 25 l of biogas, and pig slurry in combination with 10% of poultry manure produced 47.01 l of biogas during the 40 days of anaerobic fermentation under mezofilic conditions. Production of biogas has a good potential for develop-ment in Croatia, especially in the continental part. Usages of this technology are multiple because of the fact that the Republic of Croatia imports most of the energy. Usage of biogas would reduce the import of certain energy and thus reduce energy dependence; it would increase the number of employers and ease the obligation of Croatia toward EU in replacing some fossil fuels with renewable ones.
Key-words: laying hens manure, broiler manure, biogas
(straw, corn, dry corn stems, seeds and shells),animal (feces, and carcasses) and waste (green waste fraction of home, biomass gardens and parks of urban areas and sludge from waste water collectors).
There are two process groups of energy production from biomass sources. These are biochemical processes, such as fermentation and anaerobic decomposition, and the result are biofuels such as biothanol, biodiesel and biogas; thermo chemical processes such as combustion, where the energy is directly produced.
Biogas is produced by anaerobic fermentation of biomass, consists of methane and carbon dioxide in a ratio of 2: 1 and with a certain amount of hydrogen sulphate, nitrogen and hydrogen (Ciborowski, 2007; Chankaya and Pajabapaiah, 2004). Biogas can be used as fuel to run different types of internal combustion engines or refined by combustion as a substitute for natural gas in households and industry (Spajić et al., 2009).
The goal of biomass usage is to use solar energy built into the plants through photosynthesis, and through them in animals. Annually photosynthesis on Earth produces about 2x10¹¹ tons of volatile solids which is 3x10²¹ J of potential energy. That is several times more than the present world demand of energy. Of course, only a small fraction of volatile solids can be converted into energy. Ecological aspects of the use of biomass are most evident in the circulation of carbon. Namely, the carbon “trapped” in the process of photosynthesis through a transformation of biomass into the atmosphere returns to it almost in the same year and it is absorbed, unlike fossil fuels, where the amount of carbon and other organic components, stored millions of years in the Earth’s crust, are released almost in an instant causing long-term climate change (Hoogwijk et al., 2003).
MATERIAL AND METHODS
In this research we used poultry manure from broiler farm - floor method of keeping, laying hen - cage method and pig slurry from pig farms. The research consisted of three groups in three replicates. Control group was unseparated pig slurry. Experimental groups were: a) laying hen manure mixed with water and, b) broiler manure mixed with pig slurry. The process of anaerobic fermentation is carried out in a discontinuous process under mesophilic conditions (40º C) with the retention time of 40 days. Content of total solids in the samples was determined by drying 100 g of fresh material in fertilizers dryer at 75º C up to constant weight, and than calculated. The total content of ash and volatile solids was determined by combustion in furnace at 550º C for three hours.
Biogas produced through the saturated solution was collected in flooded graduated containers. The amount of gas was daily collected. Biogas produced was analyzed with gas chromatograph Varian 3900 by a modified method HRN ISO 6974-4:2000. The amount of N, CO2 and CH4 was determined.
RESULTS AND DISCUSSION
Total solids and volatile solids content
Determined concentration of total solids (TS) before fermentation varies, which is expected due to different manure (pig-poultry) and a different production (cage laying hens, floor straw broilers).
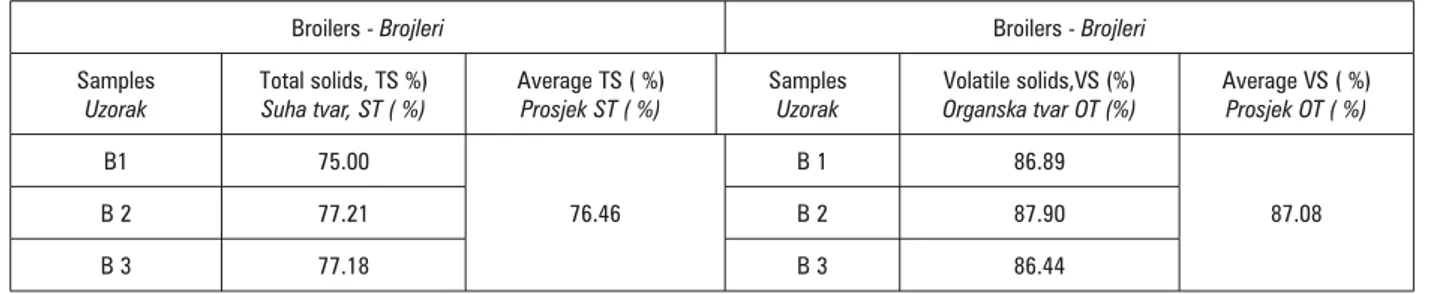
Broiler manure had the highest expected amount of total solids, which is in positive relation with the methods of keeping (straw as bed) and the dynamic of cleaning (the system all in and all out every 60 days). Analyzing broiler manure before fermentation following amounts of total and volatile solids were determined (Table 1).
Table 1. Content of TS and VS in broilers manure Tablica 1. Udio ST i OT u brojlerskom stajnjaku
Broilers - Brojleri Broilers - Brojleri
Samples
Uzorak
Total solids, TS %)
Suha tvar, ST ( %)
Average TS ( %)
Prosjek ST ( %)
Samples
Uzorak
Volatile solids,VS (%)
Organska tvar OT (%)
Average VS ( %)
Prosjek OT ( %)
B1 75.00
76.46
B 1 86.89
87.08
B 2 77.21 B 2 87.90
B 3 77.18 B 3 86.44
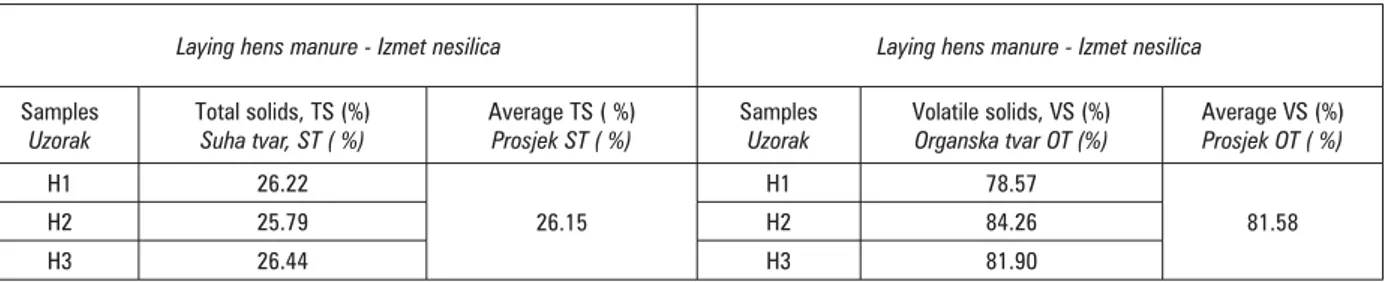
Laying hen manure had expected high amount of total and volatile solids, and the results obtained are almost identical to Benčević (1993), where the concentration of total solids in the manure were 25.3%,
Pig slurry as a control group, but also the mixing material, has the lowest expected concentration of total solids due to the fact that it is not separated, thus rich in water. The content of volatile solids in the analysed
samples is higher than those in Benčević (1993) by 20-40% and has average of 75%. Analysis of pig slurry before fermentation of the following contents of total and volatile solids was determined (Table 3).
Table 2. Content of TS and VS in laying hens manure Tablica 2. Udio ST i OT u izmetu nesilica
Laying hens manure - Izmet nesilica Laying hens manure - Izmet nesilica
Samples
Uzorak
Total solids, TS (%)
Suha tvar, ST ( %)
Average TS ( %)
Prosjek ST ( %)
Samples
Uzorak
Volatile solids, VS (%)
Organska tvar OT (%)
Average VS (%)
Prosjek OT ( %)
H1 26.22
26.15
H1 78.57
81.58
H2 25.79 H2 84.26
H3 26.44 H3 81.90
Table 3. Content of TS and VS in pig slurry Tablica 3. Udio ST i OT u svinjskoj gnojavci
Pig slurry - Svinjski gnoj Pig slurry - Svinjski gnoj
Samples
Uzorak
Total solids, TS (%)
Suha tvar, ST ( %)
Average TS ( %)
Prosjek ST ( %)
Samples
Uzorak
Volatile solids, VS (%)
Organska tvar OT (%)
Average VS ( %)
Prosjek OT ( %)
BPS 1 3.16
2.98
BPS 1 83.69
74.88
BPS 2 2.29 BPS 2 66.35
BPS 3 3.49 BPS 3 74.60
BPM experimental group of broilers was obtained by mixing 450g of pig slurry and 50g of broiler manure which resulted in an average of 9.99% of total solids content. Also, the amount of volatile solids content of an
average of 82.34% is expected given the high percentage of volatile solids in the base materials. Analysis of laying hen manure before fermentation of following amounts of total and volatile solids was determined (Table 4.).
The amount of biogas
The total yield and composition of biogas depend inter alia on microorganisms (Methanobacterium spp),
and on their metabolic rate in the organic substrate. For their reproduction, several elements are essential; water, energy sources, carbon and nitrogen sources and minerals. Amounts of biogas that can be obtained from the excrement of some species of animals depend on the content of volatile solids in manure and the degree of degradation of these substances in the process of fermentation. This degree of degradation is proportional: the higher degree of degradation the higher the amount
of biogas produced, but it takes more time for process to be completed.
The degree of decomposition of organic substances of solid manure in practice is 40-50% which provides 0.4-0.6 m³ biogas/kg or 0.8-1.0 m³ biogas / kg of liquid organic manure. Amounts of biogas are different for each type of animal. In ruminants the plant material is subjected to methane bacteria decomposition in the digestive tract which results in lower yield of biogas from ruminant manure than the amount of biogas from pig manure. Relation between the amount of biogas obtained from the same amount of liquid dairy cow
Table 4. Content of TS and VS in the mix of broiler manure and pig slurry Tablica 4. Udio ST i OT u mje{avini brojlerskog stajnjaka i svinjske gnojovke
Mix of broiler manure and pig slurry Mix of broiler manure and pig slurry
Samples
Uzorak
Total solids, TS (%)
Suha tvar, ST ( %)
Average TS (%)
Prosjek ST ( %)
Samples
Uzorak
Volatile solids, VS (%)
Organska tvar OT (%)
Average VS (%)
Prosjek OT ( %)
BPM 1 10,49
9,99
BPM 1 82,74
82,34
BPM 2 9,50 BPM 2 81,87
manure (M), fattening cattle (G), pigs (S) and poultry (P) can be estimated on the basis of the ratio: M: G: S: P = 5: 7: 8 : 10 (Lebenger, 1995).
Group 1 (H)
In the first group the experiment was carried out with laying hens manure. Average 26% of TS was reduced to 10% of TS by mixing with water; trial unit of the substrate was 500 g which means that for every 191 g substrate 309 g of water was added. From those substrates prepared, with laying hens manure in three replicates, the average amount of biogas per day was obtained.
Graph 1. Daily amount of biogas produced for H Grafikon 1. Dnevna koli~ina proizvedenoge bioplina za N
Graph 1 shows the daily biogas production from laying hens manure, where it can be seen that in the 3rd day a sudden growth in production of biogas is observed, and after that gradual decline, with the particularly emphasis on the production between 15 and 20 days which was the most intensive.
Group 2 (BPM)
In the second group the experiment was carried out with broiler manure mixed with pig slurry. To the 450 g of pig slurry also 50 g of broiler manure was added. The broiler manure had an average of 76.46% total solids and 87.08% of volatile, pig slurry an average of 2.98% total solids and 74.88% of volatile solids. From those substrates prepared with laying hens manure in three replicates, the average amount of biogas per day was obtained.
Graph 2. Daily amount of biogas produced for BPM Grafikon 2. Dnevna proizvodnja bioplina za BSG
The Graph 2 shows the daily production of biogas from broilers manure mixed with pig slurry where an extremely large increase is visible in production on the 2nd day with a total maximum of 2834 ml of biogas in
the third day and the sharp fall in the sixth and 10th day. After the tenth day the production continues with average amounts of 200 to 700 ml of biogas up to 40 days.
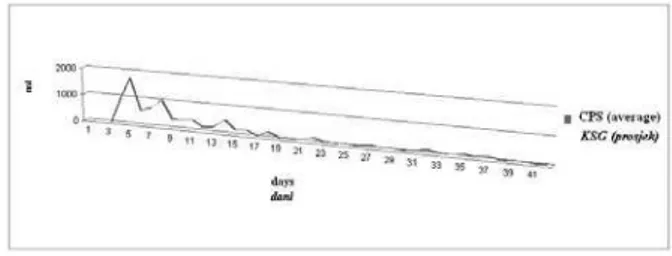
Group 3 (CPS)
In the third group pig slurry test was conducted and it also served as a control group. Pig slurry was not separated to contain a large amount of water. Control samples contained an average of 2.98% total solids and 74.88% organic matter. Experiments on such prepared pig slurry substrates were obtained in the average amount of biogas in the following days:
Graph 3. Daily amount of biogas produced for CPS Grafikon 3. Dnevna koli~ina proizvodnje bioplina za KSG
Graph 3 shows the daily biogas production from pig slurry. The production is characterized by an visible increase on the third day and a smaller jump on the ninth day after which we have a strong fall and oscillation of about 80 ml daily production to the end.
Total amount of biogas
Figure 4 shows the total amount of biogas produced from all three substrates (LH- layer hens, CPS - control pig slurry and BPM – broiler manure + pig slurry) by days where the apparent lower production of biogas is observed from CPS which is expected given the small amount of total solids LH : BPM : CPS = 10 : 9.99 : 2.98. The ideal ratio of carbon and nitrogen in substrates for the production of biogas is C / N = 30 / 1. Breeding of broilers on straw (C / N = 90 / 1) greatly improved C / N ratio of broiler manure which is visible in the biogas yield which was two times higher than when it comes to laying hens (C / N = 7 / 1) which were kept in cages without bedding.
Graph 5 shows the total amount of biogas at the end of the process. Dividing total amount of biogas obtained by fermentation of individual substrates with the amount of each substrate, which in our case is 500 g for each of the three samples, we get the amount of biogas produced per gram of substrate. Laying hens (H) produced a total of 26.36 ml of biogas per gram of substrate, mixture of broilers manure with pig slurry (BPM) 47.01 ml of biogas per gram of substrate and control pig slurry (CPS) 17.72 ml of biogas per gram of substrate.
Graph 5. The total amount of biogas produced at the end of the process
Grafikon 5. Ukupna koli~ina bioplina na kraju procesa
Composition of biogas
The composition of biogas depends on a number of factors such as temperature, substrate composition, the composition and number of microorganisms, pH, mixing, retention time, etc. The composition of the substrate determines the quantity and quality of the produced biogas. Substrats rich in carbohydrates provide the minimum amount of gas with low methane content. Better results are achieved with the substrates rich in proteins which yield higher amount of biogas of better quality and higher content of methane. The largest amounts of biogas can be produced from the fats rich substrates, which have high content of methane and thus the highest quality.
During the experiment the differences between production of biogas from the layer hens and broilers manure were not significant but the negative correlation was determined in nitrogen and methane amounts produced in particular substrates. In comparison with literature data shown in Table 5 biogas produced with the concentration of CH4 = 62.05% LH) and 63.09% (BPM) is of good quality and with approximate value of 23 MJ/m3 of energy.
Table 5. Energy value of biogas Tablica 5. Energetska vrijednost bioplina
CH4 in biogas (%)
CH4 u bioplinu ( %) 56 62 66 70 72 78 84
Value (MJ/m3)
Vrijednost (MJ/m3) 20 22.1 24 25 26 28 30
(From Baličević et al., 2001; Dobričević, 1999; Domac, 1998; Lebenger, 1995)
According to Lebenger (1995) it can be calculated that 1m3 of biogas with 78% of methane in the terms of energy value corresponds to 0.83 m3 of natural gas, which allows the production of 6.1 kWh of electricity.
The analysis of experimental results of different concentrations of methane were determined in single substrates, but within the limits of 5%. The largest amount of methane was obtained from the BPM = 63.09% CH4, than LH = 62.05% CH4. The smallest amount of methane was obtained from the sample CPS = 58.30% CH4. Satisfying ratio of C/N in this case contributed to the quality of gas in BPM substrates with the highest percentage of methane.
CONCLUSION
According to conducted laboratory studies of biogas production from poultry manure and pig slurry positive correlation between high amounts of TS and the amount of produced biogas was established. Amount of TS has no significant effect on the quality of biogas i.e. methane concentration. Also the negative
REFERENCES
1. Baličević, I., Madžarević, P., Majstorović, V., Majger, S. (2001): Agrar energija i ekologija, Energetsko ekološka studija, Izdavač: Ekološko društvo “Zeleni Osijek” Osijek,73-77.
2. Benčević, K. (1993): Biokont- osnove biološkog poljod-jelstva, Zagreb.
3. Dobričević, N., Pilestić, S., Krička, T., Miletić, S., Jukić, Ž. (1999): Energetski potencijali biomase iz poljoprivrede u Republici Hrvatskoj. Krmiva 41:283-289.
4. Domac, J. (1998): BIOEN program using energy from biomass and waste, the results of previous and future activities. The Energy Institute Hrvoje Pozar, Zagreb. 5. Hoogwijk, M., Faaij, A.,Van den Broek, R., Berndes, G.,
Gielen, D., Turkenburg, W. (2003): Exploration of the ranges of the global potential of biomass for energy. Biomass and Bioenergy 25(2):119-133.
6. Chankaya, H.N., Pajabapaiah, P. (2004): Envolving biomass-based biogas plants: The ASTRA experience. Current Science 87(7).
7. Ciborowski, P. (2007): Anaerobic Digestion in the Dairy Industry, Minnesota Pollution Control Agency, Air Innovations Conference, www.epa.gov.
8. Lebegner, J. (1995): Mogućnost proizvodnje bioplina u Hrvatskoj. Energija 1 44(1): 17-23.
9. Van Dam, J., Faaij, A.P.C., Lewandowski, I., Fischer, G. (2007): Biomass production potentials in Central and Eastern Europe under different scenarios. Biomass and Bioenergy 31(6):345-366.
10. Spajić, R., Burns, R., Moody, L., Kralik, D. (2009): Anaerobic Digestion System Selection for Croatian Swine Manures. Zbornik radova 44. hrvatskog i 4. međunarodnog simpozija agronoma, Opatija, str. 940-944.
USPOREDBA PROIZVODNJE BIOPLINA
IZME\U GNOJA NESILICA I BROJLERA
SA@ETAK
Bioplinski pogoni koji prerađuju sirovine iz poljoprivrede, poput izmeta peradi, predstavljaju jednu od najvažnijih primjena anaerobne fermentacije. Samo u azijskim zemljama, osobito u Kini, Indiji, Nepalu i Vijetnamu, postoji nekoliko milijuna vrlo jednostavnih, malih bioplinskih reaktora koji proizvode plin za kuhanje i rasvjetu kućanstava. U Europi i Sjevernoj Americi svakodnevno raste broj poljoprivrednih bioplinskih pogona, a danas ih funkcionira nekoliko tisuća, od kojih se većina koristi suvremenim tehnologijama anaerobne fermentacije. Cilj rada je utvrditi mogućnost proizvodnje bioplina iz pilećega gnoja s 10% suhe tvari. S pomoću segmenata kvalitete i kvantitete tijekom istraživanja utvrditi udio suhe tvari (ST), organske tvari (OT), količinu i sastav bioplina te dokazati opravdanost uporabe pilećega gnoja u proizvodnji bioplina i njegove primjene u određene svrhe Na temelju provedenoga laboratorijskoga istraživanja, dokazana je proizvodnja bioplina iz izmeta peradi i svinjske gnojovke. Anaerobnom fermentacijom u trajanju od 40 dana pri mezofilnim uvjetima proizvedeno je iz 1 kg izmeta nesilica 25 litara bioplina, a iz svinjske gnojovke u kombinaciji s 10% brojlerskoga stajnjaka 47,01 litara bioplina. Proizvodnja bioplina ima dobre uvjete za razvoj u Republici Hrvatskoj, posebice u kontinentalnome dijelu. Koristi od te tehnologije višestruke su, jer je RH prisiljena uvoziti većinu energenata. Korištenjem bioplina smanjio bi se uvoz pojedinih energenata, čime bi se umanjila i energetska ovisnost o drugim državama; povećao bi se broj zaposlenih i RH bi ostvarila lakše svoju obvezu prema EU-u, da zamijeni dio fosilnih goriva obnovljivima.
Ključne riječi: izmet nesilica, brojlerski stajnjak, količina bioplina