Quantitative Dynamic Modelling of the Gene Regulatory
Network Controlling Adipogenesis
Yin Wang1., Rudong Li2., Chunguang Ji3
, Shuliang Shi4, Yufan Cheng5, Hong Sun2,6*, Yixue Li1,2,6*
1College of Life Science and Biotechnology, Shanghai Jiaotong University, Shanghai, China,2Key Laboratory of Systems Biology, Shanghai Institutes for Biological Sciences, Chinese Academy of Sciences, Shanghai, China,3School of Computer Science and Technology, Harbin Institute of Technology, Harbin, China,4School of Life Science and Technology, Harbin Institute of Technology, Harbin, China,5Department of Oncology, Shanghai Medical College, Fudan University, Shanghai, China,
6Shanghai Center for Bioinformation Technology, Shanghai, China
Abstract
Gene regulatory networks (GRNs) coherently coordinate the expressions of genes and control the behaviors of cellular systems. The complexity in modeling a quantitative GRN usually results from inaccurate parameter estimation, which is mostly due to small sample sizes. For better modeling of GRNs, we have designed a small-sample iterative optimization algorithm (SSIO) to quantitatively model GRNs with nonlinear regulatory relationships. The algorithm utilizes gene expression data as the primary input and it can be applied in case of small-sized samples. Using SSIO, we have quantitatively constructed the dynamic models for the GRNs controlling human and mouse adipogenesis. Compared with two other commonly-used methods, SSIO shows better performance with relatively lower residual errors, and it generates rational predictions on the adipocyte responses to external signals and steady-states. Sensitivity analysis further indicates the validity of our method. Several differences are observed between the GRNs of human and mouse adipocyte differentiations, suggesting the differences in regulatory efficiencies of the transcription factors between the two species. In addition, we use SSIO to quantitatively determine the strengths of the regulatory interactions as well as to optimize regulatory models. The results indicate that SSIO facilitates better investigation and understanding of gene regulatory processes.
Citation:Wang Y, Li R, Ji C, Shi S, Cheng Y, et al. (2014) Quantitative Dynamic Modelling of the Gene Regulatory Network Controlling Adipogenesis. PLoS ONE 9(10): e110563. doi:10.1371/journal.pone.0110563
Editor:Ben D. MacArthur, University of Southampton, United Kingdom
ReceivedFebruary 26, 2014;AcceptedSeptember 20, 2014;PublishedOctober 21, 2014
Copyright:ß2014 Wang et al. This is an open-access article distributed under the terms of the Creative Commons Attribution License, which permits unrestricted use, distribution, and reproduction in any medium, provided the original author and source are credited.
Funding:This work was supported by the National ‘973’ Basic Research Program (2011CB910204, 2010CB529202, 2011CB510100, 2010CB912702), Natural Science Foundation of China (31371343, 30900272, 31070752) and Research Program of CAS (KSCX2-EW-R-04, KSCX2-YW-R-190, 2011KIP204). The funders had no role in study design, data collection and analysis, decision to publish, or preparation of the manuscript.
Competing Interests:The authors have declared that no competing interests exist. * Email: [email protected] (HS); [email protected] (YL)
.These authors contributed equally to this work.
Introduction
The interactions between genes,i.e.gene regulatory networks (GRNs), coherently coordinate the expressions of all genes, resulting in differential gene expressions that regulate most of the cellular behaviors [1]. Understanding how gene expression is regulated under different conditions is an important question in molecular biology. Nowadays, sufficient amounts of gene expres-sion data provide an opportunity to explore gene regulations at the systemic level; moreover, quantitative models embodying the dynamic and mechanistic details of the GRNs can be established thereby [2]. Nevertheless, several practical problems such as small sample size, complex dynamics and nonlinearity, high dimension, etc., make the quantitative/dynamic modeling of GRNs a very challenging task.
One of the main challenges in modeling a gene regulatory network is the small sample size compared to the number of genes, making the estimation of parameters (i.e. coefficients for regulation strengths, action rates, etc.) inaccurate. Fortunately, this problem can be alleviated by utilizing statistical methods to filter the features in the raw data, e.g. selecting only the relevant features or extracting the essential features. Popular statistical methods mainly include principal component analysis (PCA) [3], principal component regression (PCR) [4], and partial least-square
regres-sion (PLS) [5]. However, these linear feature-extraction methods may lead to unsatisfying results when dealing with nonlinear circumstances, as usually exemplified by biological networks. [6]. For better inference of bio-networks with nonlinear gene regulations, we have designed a parameter estimation algorithm - small-sample iterative optimization (SSIO), an approach that infers GRNs based on gene expression data in case of small sample sizes.
Adipocyte differentiation is an area of intensive research. Many human diseases result from failure of adipocyte development, primarily from extreme aberrations in the fat cell number. An overabundance of fat cells may induce obesity, which is considered to be a major risk factor for diabetes and hypertension [7]. The course of adipocyte differentiation is highly controlled by a complex cascade of signals, and the individual molecular regulatory relationships have been extensively studied [8,9,10]. Many transcription factors (TFs) cooperate to modulate the expression of the three key adipocyte genes,i.e.CEBPb, CEBPa and PPARc. In computational modeling, the asymmetry between the numbers of TFs and adipocyte genes (i.e. the number of TFs is greater than the sample size) leads to the so-called small-sample-size problem.
and human primary adipocytes, respectively. SSIO showed better performance compared with two other commonly-used methods. As shown by the data, most regulatory relationships are of the same ranking of importance in both human and mice, whereas some striking differences were observed between the two species as well.
Data and Methods
Data
We obtained time-series gene expression data during adipocyte differentiation from Mikkelsenet al. [11]. Gene expressions were profiled in series at nine time points for human (day22, 0, 1, 2, 3, 5, 7, 9, 14) and four time points for mouse (day 22, 0, 2, 7). Expression levels were normalized using the Robust Multi-array Average method and truncated to a minimum value of 20 [11].
Linear interpolation was used to reconstruct partial mouse data at intermediate time points duiring optimisation [12], because of the shortage of time-series data.
Partial least-square regression method
Partial least-square regression (PLS) is often used for dimension reduction when dealing with small-sized samples of gene expression data [5]. The algorithm is mainly performed as described by Ho¨skuldsson [13], and modified to some extent in this work:
(1) Normalize the feature space. In this paper, the values of each gene are treated by dividing each feature with standard deviation and multiplying each feature with mean value to reduce bias of truncated data from Mikkelsen [11], since high expression levels are considered to be of significance [14].
Yi/Yi:
mean(Yi)
std(Yi) ð1Þ
(2) Find direction vectors of PLS. For one-dimensional output, the first direction vectorp1is defined based on the covariance of input
and output:
p1~X
n
i~1
c1i:xi ð2Þ
and
c1i~ ffiffiffiffiffiffiffiffiffiffiffiffiffiffiffiffiffiffiffiffiffiffiffiffiffiffiffifficov(xi, y) Pn
i~1
cov2(x i, y)
s ð3Þ
wherenis the dimension of input,xiis the ith input,yis output,
and cov(xi,y) is the covariance of input and output;
(3) Regress the input and output with the direction vectors of PLS separately:
xi~axi1:p1zrxi1 ð4Þ
y~ay1:p1zry1 (5)
whereaxiandayare linear regression coefficients for theith input
and output, andrxiandryare the corresponding residuals;
(4) Replacexiby its residualrxi,ybyry; and then calculating the
next direction vector using formula (1) and (2). Regress the residuals until they are small enough or the vector number is close to the sample size [13];
(5) Output the sequence of fitted PLS direction vectors, and recover the linear coefficients by the PLS transformations:
y~X
m
i~1 ai
y:pizrend ð6Þ
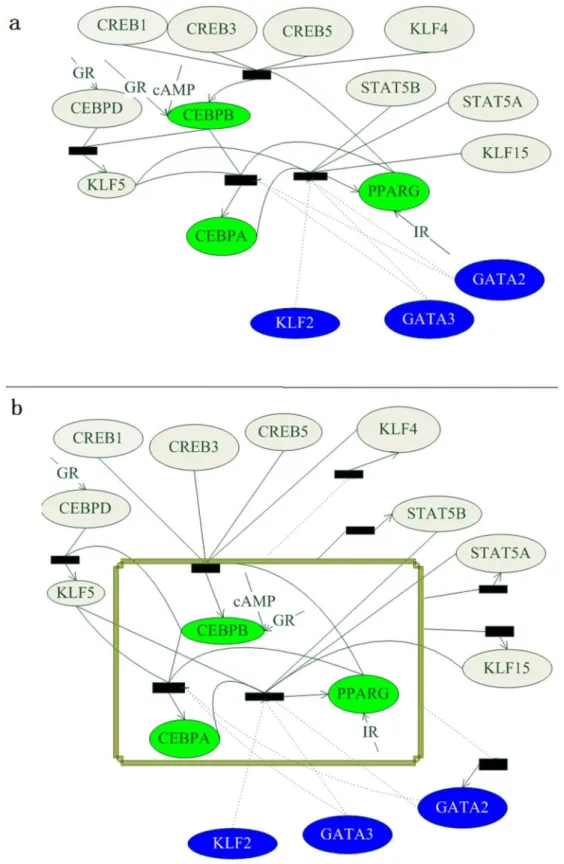
Figure 2. The gene regulatory network (GRN,a -Model 1) and the modified GRN (b-Model 2) of adipogenesis. Blank ovals are adipogenic factors, blue ovals are anti-adipogenic factors, and green ovals are the three key markers. Rectangles are combinations of TFs, where solid lines indicate positive regulations and dash lines indicate negative regulations.
where m is the total number of direction vectors, pi is the ith direction vector,ayiis the linear regression coefficient, andrendis
the final residual.
As m is frequently smaller than the dimension of input, the linear coefficients are thus recovered from the PLS transforma-tions. Each direction vector pi is transformed from linear
combination of the original input:
pi~
P
i{1
j~1(I{½c j 1,c
j 2,::,c
j n
T
:½ajx1,ajx2,:::,ajxn):½ci1,ci2,::,cinT ð7Þ
whereIis the diagonal matrix.
For positive regulations with negative weights assigned by PLS, the weights are modified to small positive values, and vice versa. The number of direction vectors corresponds to both the fitting results and the complexity of the regression model. The log-penalized regression method is used to ensure better generalization capability of the model [15]. In this study, the first n modified direction vectors of PLS with small residuals are maintained for further analysis by the penalized regression method.
n/arg min½two norm residual errorDDy{X m
i~1
aiy:piDD:log (1zm) ð8Þ
As external signals inculding cAMP and glucocorticoid receptor (GR; coupling with the ligand) play leading roles in the regulation of CEBPb, data in the interval between preadipocyte and
immature adipocyte were removed when optimizing the weights of the transcription factors targeting CEBPb.
Sigmoid function
Sigmoid functions have been used to model nonlinear gene regulations extensively [16,17]. They exhibit the saturation characteristic and are robust when dealing with extreme values; and the combination weights of the TFs within a sigmoid function amount to the regulatory strengths which are analogous to the parameters (e.g. efficiency coefficients and orders) in the Hill equation. We therefore used sigmoid function to formulate gene regulatory relationships [16]. AssumingAis the linear combina-tion of transcripcombina-tion factors (TFs) of a target gene, andk1,k2and
k3 are the modified coefficients. The sigmoid function of A is
defined as:
f(A)~ k1
1ze{k2:(A{k3) ð9Þ
and
A~X
n
i~1
(qi:xi) ð10Þ
wherenis the total number of TFs,qiis the weight of theith TF
Xi. The sign ofqiis positive whenXiperformed positive regulation,
and vice versa. If negative TFs dominate the target gene expression,Ais negative, and the function ofAis thus modified as:
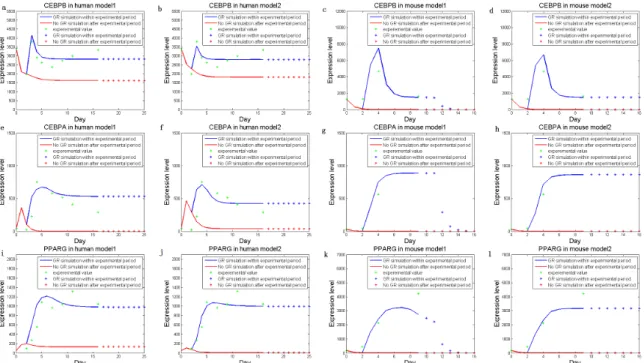
Figure 3. Simulated dynamic expression levels of the three key markers, human CEBPb(a,b), CEBPa(e,f), PPARc(i,j), and mouse CEBPb(c,d), CEBPa(g,h), and PPARc(k,l), without (Model 1) or with (Model 2) additional feedbacks.Lines are expression levels simulated within real experimental periods, and dots are data predicted after the end time point. Simulated expression levels are shown in blue (when an external signal is present) and red (no external signal) respectively. The experimental expression levels are displayed as green dots.
f(A)~ k1
1ze{k2:({DADzk3)~
k1
1ze{k2:(Azk3) ð11Þ
Expectation Maximization algorithm
An Expectation Maximization (EM) algorithm was used to calculate the unobserved values of the linear combinations of TFs [18]. The algorithm works as follows:
(1) Initialize the parameters set;
(2) Expectation Step: calculate the expected values for missing features;
(3) Maximization Step: compute the revised parameter estimates; (4) Iterate (2) and (3) until convergence.
Bayesian Information Criterion
Bayesian Information Criterion (BIC) is a popular criterion for model evaluation [19]. For regression problems, the BIC formula is:
BIC(P)~ln (err2)zP:
lnN
N ð12Þ
wherePis the effective number of parameters, err2is the residual error comparing with training data, andNis the number of data items in the training set.
Normally, the total number of parameters remains unchanged in known regulatory networks. When using our algorithm, the effective number of parameters may change as optimal parameters are selected [20]. The number of direction vectors rather than number of original features is regarded as the effective parameter number in PLS. In addition, when optimizing the weights for the TF combinations, a new direction vector is computed in each iteration, and the conbination weights are computed based on the new direction vector. The criteria associated to the effective parameter number included: (1) Relative changes of direction vectors, which were calculated as sum of the absolute differences in anti-tangents of the weights between consecutive iterations; (2) Logarithm of iteration number, which is used as a penalty. The effective number of parameters is equal to the relative change multiplied by the penalty.
Ordinary Differential Equation model
An Ordinary Differential Equation (ODE) model was con-structed for the dynamics of the adipogenic gene network. Sigmoid functions were used to formulate the transcriptional regulations; and degradations of mRNAs were assumed to follow the first-order kinetics [21]. The ODEs were solved by the Gear’s method [22]. When simulating the gene expressions with the presence of stimuli, cAMP and GR signalings were added to the gene regulatory network at preadipocyte (day 0 for both human and mouse) and withdrawn at immature adipocyte (day 3 for human and day 2 for mouse), when the insulin receptor (IR) signaling also came into effect [27]. The signal intensities of cAMP and GR were set to decrease over time from pre- to immature- adipocyte. As the mouse expression data were not available between these time points, signal intensities of stimuli had to be assigned as constants. Details of the ODEs and all the associated parameters were presented in Texts S1, S2 and S3 and Tables S1, S2, S3 and S4. As expression levels of the human GATA2 were truncated to the minimum value 20 for most of the time points, transcriptional regulations from GATA2 were excluded in the modeling of human adipogenesis, i.e. all weights of the GATA2-associated
regulations were set to zero. Table
Bistability analysis
Positive feedbacks can give rise to bistability in bio-systems [23], i.e.deviations in initial values may result in distinct equilibriums under the same regulatory framework. To calculate the equilib-riums for each gene, the ODE system was simulated in an adequately long time frame (t= 100, corresponding to day 98 after the induction of differentiation), and equilibriums of gene expressions were tracked via a trust-region method [24].
Small-sample iterative optimization algorithm
Numerous techniques have been developed for parameter estimation based on time-series data. In this work, we have developed a new small-sample iterative optimization algorithm (SSIO) for parameter estimation by integrating PLS, a penalized-regression, sigmoid functon, EM algorithm and BIC.
For a regulatory network withngenes, the dynamic expression level of theith gene (Y,ii =1, …, n) is described as
dyi
dt~F(Xi){di:yi ð13Þ
Figure 4. Results of local sensitivity analysis. Alteration of stability is observed in the human (a) but not in mouse (b). doi:10.1371/journal.pone.0110563.g004
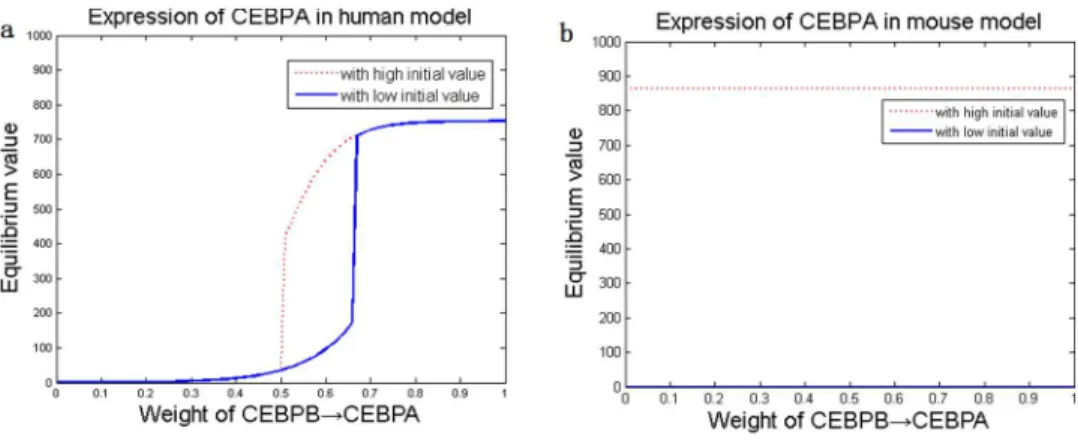
Figure 5. Steady-state gene expressions in human and mouse adipocyte differentiation.The bistable states of CEBPa(a,b) and PPARc(c, d) due to elevation of CEBPbtranscription rate, bistability of CEBPb(e,f) and PPARc(g,h) due to CEBPaelevation, and bistability of CEBPb(i,j) and CEBPa(k,l) due to PPARcelevation, are shown. Blue solid/red dash: low/high initial values in adipocyte differentiation.
where F(Xi) is a function of the expression levels of the TFs
controlling the ith gene expression, which describes the transcription rate of theith gene; anddiis the degradation rate
constant.
The sigmoid function is used to approximate the nonlinear regulations between the TFs and their target genes:
F(Xi)~ ki1
1ze
{ki2:((P m
j~1
qij:Xij){ki3)
ð14Þ
where ki1, ki2 and ki3 are the modified coefficients of the expressions of the TFs regulating the ith gene; Xij is the
expression level of the jth TF, and it is weighted by qij. In the
studied network, if no TF is responsible for the expression of thei th gene, thenF(X) is set as
F(Xi)~k1 ð15Þ
Usually, if the total number of TFs in a network is greater than the number of time points, dimension reduction is required for parameter estimation. Partial Least Squares (PLS) is one of the widely-used dimension-reduction methods, which outperforms Principal Component Analysis (PCA) and Principal Components Regression (PCR) [5]. Therefore, PLS is used to reduce the feature
dimensions for genes regulated by multiple TFs. Together with (11), the dynamic expression of theith gene is obtained:
dyi
dt~
ki1
1ze
{ki2:((P m
j~1
qij:Xij){ki3)
{di:yi ð16Þ
The Expectation Maximization (EM) method is further used to gradually estimate the model parameters, because only partial parameters could be directly obtained by PLS. Degradation constants and the modified coefficients of transcription rates, altogether with the weights qij, are optimized by a traditional
nonlinear least-squares method (e.g. the trust-region method). The proposed algorithm is described in detail below:
N
Step 1: Initialize and normalize the weights for all the TFs of each gene (Yi) using PLS, where expression levels of TFs areindependent variables, and the level of theith gene (Yi) is the
dependent variable.
N
Step 2: Initialize k , k , k and d .i1 i2 i3 iN
Step 3: Loop fromStep 4 toStep 8 until all the weights converge to a predefined criterion (relative change,1e-08), or the number of iterations exceed the maximum threshold (e.g. 100).N
Step 4: Optimize ki1, ki2, ki3 and di using the trust-region method [24]: In each iteration, initialize the ODEs with the current training data, and simulate the gene levels at the next time point using the Gear’s method. Values of the parameters are obtained via minimizing the (squared) deviation between the simulation and training data by a trust-region method. This step corresponds to the ‘Maximization Step’ of EM algorithm.N
Step 5: Simulate the ODEs at all later time points initiating with the gene levels at the beginning time point.N
Step 6: AfterStep 5, calculate and normalize the weights (qij)of the TFs of theith gene using PLS. The simulated levels of the ith gene’s TFs are the input; and the ith gene is the output.
N
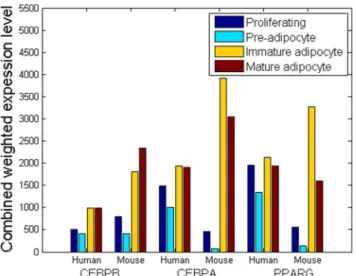
Step 7: Optimize the weights of TFs. The weights are calculated by adding the values of the previous loop with the (normalized) output vectors of PLS obtained in Step (6), which need to be multiplied by certain scalars. The scalars are derived from optimization. The ODEs are initialized with the training data of each time point and simulated to the next time point by the Gear’s method. The scalars are obtained via the trust-region method by minimizing the (squared) deviation between the simulation and training data. This step corre-sponds to the ‘Expectation Step’ of EM algorithm.Figure 6. Combined weighted-expression levels of TFs target-ing the three key markers,i.e.CEBPb, CEBPaand PPARc, at the four stages of adipocyte differentiation.
doi:10.1371/journal.pone.0110563.g006
Table 2.Statistical significance of differences (p-values) between human and mouse in weighted-expressions of TFs targeting CEBPb, CEBPaand PPARc, at adjacent time points.
Proliferating -.preadipocyte Preadipocyte -.immature adipocyte Immature adipocyte -.mature adipocyte
CEBPb 0.2090 0.9996 0.2090
CEBPa 0.2090 0.2090 0.0361*
PPARc 0.0310* 0.6751 0.0310*
Note: The two-sample Kolmogorov-Smirnov test is used to point out significant differences between human and mouse. Data are treated by z-score normalization. *Significant p-values.
N
Step 8: Save ki1, ki2, ki3, diand pijderived from the current loop.N
Step 9: Perform model evaluation based on BIC [19]. After each loop, substitute in the derived paramters and simulate the ODEs initiated with the training data at each consecutive time point. The (squared) residual error of the simulation data (comparing with training data) are computed and substituted in the BIC formula. For sets of parameter values derived in each loop, the one with the minimum BIC score is selected. The SSIO algorithm is illustrated in Figure 1 and the pseudocode is presented in Text S4.Markov Chain Monte Carlo sampling for global sensitivity analysis
The Markov Chain Monte Carlo (MCMC) method is widely used for sampling from certain posterior distributions following a given probabilistic background in a high -dimensional space [25]. The key step in MCMC is to construct a Markov chain whose equilibrium distribution equals the target probability distribution. For global sensitivity analysis of our gene regulatory model, MCMC works as follows:
(1) Construct a transition kernel of an ergodic Markov chain. In this study, the prior distribution for each of the parameters is the uniform distribution;
(2) Simulate the chain until it reaches equilibrium. The Metropolis-Hastings sampling method is used to determine whether the new sample (h*
) is acceptable based on theavalue:
a~P(h
DX)q(hn?h)
P(hnDX)q(h?hn) ð17Þ
wherePðhDXÞandPðhnDXÞare the posterior probabilities of the n th accepted sample and the new sample, qðhn?hÞ is the transition probability from the n th accepted sample to the new sample, andqðh?hnÞis the transition probability from the new sample to the n th accepted sample. In the ODE gene regulatory model, the residual error is considered to be reciprocal to the posterior probability and the transition probability is unchanged because of the uniform prior distribution [26]. Hence, a is re-formed as:
a~Dresidual error ofh nD
Dresidual error ofhD ð18Þ
A random number is generated from the uniform distribution on(0, 1). If it is smaller thana, the new samplehis accepted, otherwise the sample is unaccepted.
(3) Perform global sensitivity analysis. In this study, the Kolmogorov-Smirnov (K–S) statistic is used to calculate the sensitivity of each parameter [26]:
K{S~supDF1{F2D ð19Þ
where F1 is the cumulative distribution of samples which responded to external signals properly, whereas F2 is the cumulative distribution of samples which responded to external signals improperly. The interval for the K–S statistic is set to 10.
In this work, degradation constants were sampled within the range of60.1 around their values since if the value was too small, expression levels might increase unboundedly; while if it was too high, system function would be abnormal. Regulatory coefficients of TFs were sampled from the uniform distribution in interval [0, 1]. Other parameters were uniformly sampled from the interval between 0 and twice of their values, if they were greater than 0.25, or sampled from [0, 0.5] otherwise.
Results and Discussion
Algorithm verification and model evaluation
We first optimized the parameters (Tables S1, S2, S3 and S4) of the nonlinear gene regulatory model of adipogenesis (Model 1; Figure 2a) [8,9,10], using the experimental time-series gene expression profiles during adipogenesis as the reference data. Some basic biology constraints are used as evaluating criteria for the parameter estimation: 1) The simulated dynamic-expression pattern of all the genes during adipogenesis should be consistent with the real experimental results; 2) Moreover, the model complied with the essential fact that the three key markers of adipogenesis,i.e. CEBPb, CEBPaand PPARc, are differentially expressed during the adipocyte differentiation induced by external stimuli (e.g. cAMP, GR or IR) [8,27]. The second criterion is vital to the simulation’s effectiveness because it determines the nature of the simulation result.
We approximated the parameter values that guaranteed the consistency of model simulations with the experimental data. As shown, the derived model simulated gene expressions accurately (Figure 3). In fact, Figure 3 shows that in the absence of external signals (i.e. stimuli = 0), the levels of all three key markers are reasonably simulated to be low (close to the levels before adipocyte differentiation); meanwhile, in the presence of stimuli, simulated levels of the three TFs are high accordingly (near the levels after differentiation). The data indicate that our method reaches appropriate results on the proper regulatory model.
Positive feedbacks in gene regulatory networks play important roles in generating bistability or binary responses (i.e. bifurcation of the steady-states of gene expressions) [23,28], thus producing robust developmental switches. A recent study reported that three consecutive positive feedback loops,i.e.loop between CEBPaand PPARc, loop between PPARc and CEBPb, and loop between PPARc and the insulin receptor, drove a sequence of robust irreversible events in adipocyte differentiation [27]. To better reveal the regulatory mechanisms, we thereby explored whether there might exist any other unidentified feedback regulations in adipocyte differentiation.
To investigate potential feedbacks, we focused on the key adipogenic markers [27,29],i.e. CEBPb, CEBPaand PPARc, and other adipogenic genes with significant differential expressions (more than two-fold) [30,31], which included two down-regulated genes KLF4 and GATA2 and three up-regulated genes STAT5a, STAT5band KLF15 (Figure 2b). The adipogenic gene network was thus modified to cover five possible feedbacks from the key markers to the differentially-expressed genes. Parameters of the modified network model (Model 2) were optimized using SSIO.
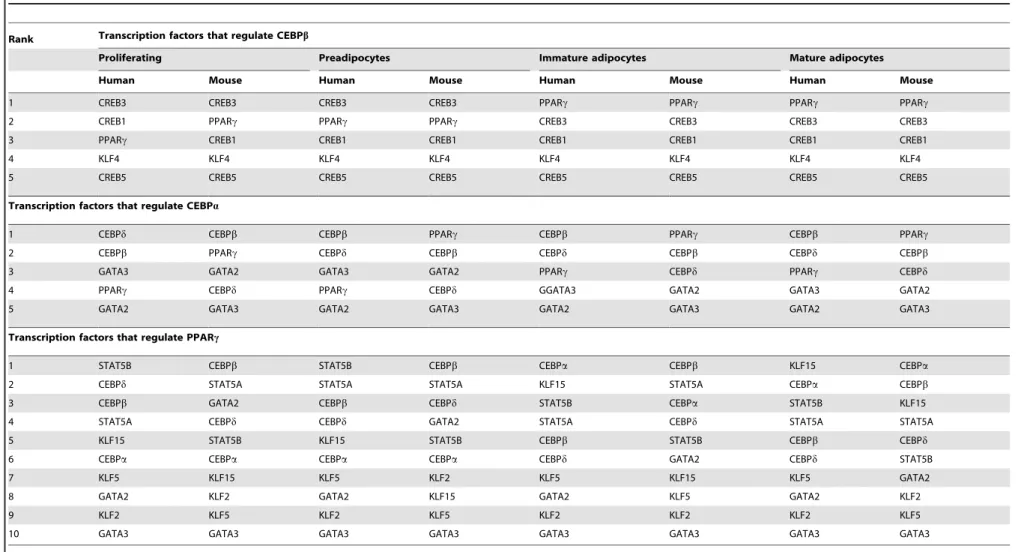
Table 3.Ranked importances of regulatory relationships between human and mouse adipogenesis.
Rank Transcription factors that regulate CEBPb
Proliferating Preadipocytes Immature adipocytes Mature adipocytes
Human Mouse Human Mouse Human Mouse Human Mouse
1 CREB3 CREB3 CREB3 CREB3 PPARc PPARc PPARc PPARc
2 CREB1 PPARc PPARc PPARc CREB3 CREB3 CREB3 CREB3
3 PPARc CREB1 CREB1 CREB1 CREB1 CREB1 CREB1 CREB1
4 KLF4 KLF4 KLF4 KLF4 KLF4 KLF4 KLF4 KLF4
5 CREB5 CREB5 CREB5 CREB5 CREB5 CREB5 CREB5 CREB5
Transcription factors that regulate CEBPa
1 CEBPd CEBPb CEBPb PPARc CEBPb PPARc CEBPb PPARc
2 CEBPb PPARc CEBPd CEBPb CEBPd CEBPb CEBPd CEBPb
3 GATA3 GATA2 GATA3 GATA2 PPARc CEBPd PPARc CEBPd
4 PPARc CEBPd PPARc CEBPd GGATA3 GATA2 GATA3 GATA2
5 GATA2 GATA3 GATA2 GATA3 GATA2 GATA3 GATA2 GATA3
Transcription factors that regulate PPARc
1 STAT5B CEBPb STAT5B CEBPb CEBPa CEBPb KLF15 CEBPa
2 CEBPd STAT5A STAT5A STAT5A KLF15 STAT5A CEBPa CEBPb
3 CEBPb GATA2 CEBPb CEBPd STAT5B CEBPa STAT5B KLF15
4 STAT5A CEBPd CEBPd GATA2 STAT5A CEBPd STAT5A STAT5A
5 KLF15 STAT5B KLF15 STAT5B CEBPb STAT5B CEBPb CEBPd
6 CEBPa CEBPa CEBPa CEBPa CEBPd GATA2 CEBPd STAT5B
7 KLF5 KLF15 KLF5 KLF2 KLF5 KLF15 KLF5 GATA2
8 GATA2 KLF2 GATA2 KLF15 GATA2 KLF5 GATA2 KLF2
9 KLF2 KLF5 KLF2 KLF5 KLF2 KLF2 KLF2 KLF5
10 GATA3 GATA3 GATA3 GATA3 GATA3 GATA3 GATA3 GATA3
doi:10.1371/journal.pone.0110563.t003
Dynamic
Modellin
g
Adipocyte
Network
ONE
|
www.ploson
e.org
9
October
2014
|
Volume
9
|
Issue
10
|
observation in turn implied that the TFs in human and mouse adipocytes differed in the regulatory efficiencies.
Some of the additional regulations are supported by experi-mental evidence. Researches have reported that PPARcregulates STAT5a, and CEBPa or CEBPb regulates STAT5b during adipogenesis [32]; KLF4 is down-regulated by CEBPb after adipocyte differentiation [33]; and CEBPb or CEBPa induces KLF15 expression [34]. In the meantime, studies have shown the PPARc-independent down-regulation of GATA2 during differen-tiation [35], which makes it reasonable to test the possibility of whether CEBPband/or CEBParegulate GATA2.
To further evaluate SSIO, we compared its performance to two other commonly-used methods, i.e. PCA and Linear-PLS. Generally, SSIO produced lower residual errors in computation (Table 1) and the results satisfied biological rationality (e.g. responses to stimuli, steady-states). The data herein indicated that our method inferred gene regulations more appropriately com-pared with the other methods. In fact, the procedure of log-penalized regression (in PLS, earlier contexts) and the step of model evaluation (BIC, Step 9) in the pipeline of SSIO is vital to the success of simulation. To further demonstrate this, we inspected the effects on model inference that over-fitting or under-fitting might cause. Without a penalized method, the over-fitting of the data showed that the system responded to external signals incorrectly, which did not satisfy criterion 2. And without appropriate evaluation (i.e. inadequate iteration before conver-gence to proper criteria), the result of under-fitting incorrectly reflected the expression levels of the key adipocyte genes during differentiation (Figure S1).
Sensitivity analysis and kinetic analysis
MCMC simulations were combined with the Kolmogorov-Smirnov (K–S) statistical test to examine and compare the parameter sensitivities of the human and mouse gene regulatory models. All parameters were sampled for perturbations at first and the Markov Chain reached equilibrium as the number of samples got large. The results turned out that very low percentage of samples responded to external signals properly, with less than 1% in human and about 13% in mouse (Table S5). Thus it indicated that the parameters in the models were generally sensitive (i.e. important for maintaining the functional normality), as overall random perturbations of parameters ruined the system functions. However, based on the generic results as above, it was difficult to compare the differences in gene regulations between human and mouse or rank the importances of regulatory factors in the respective species. Therefore, we focused on the regulatory coefficients of the TFs and sampled them by MCMC to specifically assess their sensitivities. The Markov Chain quickly reached the equilibrium when the sampling process was progressed near 9000 samples, as the difference of frequency distribution was smaller than 0.0001. The percentage of samples properly responding to external signals was quite high, with more than 50% for human and 17% for mouse (Table S5). Thus it indicated that the TF-associated parameters were relatively robust, coinciding with the fact that gene regulations generally have robustness in biology [36]. Table S6 shows the results for the K–S statistical test after removing the first 10000 samples (i.e. meaningless samples, which were generated before the Markov Chain converged). The results suggested that there were several differences in the regulatory strengths/efficiencies of the key markers’ TFs in human and mouse adipocytes; and such differences might be responsible for
the more sensitive adipogenesis regulatory system of human, compared with mouse (Table S6, signed with asterisk ‘*’).
In a gene regulatory network, fluctuations in gene expressions (e.g. increasing in the transcription rates) may result in different cell fates,e.g.bistability, in which more than one possible stable states are exhibited in response to cellular signals [37]. To examine the dependences of the dynamics of the system on the regulatory parameters, local sensitivity analysis was performed to assess the extents that individual parameters affected the states of the regulatory system [38]. The results showed that all the parameters corresponding to bistability were more sensitive in human than mouse; besides, alterations of some parameters eliminated the bifurcations in the human system but identical alterations on the same parameters in the mouse system did not change the bifurcations (Figure 4 and Figure S2).
Based on the optimized adipogenesis network, we implemented a series of dynamic simulations to analyze how the three key adipogenic genes affected each other during adipocyte differenti-ation. The external signals,ie. cAMP, GR and IR, were set to zero. An increase in the transcription rate was introduced to one of the three key adipogenic genes, and the extent of its influence on the stable states of the other two genes’ expressions was examined. Bistability, characterized by the existence of two stable states, was observed (Figure 5). Specifically, simulations demonstrated that high expression of one gene (i.e. increased transcription rate) would trigger the other two genes to elevate the expression equilibriums from low levels to high levels (Figure 5). The trigger levels were about 600 (a.u.) in mouse, which were much higher than those found in human (around 300 a.u.), indicating that human adipocyte differentiate more easily in response to external signals.
Comparison of gene regulations in human and mouse adipogenesis
Many genes and proteins are functionally homologous between human and mouse [39]. It is suggested that the genetic basis of the morphological differences lies, at least in part, in alterations of the molecular regulations between the species during evolution rather than changes in the molecular functions [40]. Under the basic framework of the common regulations, differential regulations of gene expressions are informative in understanding the gene regulatory mechanisms within or between the species. Fortunately, with a quantitative model of the gene network, the regulatory effects of the TFs can be quantified and compared.
Nevertheless, although the overall levels of the TFs were not significantly different, the changes in the levels of the CEBPaand PPARc-associated TFs between two adjacent stages (i.e. prolifer-ating R preadipocyte, preadipocyteR immature, immatureR
mature) differed significantly in human and mouse (Table 2). It indicated that although the overall regulatory effects that the TFs exerted on the key adipocyte genes were similar in each stage, the individual TFs might undergo different changes to achieve the (differential) regulations of adipogenesis in human and mouse respectively.
For a clear summary, we ranked the molecular regulations in the order of their importances. The importance was evaluated by the weighted effect thatith regulator contributed to the changes of jth gene’s expression level, i.e. the corresponding Jacobian coefficient of the dynamic equations multiplied by the expression level of the regulator. The evaluations were carried out at all four stages of adipocyte differentiation. Several differences were observed in the regulations associated to the three key adipocyte genes, CEBPb, CEBPaand PPARcbetween human and mouse (Table 3). The results herein showed that different regulatory efficiencies existed between the homologous human and mouse genes. In the meantime, the listed regulatory relationships, as well as the involved homologous genes, might essentially contribute to the differential regulations of adipogenesis in human and mouse.
Conclusion
Generally, biological experiments often generate small-sized samples due to limitations of resources or technological obstacles. Consequently, the small sample sizes (i.e.number of data points) impose restrictions on dynamic and quantitative bio-network modeling, leading to either the difficulty in finding the solution or the problems of overfitting/underfitting. Therefore, a reliable method for the modeling of dynamic biological networks is needed, especially in the case of small-sized datasets. In this study, we designed the SSIO, a parameter-estimation algorithm solving the issue of GRN inference with a heuristic strategy.
By verifying the performance of SSIO with biological knowl-edge (e.g.responses to stimuli, steady-states) and comparing it with two other widely-used methods (PCA and Linear-PLS), it was demonstrated that SSIO was an effective approach for quantita-tive modeling of dynamic GRNs (in the case of small-sized samples). Using SSIO, regulatory effects of the TFs associated to key adipocyte genes were quantified; thereby we observed multiple differences in the gene regulations between human and mouse, which might bring insights into the gene regulatory programs of adipogenesis.
Supporting Information
Figure S1 Over-/under-fitting results for adipocyte differentiation (*.tif). The over-fitting results (without the
penalized method) of CEBPb(a), CEBPa(b), PPARc(c) exhibit incorrect responses to stimuli; and the under-fitting results (without adequate BIC evaluation;d), incorrectly simulate the steady-states. (TIF)
Figure S2 Additional results of local sensitivity analysis are provided herein (*.tif). Alterations of steady-states are observed in human (a,c,e,g,i,k) but not in mouse (b,d,f,h,j,
l). (TIF)
Table S1 Parameters optimized by the SSIO method. (DOC)
Table S2 Weights of regulatory relationships optimized using SSIO.
(DOC)
Table S3 Fixed parameters used in the optimization. (DOC)
Table S4 Time points corresponded to adipocyte dif-ferentiation stages.
(DOC)
Table S5 Number of MCMC samples. (DOC)
Table S6 Values for the K–S statistic. (DOC)
Table S7 Statistics significance (P-value) of time series differences in weighted expression levels of transcrip-tion factors targeting PPARc.
(DOC)
Text S1 Ordinary differential equations. The evolution equations consist of fifteen ordinary differential equations (ODEs), which are listed below. Eqs. 1–15 describe human and mouse models without additional feedbacks. As for models with additional feedbacks, Eqs. 1,8,9,12 and 13 are replaced by Eqs. 16–20 correspondingly.
(DOC)
Text S2 Combination formula. (DOC)
Text S3 External signals. (DOC)
Text S4 Pseudocode of SSIO. (DOC)
Author Contributions
Conceived and designed the experiments: YW YL. Performed the experiments: YW. Analyzed the data: YW CJ SS RL. Contributed reagents/materials/analysis tools: YW CJ SS RL. Wrote the paper: YW HS RL. Helped the first author collect part of references: YL YC.
References
1. Ihmels J, Levy R, Barkai N (2004) Principles of transcriptional control in the metabolic network of Saccharomyces cerevisiae. Nat Biotech 22: 86–92. 2. Hasty J, McMillen D, Isaacs F, Collins JJ (2001) Computational studies of gene
regulatory networks: in numero molecular biology. Nat Rev Genet 2: 268–279. 3. Ma S, Dai Y (2011) Principal component analysis based methods in
bioinformatics studies. Briefings in Bioinformatics 12: 714–722.
4. Wang K, Abbott D (2008) A principal components regression approach to multilocus genetic association studies. Genetic Epidemiology 32: 108–118. 5. Boulesteix AL, Strimmer K (2006) Partial least squares: a versatile tool for the
analysis of high-dimensional genomic data. Briefings in Bioinformatics 8: 32–44.
6. Dinicola S, D’Anselmi F, Pasqualato A, Proietti S, Lisi E, et al. (2011) A Systems Biology Approach to Cancer: Fractals, Attractors, and Nonlinear Dynamics. OMICS: A Journal of Integrative Biology 15: 93–104.
7. Hajer GR, van Haeften TW, Visseren FLJ (2008) Adipose tissue dysfunction in obesity, diabetes, and vascular diseases. European Heart Journal 29: 2959–2971. 8. Siersbæk R, Nielsen R, Mandrup S (2012) Transcriptional networks and chromatin remodeling controlling adipogenesis. Trends in Endocrinology & Metabolism 23: 56–64.
9. Farmer SR (2006) Transcriptional control of adipocyte formation. Cell Metabolism 4: 263–273.
11. Mikkelsen TS, Xu Z, Zhang X, Wang L, Gimble JM, et al. (2010) Comparative epigenomic analysis of murine and human adipogenesis. Cell 143: 156–169. 12. Bar-Joseph Z, Gerber GK, Gifford DK, Jaakkola TS, Simon I (2003)
Continuous representations of time-series gene expression data. J Comput Biol 10: 341–356.
13. Ho¨skuldsson A (1988) PLS regression methods. Journal of Chemometrics 2: 211–228.
14. Line SR, Liu X, de Souza AP, Yu F (2013) Translational signatures and mRNA levels are highly correlated in human stably expressed genes. BMC Genomics 14: 268.
15. Sweetkind-Singer JA (2003) Log-penalized linear regression Information Theory, 2003 Proceedings IEEE International Symposium on 286.
16. Haixin W, Lijun Q, Dougherty E (2007) Modeling Genetic Regulatory Networks by Sigmoidal Functions: A Joint Genetic Algorithm and Kalman Filtering Approach; pp. 324–328.
17. Gardner TS, Cantor CR, Collins JJ (2000) Construction of a genetic toggle switch in Escherichia coli. Nature 403: 339–342.
18. Dempster AP, Laird NM, Rubin DB (1977) Maximum Likelihood from Incomplete Data via the EM Algorithm. Journal of the Royal Statistical Society 39: 1–38.
19. Schwarz G (1978) Estimating the Dimension of a Model. 461–464. 20. Moody JE (1992) The Effective Number of Parameters: An Analysis of
Generalization and Regularization in Nonlinear Learning Systems. Advances in Neural Information Processing Systems: 847–854.
21. Polynikis A, Hogan SJ, di Bernardo M (2009) Comparing different ODE modelling approaches for gene regulatory networks. Journal of Theoretical Biology 261: 511–530.
22. Shampine L, Reichelt M, Kierzenka J (1999) Solving Index-1 DAEs in MATLAB and Simulink. SIAM Review 41: 538–552.
23. Ferrell JE, Xiong W (2001) Bistability in cell signaling: How to make continuous processes discontinuous, and reversible processes irreversible. Chaos: An Interdisciplinary Journal of Nonlinear Science 11: 227–236.
24. Coleman T, Li Y (1996) An Interior Trust Region Approach for Nonlinear Minimization Subject to Bounds. SIAM Journal on Optimization 6: 418–445. 25. Andrieu C, Doucet A, Holenstein R (2010) Particle Markov chain Monte Carlo
methods. Journal of the Royal Statistical Society: Series B (Statistical Method-ology) 72: 269–342.
26. Wagener T, Kollat J (2007) Numerical and visual evaluation of hydrological and environmental models using the Monte Carlo analysis toolbox. Environmental Modelling & Software 22: 1021–1033.
27. Park Byung O, Ahrends R, Teruel Mary N (2012) Consecutive Positive Feedback Loops Create a Bistable Switch that Controls Preadipocyte-to-Adipocyte Conversion. Cell Reports 2: 976–990.
28. Becskei A, Seraphin B, Serrano L (2001) Positive feedback in eukaryotic gene networks: cell differentiation by graded to binary response conversion. EMBO J 20: 2528–2535.
29. Sha H, He Y, Chen H, Wang C, Zenno A, et al. (2009) The IRE1a-XBP1 Pathway of the Unfolded Protein Response Is Required for Adipogenesis. Cell Metabolism 9: 556–564.
30. Tusher VG, Tibshirani R, Chu G (2001) Significance analysis of microarrays applied to the ionizing radiation response. Proceedings of the National Academy of Sciences 98: 5116–5121.
31. Baechler EC, Batliwalla FM, Karypis G, Gaffney PM, Ortmann WA, et al. (2003) Interferon-inducible gene expression signature in peripheral blood cells of patients with severe lupus. Proceedings of the National Academy of Sciences 100: 2610–2615.
32. Jung HS, Lee YJ, Kim YH, Paik S, Kim JW, et al. (2012) Peroxisome Proliferator-Activated Receptor Gamma/Signal Transducers and Activators of Transcription 5A Pathway Plays a Key Factor in Adipogenesis of Human Bone Marrow-Derived Stromal Cells and 3T3-L1 Preadipocytes. Stem Cells and Development 21: 465–475.
33. Ghaleb AM, Nandan MO, Chanchevalap S, Dalton WB, Hisamuddin IM, et al. (2005) Kruppel-like factors 4 and 5: the yin and yang regulators of cellular proliferation. Cell Res 15: 92–96.
34. Mori T, Sakaue H, Iguchi H, Gomi H, Okada Y, et al. (2005) Role of Kru¨ppel-like Factor 15 (KLF15) in Transcriptional Regulation of Adipogenesis. Journal of Biological Chemistry 280: 12867–12875.
35. Schupp M, Cristancho AG, Lefterova MI, Hanniman EA, Briggs ER, et al. (2009) Re-expression of GATA2 Cooperates with Peroxisome Proliferator-activated Receptor- Depletion to Revert the Adipocyte Phenotype. Journal of Biological Chemistry 284: 9458–9464.
36. MacNeil LT, Walhout AJM (2011) Gene regulatory networks and the role of robustness and stochasticity in the control of gene expression. Genome Res. 21(5): 645–657.
37. Gerard C, Goldbeter A (2009) Temporal self-organization of the cyclin/Cdk network driving the mammalian cell cycle. Proc Natl Acad Sci U S A 106: 21643–21648.
38. Hamby DM (1995) A comparison of sensitivity analysis techniques. Health Phys 68: 195–204.
39. Boguski MS (2002) Comparative genomics: The mouse that roared. Nature 420: 515–516.
40. Tautz D (2000) Evolution of transcriptional regulation. Current Opinion in Genetics & Development 10: 575–579.