A Mouse Model for the Metabolic Effects of the Human
Fat Mass and Obesity Associated
FTO
Gene
Chris Church1, Sheena Lee2., Eleanor A. L. Bagg3., James S. McTaggart2., Robert Deacon4
, Thomas Gerken3, Angela Lee1, Lee Moir1, Jasmin Mecinovic´3, Mohamed M. Quwailid1, Christopher J. Schofield3",
Frances M. Ashcroft2", Roger D. Cox1 *
1MRC Harwell, Metabolism and Inflammation, Harwell Science and Innovation Campus, Harwell, United Kingdom,2Henry Wellcome Centre for Gene Function, Department of Physiology, Anatomy, and Genetics, University of Oxford, Oxford, United Kingdom,3Chemistry Research Laboratory and Oxford Centre for Integrative Systems Biology, University of Oxford, Oxford, United Kingdom,4Department of Experimental Psychology, University of Oxford, Oxford, United Kingdom
Abstract
HumanFTOgene variants are associated with body mass index and type 2 diabetes. Because the obesity-associated SNPs
are intronic, it is unclear whether changes in FTO expression or splicing are the cause of obesity or if regulatory elements within intron 1 influence upstream or downstream genes. We tested the idea that FTO itself is involved in obesity. We show that a dominant point mutation in the mouseFto gene results in reduced fat mass, increased energy expenditure, and unchanged physical activity. Exposure to a high-fat diet enhances lean mass and lowers fat mass relative to control mice. Biochemical studies suggest the mutation occurs in a structurally novel domain and modifies FTO function, possibly by altering its dimerisation state. Gene expression profiling revealed increased expression of some fat and carbohydrate metabolism genes and an improved inflammatory profile in white adipose tissue of mutant mice. These data provide direct functional evidence thatFTOis a causal gene underlying obesity. Compared to the reported mouse FTO knockout, our model more accurately reflects the effect of human FTOvariants; we observe a heterozygous as well as homozygous phenotype, a smaller difference in weight and adiposity, and our mice do not show perinatal lethality or an age-related reduction in size and length. Our model suggests that a search for human coding mutations inFTOmay be informative and that inhibition of FTO activity is a possible target for the treatment of morbid obesity.
Citation:Church C, Lee S, Bagg EAL, McTaggart JS, Deacon R, et al. (2009) A Mouse Model for the Metabolic Effects of the Human Fat Mass and Obesity AssociatedFTOGene. PLoS Genet 5(8): e1000599. doi:10.1371/journal.pgen.1000599
Editor:Gregory S. Barsh, Stanford University School of Medicine, United States of America
ReceivedMarch 31, 2009;AcceptedJuly 14, 2009;PublishedAugust 14, 2009
Copyright:ß2009 Church et al. This is an open-access article distributed under the terms of the Creative Commons Attribution License, which permits unrestricted use, distribution, and reproduction in any medium, provided the original author and source are credited.
Funding:We thank the Medical Research Council (studentships to CC and JSM), Wellcome Trust (studentship to TG; OXION support for SL and RD), Royal Society (Research Professorship to FMA), the Biotechnology and Biological Sciences Research Council (to CJS; studentship to EALB), and the Newton-Abraham Fund (studentship to JM) for personnel support and the MRC, EU FP6 (LHSM-CT-2003-503041), and Wellcome Trust for financing the research (RDC, FMA, CJS). The funders had no role in study design, data collection and analysis, decision to publish, or preparation of the manuscript.
Competing Interests:CJS is a co-founder of ReOx, a company that aims to exploit discoveries on the hypoxic response for therapeutic benefit.
* E-mail: [email protected]
.These authors contributed equally to this work. "These authors also contributed equally to this work.
Introduction
In genome-wide association studies (GWAS) for type 2 diabetes, a single nucleotide polymorphism (SNP) within intron 1 of the fat mass and obesity-associated (FTO) gene was found to be associated with an increased risk of obesity [1,2]. Around 16% of the Caucasian population is homozygous for the risk allele and has an
,1.67-fold increased risk of obesity, weighing ,3 kg more than
controls. The risk allele is not associated with fetal growth but confers an increased risk of elevated body mass index (BMI) and obesity [1] that manifests by the age of 7 and persists into adulthood. These results have largely been confirmed in other populations [2–7].
FTOis a 9-exon gene located on human chromosome 16 and mouse chromosome 8. Sequence analyses suggested that FTO has homology with the AlkB family of DNA repair enzymes. Subsequent in vitro biochemical studies revealed FTO to be a member of the Fe(II) and 2-oxoglutarate (2OG) dependent
oxygenase superfamily [8]. In metazoans these enzymes are involved in diverse processes including oxygen sensing, DNA repair, fatty acid metabolism and post-translational modifications [9]. Recombinant FTO catalyses oxidative demethylation of 3-methylthymine and 3-methyluracil in single-stranded DNA and RNA [8,10], suggesting its physiological role involves nucleic acid modification. In vitro expression of murine FTO results in localisation of the recombinant protein to the nucleus, consistent with a role in nucleic acid modification [8].
FTO is ubiquitously expressed. In the brain, mRNA levels are particularly high within the hippocampus, cerebellum and hypothalamus [8,11]. In the hypothalamus, strong expression is seen in the arcuate, paraventricular, dorsomedial and ventrome-dial nuclei - sites critical for regulating energy balance [12].
other studies have found no association of variants with energy expenditure measured by calorimetry in adults [16,20] or food intake [21], the balance of evidence from population-based studies suggests that FTO intron 1 SNPs are associated with increased energy intake.
GWAS are a powerful way of identifying genes involved in common disease but it is often difficult to translate their findings into an understanding of how the gene products act at the cellular and whole animal levels. This is a particular problem when the disease-associated SNP lies within an intron, as is the case forFTO. One approach to identifying the function of a gene is to mutate it in a model organism. A mouse possessing a 1.6 Mbp deletion in mouse chromosome 8 that includesFtoas well asFtm,Ft1,Irx3,Irx5and
Irx6has been characterised (fused toesorFtmice) [22]. Homozygous
Ftmice are embryonic lethal and display neural tube defects, left-right asymmetry and polydactyly. Heterozygous mice have fusion of the forelimb digits and thymic hyperplasia [23]. Recently, a mouse FTO knockout has been described in which exons 2 and 3 ofFtoare replaced by a neomycin STOP cassette [24]. This cassette also deletes part of intron 1 although not the position equivalent to the BMI-associated SNPs in humanFTO. Homozygous FTO knockout mice were viable but showed significant postnatal death before 4 weeks of age. They also exhibited postnatal growth retardation, a reduction in adipose tissue, a reduction in lean mass, increased energy expenditure, increased sympathetic nervous system activity, relative hyperphagia and reduced spontaneous locomotor activity. Thus this study suggested that Fto is directly involved in energy metabolism and body weight regulation.
However, many human SNPs are likely to result in impaired function rather than total loss of function, and mouse knockouts are not always the most informative because they can result in a non-viable or severely compromised organism. Indeed, knockout of the mouseFtogene is associated with increased postnatal death and growth retardation [24], which is not observed for human
FTOvariants. We therefore searched the Harwell mouseN-
ethyl-N-nitrosourea (ENU) archive for anFtomutation that produces a partial loss of function.
We describe here a dominant missense mutation (I367F) in the mouseFtogene that results in a lean phenotype of reduced body
weight and fat mass. Physical activity and food intake is unchanged but metabolic rate is increased. We show by gene expression analysis that fat and carbohydrate metabolism are increased in mutant mice and they possess an improved inflammatory profile. On a high-fat diet mutant mice show a lower fat mass than wild-type mice. These results indicate that our mice provide an improved model for the human phenotype and provide functional evidence that theFTOgene is a causal gene underlying obesity.
Results
A Missense Mutation within theC-terminal Domain of FTO
In a screen of DNA from 6,624 mice from the Harwell ENU-induced mutagenesis archive [25] we identified an adenosine-to-thymidine mutation in exon 6 ofFto leading to substitution of a phenylalanine for isoleucine-367 (FtoI367F) in theC-terminal region of murine FTO (mFTO) (Figure 1A). Although this substitution lies outside the predicted double-stranded b-helix (DSBH) and associated elements that form the conserved ‘‘catalytic core’’ of 2OG oxygenases [9], the block of,20 amino acids surrounding
I367 is conserved in FTO throughout vertebrate evolution (Figure 1B), suggesting this region has a physiological role.
TheC-terminal regions of some 2OG oxygenases are known to facilitate oligomerisation [9,26]. We therefore compared expres-sion of full-length and C-terminal truncated (residues 1–408, 1– 387 and 1–329 inclusive) mFTO inEscherichia coli. Although wild-type mFTO was efficiently produced in a soluble form, C -terminally truncated forms of wild-type mFTO and full-length mFTOI367F gave only low amounts of largely insoluble protein (data not shown). By contrast, a His-tagged version of the
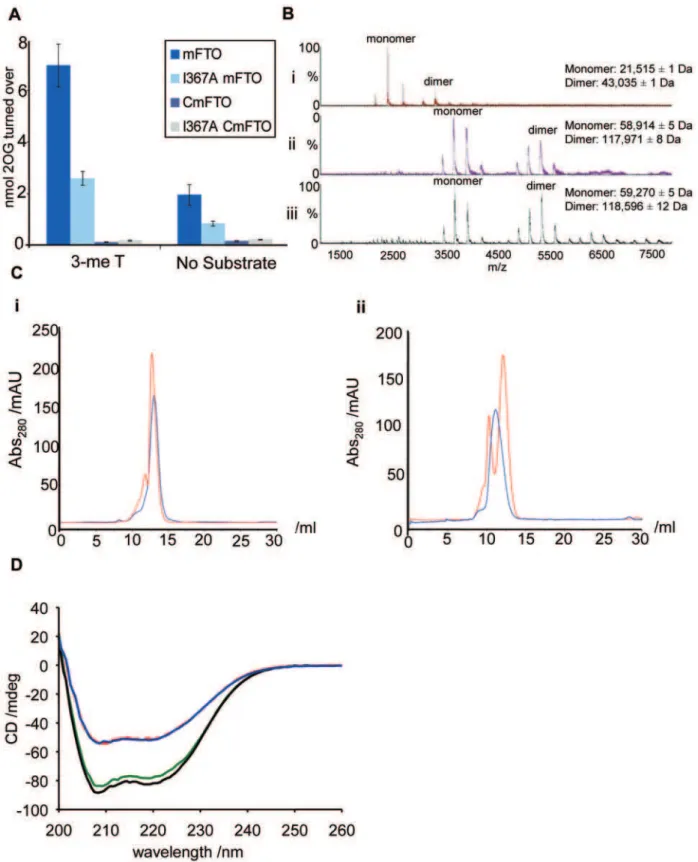
C-terminal domain alone (residues D329-end) of wild-type mFTO (CmFTO) was efficiently produced in soluble form, CmFTOI367F was largely insoluble. Mutation of residue I367 to alanine (I367A), however, yielded soluble mFTOI367Aand CmFTOI367Aproteins. The catalytic activity of mFTOI367A in the presence of a 3-methylthymine containing oligonucleotide substrate, as measured by 2OG turnover, was only,40% of wild-type mFTO (Figure 2A).
As anticipated, because they lack the DSBH core, neither CmFTO nor CmFTOI367Awere catalytically active (Figure 2A).
We analysed the oligomerisation states of mFTO and human FTO (hFTO) by non-denaturing mass spectrometry (MS, Figure 2B) and found that mFTO, hFTO and CmFTO exist as a mixture of monomeric and dimeric forms (Figure S1 and Figure S2). However, the proportion of dimeric mFTOI367A is signifi-cantly reduced relative to that in the wild-type mFTO (Figure S3). We also investigated the oligomerisation state of the proteins in solution using gel filtration chromatography (Figure 2C). This revealed that whereas wild-type mFTO and CmFTO exist in both monomeric and dimeric forms, both I367A variants exist, at least predominantly, as monomers. These results suggest that I367 is involved in dimerisation of FTO (Figure 2C). It was not possible to analyse mFTOI367F or CmFTOI367F because of their insoluble nature.
The secondary structure of the C-terminal domain was then investigated using circular dichroism spectroscopy (Figure 2D). In contrast to the full-length proteins, which contain the DSBH ‘‘core’’ domain of the 2OG oxygenases (comprising 8b-strands with surrounding loops and a-helices), the C-terminal domain proteins are predominantlya-helical (Figure S4 and Figure S5). A similar structural difference was observed for hFTO and its C -terminal domain (residues 332-end; ChFTO, Figure S6). The I367A mutation does not appear to alter the overall secondary structure fold of mFTO proteins (Figure 2D), despite preventing Author Summary
dimerisation. This suggests that the I367A proteins are correctly folded, but that isoleucine 367 is involved in dimer formation. Factor Inhibiting Hypoxia Inducible Factor (FIH), a human 2OG-oxygenase involved in the hypoxic response, also exists as a dimer [26]. For FIH, dimerisation is enabled by a C-terminal region. However, sequence comparisons, coupled with structural predic-tions, suggest that theC-terminal region of FTO and FIH will be substantially different, with that of FTO having a morea-helical character.
Overall, these results reveal that FTO can exist in both monomeric and dimeric forms and that theC-terminal domain is involved in dimerisation. The evidence suggests that the I367A (and presumably I367F) mutation disrupts dimerisation and results in a reduction of catalytic activity. In addition to the presumed lower activity of mFTOI367F, we cannot exclude the possibility that a reduced stability of mFTOI367F, leading to aggregation and/or proteolytic degradation, contributes to the phenotype.
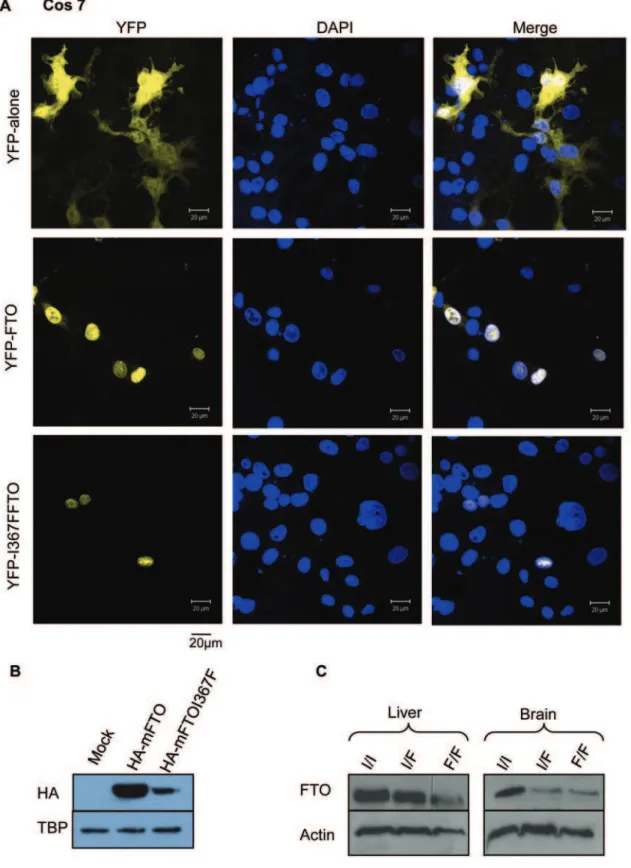
The Mutant FTO Protein Is Localised to the Nucleus and Expressed at Lower Levels in Mammalian Cells
To establish if mFTOI367F is stable in mammalian cells we transfected Cos-7 and PC12 cell lines with a plasmid encodingFto
or FtoI367F N
-terminally tagged with yellow florescent protein (YFP), or with YFP alone. Imaging revealed that like mFTO [8], mFTOI367F localised to the nucleus (Figure 3A and data not shown). However, fewer YFP-positive cells were observed than
when mFTO was transfected, suggesting mFTOI367Fis expressed at lower levels. This was confirmed by immunoblotting of lysates from cells expressing HA-tagged wild-type or mutant FTO (Figure 3B). Similarly, immunoblotting of heterozygous and homozygousFtoI367Fmouse brain and liver with an FTO antibody confirmed that the mutant protein is expressed at lower levels than wild-type (Figure 3C). These data therefore suggest that the I367F mutation results in reduced FTO protein levels and thus is likely to impair FTO function. However, it does not produce a total knockout as some mFTOI367Fprotein appears to be expressed and correctly targeted to the nucleus.
FtoI367FMice Are Lean
In order to determine if the mutation affects body mass, mice were weighed and measured weekly from 3 to 24 weeks. Both homozygous and heterozygous male mice carrying the dominant
FtoI367F mutation exhibited a maturity-onset reduction in body weight (Figure 4A) diverging from wild-type at 12 weeks of age (P = 0.01) and becoming,10% less than wild-type by 24 weeks.
There was no significant difference in body weight between heterozygous and homozygous male mice. No difference was observed between wild-type and mutant female mice (Table S1), and all further experiments described were therefore confined to male mice.
Dual Energy X-ray absorptiometry (DEXA) analysis revealed a 16–18% reduction in total fat mass between 24-week oldFtoI367F
Figure 1. An ENU-induced missense mutation I367F in exon 6 of FTO.(A) Sequencing reveals an A to T mutation in exon 6 of FTO that leads to conversion of the isoleucine at residue 367 to phenylalanine. (B) Sequence line-up showing isoleucine 367 (arrow) and surrounding residues are highly conserved in vertebrates. Colour code for amino acids indicates a consensus residue derived from a block of similar residues (black), a completely conserved residue (red), a residue weakly similar to a consensus residue (orange), a consensus residue derived from the occurrence of greater than 50% of a single residue (blue) and non-similar residues (dark-red).
doi:10.1371/journal.pgen.1000599.g001
Figure 2. The FTOI367Fmutation is within aC-terminal domain.(A) mFTOI367A(light blue) shows reduced catalytic activity in a 2OG turnover
assay with a 3-meT oligonucleotide substrate, compared to mFTO (dark blue). Neither CmFTO (purple) nor CmFTOI367A(grey) show significant 2OG turnover. Data are expressed as mean6SEM. (B) Non-denaturing electrospray ionisation mass spectrometry analyses showing the dimeric nature of (i) TheC-terminal domain of mFTO (CmFTO), (ii) Full-length mFTO and (iii) Full-length human FTO. The twin peaks present in the CmFTO sample likely result froma-N-gluconylation of the protein resulting in partial formation of a+178Da adduct (see Figure S1 and Figure S2). (C) Analytical gel filtration
chromatogram showing the presence of two FTO species in solution. (i) mFTO (red) and mFTOI367A(blue), (ii) CmFTO (red) and CmFTOI367A(blue). (D)
Circular dichroism spectra showing the secondary structures of mFTO (red), mFTOI367A(blue), CmFTO (green) and CmFTOI367A(black) at 0.25 mg/ml,
4uC.
Figure 3. The FTOI367Fprotein is expressed at lower levels and localised in the nucleus.(A) Confocal fluorescence images of COS-7 cells expressing YFP, YFP-FTO and YFP-FTOI367F, as indicated. First column: YFP fluorescence. Second column: fluorescence from 49 ,6-diamidino-2-phenylindole (DAPI), which stains nuclei. Third column: merged channels. (B) Western blot of protein from Cos cells expressing FTO or HA-FTOI367F, as indicated, probed with an anti-HA antibody. Below, loading control of the same gel probed with an anti-TATA-binding protein (TBP) antibody. (C) Western blot of protein from liver and brain of wild-type (I/I), heterozygous (I/F) and homozygous (F/F) mice probed with a polyclonal rabbit anti-FTO antibody. Below, loading control of the same gel probed with an anti-actin antibody.
doi:10.1371/journal.pgen.1000599.g003
and wild-type mice (Figure 4B). The proportion of body mass in fat was reduced by,4–7% from 36.4% fat in wild-type to 30.8–
32.9% fat in mutant mice. No significant difference in lean body mass was observed (Figure 4C). This suggests that the lower weight of the mutant mice is largely attributable to a decrease in fat mass. Measurement of 24-hour cumulative food intake revealed no statistically significant difference between control andFtoI367F
mice on a normal chow diet at either 10 or 20 weeks, even after normalisation for body weight (Figure 4D).
Mice Carrying theFtoI367FMutation Have a Higher Metabolic Rate
To investigate the mechanism underlying the reduced body weight, we measured O2 consumption, CO2 production and
respiratory exchange ratio (RER) at 18 weeks of age. Heterozy-gous and homozyHeterozy-gous FtoI367F mice showed an increase in O2
consumption (Figure 5A) and CO2production (Figure 5B) during
both the light and dark phase of activity. As a consequence, RER
was increased (Figure 5C). These data indicate the FtoI367F
mutation causes an increase in whole body metabolism and a switch to relatively more carbohydrate metabolism. There was no difference in physical activity between wild-type andFtoI367Fmice, as assessed by threshold crossing (Figure 5D), during either the light and dark periods of a 22-hour measurement period.
FtoI367FMice Show an Altered Leptin-Adipose Mass Set-Point and Increased Fasted Glucagon at 24 Weeks
An intraperitoneal glucose tolerance test (IPGTT) at 12 and 16 weeks of age did not reveal a significant difference betweenFtoI367F
and wild-type mice (Text S1 and Figure S7A, S7B). Fasted serum leptin levels were also not significantly different at 24 weeks (Figure S7C). When circulating leptin levels were plotted against the percentage of body fat we found (as expected) a positive correlation for both heterozygous and homozygousFtoI367F mice (r 0.56, r2 0.31, P = 0.0295 and r 0.54, r2 0.30, P = 0.0238, respectively). However, circulating leptin as a function of Figure 4. MaleFtoI367Fmice exhibit reduced body and fat mass.(A) Body weights of male heterozygous (I/F; n = 21) and homozygous (F/F; n = 28)FtoI367F
mice and of wild-type littermates (I/I; n = 15). (B,C) Fat mass (B) and lean body mass (C) of 24-week old male heterozygous (n = 26), homozygous (n = 15) and wild-type (n = 12) mice. (D) Food intake over 24 hours normalised to body weight (BW) measured at 10 weeks (I/I, n = 20; I/ F, n = 30; F/F, n = 15) and 20 weeks (I/I, n = 12; I/F, n = 20; F/F, n = 15). Data are expressed as mean6SEM, Statistical analysis was performed using Student’s t-test. *, P,0.05; **, P,0.01 for differences betweenFtoI367Fheterozygous or homozygous mice and wild-type littermates.
Figure 5.FtoI367Fmice exhibit enhanced metabolism.(A,B) Oxygen Consumption (A i) and carbon dioxide production (B i) over a 22-hr period for 18-week old male heterozygous (I/F; n = 30) and homozygous (F/F; n = 15)FtoI367Fmice and wild-type littermates (I/I; n = 26). Inset, total oxygen consumption (A ii), and carbon dioxide production (B ii) over 22-hr. (C) Respiratory exchange ratio (RER) calculated from data given in A, B during the light and dark period. (D) Physical activity over 23-hr for 18-week old male heterozygous (n = 10), homozygous (n = 11) and wild-type (n = 7) littermates. (E) Glucagon, glucose and lipid serum levels (as indicated) measured after overnight fasting at 24-weeks of age. WT (I/I; n = 12), heterozygous (I/F; n = 17), and homozygous (F/F; n = 15) littermates. Data are expressed as mean6SEM. *, P,0.05; **, P,0.01; ***, P,0.001 (Student’s t-test) for differences betweenFtoI367Fand wild-type mice.
doi:10.1371/journal.pgen.1000599.g005
percentage body fat in homozygotes was shifted to the left in comparison to controls suggesting higher leptin secretion per unit of body fat (Figure S7D). Levels of fasting serum glucagon, triglycerides, cholesterol and HDL were increased in 24-week old
FtoI367Fhomozygous mice (Figure 5E). Fasting serum glucose was also increased at 24 weeks (Figure 5E) but not at 12 or 16 weeks of age (Figure S7A, S7B). No significant difference was observed in serum insulin or adiponectin (Figure S7E, S7F). A 6-hour cold challenge at 22 weeks did not reveal a significant difference between genotypes (data not shown) suggesting that thermoregu-lation by brown adipose tissue (BAT) is unaltered.
FtoI367FMice Have Altered Catecholamines andb-3 Adrenoreceptor Expression
Urinary catecholamines were analysed at 10 and 20 weeks of age and normalised to urinary creatinine to control for volume. Ten-week old homozygous FtoI367F mice showed significantly higher norepinephrine (Figure 6A) and dopamine (Figure 6B), but no difference in epinephrine (Figure 6C), compared to wild-type mice. However, only dopamine was elevated in 20-week old homozygousFtoI367Fmice (P,0.05).
Sympathetic stimulation of white adipose tissue (WAT), brown adipose tissue (BAT) and muscle increases metabolism by stimulating lipolysis and thermogenesis. Expression of b-3 adrenoreceptor mRNA was increased in muscle and WAT, but not BAT, of 16-week old homozygousFtoI367Fmice as measured by quantitative reverse transcriptase-polymerase chain reaction (qRT-PCR) (Figure 6D–6F). Expression of uncoupling protein 2 (Ucp2), and the catecholamine degradation enzyme catechol-O-methyl transferase (Comt) were also upregulated in muscle of homozygousFtoI367F(Figure 6D).
FtoI367FMice Have Reduced Fat Mass and Increased Lean Mass on a High-Fat Diet
Analysis of 24-week-old mice given a high-fat diet from weaning revealed a significant reduction in fat mass and increased lean tissue mass inFtoI367F mice compared with wild-type mice (Figure S8A, S8B, S8C). There was no difference in food intake between genotypes at 10 and 20 weeks (Figure S8D). Fasting serum glucagon, glucose, triglycerides, and HDL-C levels were all increased in FtoI367F
homozygous mice whereas insulin levels were significantly lower (Figure S8E, S8F, S8G, S8H). Fasted serum leptin levels were significantly increased at 8 weeks inFtoI367Fmice but not at 24 weeks. A high-fat diet significantly increased oxygen consumption in both wild-type and mutant mice (Figure S8I, S8J, S8K, S8L, S8M), whereas carbon dioxide production increased in wild-type but notFtoI367Fmice (Figure S8J, S8M). Interestingly, we did not observe significant differences in either oxygen consumption or carbon dioxide output between mutant and wild-type littermates on a high-fat diet (in contrast to a normal diet). The RER of all mice was significantly reduced on a high-fat diet, reflecting an increase in relative fat metabolism. In the dark phase (when mice are active) FtoI367F mice maintained a significantly higher RER than wild-type mice (Figure S8K).
Gene Expression Analysis inFtoI367F Mutants
To determine if gene expression was altered inFtoI367F mice we carried out microarray analysis of WAT, liver and skeletal muscle from 16-week old wild-type, heterozygous and homozygous
FtoI367Fmice. The genes that changed in heterozygous mice were largely a subpopulation of those seen to change in homozygous mice: thus we focus here on differences between homozygous and
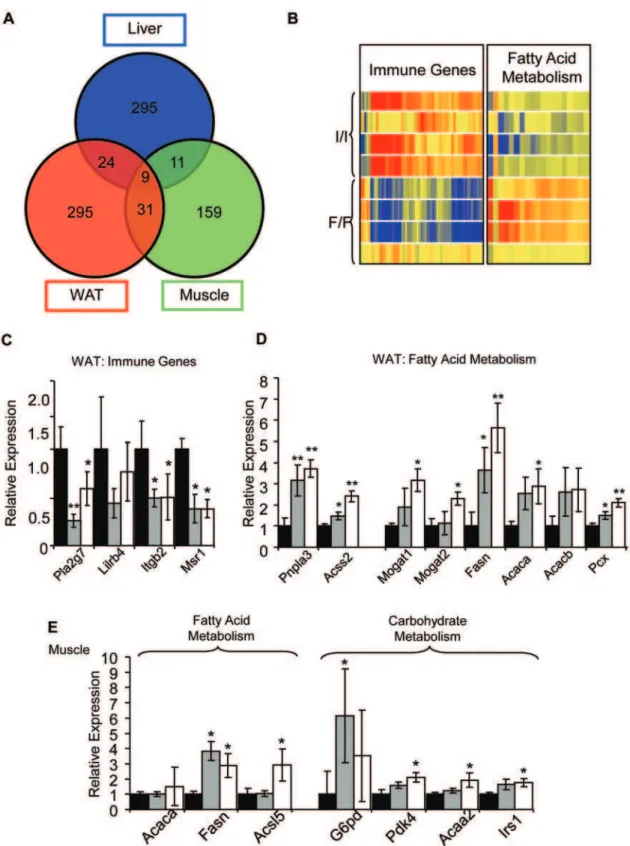
wild-type animals. Significant gene expression changes were found in all tissues, but very few were present in more than one tissue. Only 9 genes were found to change in all three tissues, 11 were common to muscle and liver, 24 to liver and WAT, and 31 to muscle and WAT (Figure 7A). Few of these changes were obviously related to the lean phenotype.
Multiple genes involved in inflammation were markedly down-regulated in abdominal WAT (Figure 7B and Table S2). These include the phospholipase A2 Pla2g7 (6.2-fold), the leukocyte immunoglobulin-like receptorLilrb4(4.7-fold), the Integrin beta 2
Itgb2 (4.3fold), the macrophage scavenger receptor 1 Msr1 (3.6 fold), and very many more. A reduction in expression of genes involved in the inflammatory response is consistent with the lean phenotype of theFtoI367F
mice as adipose tissue normally contains resident macrophages [27,28,29]. The array results were in good agreement with those obtained by qRT-PCR analysis (Figure 7C). Significantly, genes involved in the regulation of fat metabolism were also altered. Some genes involved in fatty acid catabolism were upregulated in WAT, as assessed by both microarray and qRT-PCR (Figure 7B and 7D and Table S3). These include patatin-like phospholipase domain containing 3 (Pnpla3), a triacylglycerol lipase, and acyl CoA synthetase (Acss2). Such changes may help explain the lower fat mass and higher RER of
FtoI367Fmice. Interestingly,Pnpla3has been associated with fatty liver disease in humans [30]: however the liver triglyceride concentration was unchanged inFtoI367Fmice (Figure S7G). Genes involved in fatty acid synthesis were also upregulated, including fatty acid synthase (Fasn), pyruvate carboxylase (Pcx), monoacyl-glycerol O-acyltransferase (Mogat1,Mogat2), and acetyl-Coenzyme A carboxylase (Acaca,Acacb). Given the reduced amount of WAT inFtoI367F mice, upregulation of genes involved in fat synthesis may be a secondary adaptation that attempts to compensate for the lower fat levels.
In muscle, fatty acid synthase (Fasn) was strongly upregulated in 16- week old homozygousFtoI367Fmice, being 10-fold higher by microarray and 3.5-fold higher by qRT-PCR (Figure 7E). Some genes involved in carbohydrate catabolism were also slightly upregulated, including glucose-6-phosphate dehydrogenase (G6pd), pyruvate dehydrogenase kinase (Pdk4) and insulin receptor substrate 1 (Irs-1; Figure 7E, Table S4). These changes are consistent with the idea that carbohydrate metabolism may be increased in muscle ofFtoI367Fmice.
Genes associated with endoplasmic reticulum (ER) stress and the unfolded protein response (UPR) also showed a small increase ($1.3-fold) in expression in the liver of 16-week old homozygous
FtoI367Fmice, as assessed by microarray studies (Figure S9). Such changes are too small to be measured by qRT-PCR. There were no major changes in metabolic genes, consistent with the lack of a change in plasma glucose concentrations at this time point.
qRT-PCR analysis of the key hypothalamic neuropeptidesAgrp,
Npyand Pomcrevealed no significant changes in relative mRNA expression betweenFtoI367Fand wild-type mice in the fasted state (Figure S10). However, a significant reduction inNpyexpression was observed inFtoI367Fmice in the free-fed state (Figure S10).
Discussion
We have identified a point mutation in the mouseFtogene at a highly conserved residue within a novelC-terminal domain that is largely composed ofa-helices and is involved in FTO dimerisa-tion. Like the wild-type protein, the FTOI367Fprotein localises to
metabolism. The body weight of female mice was unaffected. Sex differences are often observed in mouse models of obesity and diabetes and are thought to be due to a protective effect of female sex hormones [31,32]. Although most human studies have not reported any gender differences, a recent study suggested that the effect of FTO on BMI in a Slavic population is restricted to males and postmenopausal females [33].
Properties of FTO
We found thatin vitrowild-type mFTO dimerises, probably via its novel helicalC-terminal domain, and that it can exist in both monomeric and dimeric forms. Substitution of isoleucine-367 for phenylalanine resulted in insoluble protein when expressed inE. coliand a substantially reduced level of expression in mammalian cells. However alanine substitution at residue 367 resulted in Figure 6.FtoI367Fincreases sympathetic activity.(A–C) Urinary catecholamines norepinephrine (A), dopamine (B) and epinephrine (C) at 10 and 20 weeks (10W; 20W) in heterozygous (I/F; grey bars) and homozgygous (F/F; white bars)FtoI367Fmice compared to wild-type controls (I/I; black bars). 10 weeks: I/I, n = 13; I/F, n = 10; F/F = 10. 20 weeks: I/I, n = 14; I/F, n = 14; F/F, n = 15. (D–F) Gene expression in skeletal muscle (D), WAT (E) and BAT (F) expressed relative to GAPDH. Abbreviations not used previously: adrenergic beta-1 receptor (Adrb1), adrenergic beta-2 receptor (Adrb2), uncoupling protein 1 (Ucp1). Data are expressed as mean6SEM. *, P,0.05 (Student’s t-test) for differences betweenFtoI367F
and wild-type mice. doi:10.1371/journal.pgen.1000599.g006
Figure 7.FtoI367Fgene expression analyses.(A) Overlap between statistically changing genes with$1.5 fold change in WAT, liver and skeletal muscle of homozygousFtoI367Fmice. (B) Hierarchical clustering of 121 differentially expressed immune genes and 22 fatty acid metabolism genes. Each row represents an individual animal and each column a single gene. Red-blue color code represents the relative intensity of the expression signal, with red indicating high expression and blue low expression. (C–E) Gene expression levels, relative to GAPDH, measured by q-RT-PCR for immune genes in WAT (C), and genes involved in fatty acid metabolism (D), or metabolism (E) in skeletal muscle. Black bars: wild-type mice (I/I; n = 10). Grey bars: heterozygous mice (I/F; n = 9). White bars: homozygous (F/F; n = 11). Abbreviations not used previously:Acsl5, acyl-CoA synthetase
long-chain family member 5;Acaa2, acetyl-Coenzyme A acyltransferase 2. Data are expressed as mean6SEM. *, P,0.05. **, P,0.01. ***, P,0.001 (Student’s t-test) for differences betweenFtoI367F
soluble protein. mFTOI367Ahas a similar secondary structure to mFTO, although the fraction of dimeric protein was significantly reduced and its catalytic activity was decreased.
Our results suggest the mFTOI367F allele may exert a heterozygous hypomorphic effect. Heterozygous Fto knockout mice resemble wild-type mice, indicating the presumed FTO reduction is not sufficient to elicit a phenotype (haploinsufficiency). However, because heterozygous and homozygous FtoI367F mice exhibited a similar phenotype, it appears that an mFTOI367F protein can exert a dominant negative effect on mFTO function, possibly by disrupting the wild-type mFTO subunit by formation of a heterodimeric protein complex (i.e. an antimorphic allele).
ER stress genes were among those genes whose expression was increased in the liver of 16-week old homozygousFtoI367Fmice. It is possible these gene changes are secondary to impaired folding of FTOI367F, as suggested by the fact that the recombinant protein aggregated in solution. However, qRT-PCR analysis did not reach statistical significance suggesting FTOI367Fmay only be initiating a mild unfolded protein response.
Mechanism of Action of FTO
Most sick animals will tend to lose weight. However, the fact that food intake and physical activity ofFtoI367Fmice are normal indicates their lean phenotype is unlikely to be a consequence of illness or general malaise. In contrast, the I367F mutation produced a marked increase in whole body metabolism, with both O2consumption and CO2production being stimulated. This
argues that the changes in fat mass are produced by differences in metabolism. Interestingly, RER increased from 0.87 to 0.9 during the dark period (when the mice are active). This is consistent with a switch from fat metabolism (RER = 0.7) towards protein (RER = 0.9) and/or carbohydrate (RER = 1.0) metabolism, which most likely reflects the fact that mutant animals have smaller fat depots.
We found some evidence for alterations in catecholamines and sympathetic nervous system activity that are consistent with an increased metabolic rate. The increased glucagon level of FtoI367F mice further supports an increased sympathetic tone (as this stimulates glucagon secretion).
On either a standard or a high-fat diet,FtoI367Fmice exhibited reduced fat mass, unchanged food intake, and increased serum leptin, glucose, glucagon and lipid serum levels compared with wild-type mice. However the lean mass of FtoI367F mice was greater than that of wild-type on a high-fat diet, whereas no differences were observed on a normal diet. Consequently, overall weight was not significantly different between FtoI367F and wild-type mice on a high fat diet. It is striking that that despite the reduction in protein and carbohydrate, the lean mass ofFtoI367F
mice increases on the high-fat diet. All mice on the high-fat diet have a higher fat mass than on a standard diet, although the
FtoI367F
mutation affords some protection against increased adiposity.
Finally, we did not observe any differences in metabolic rate between genotypes given a high-fat diet, suggesting that the increased fat metabolism (particularly in wild-type mice) masks the differences observed on a standard diet. The RERs on the high-fat diet were all reduced, as expected due to the relatively higher fat metabolism. However, the active (night) phase RER was significantly higher inFtoI367Fthan wild-type mice fed a high-fat (or standard) diet, indicating a switch in substrate use towards carbohydrate.
How the FtoI367F mutation enhances metabolism requires further study. Nevertheless, it is interesting that other Fe(II) and 2OG oxygenases are involved in fat metabolism [34]. Given that
the amount of adipose tissue is significantly reduced in FtoI367F
mice, the increased expression of genes involved in lipid metabolism pathways can be interpreted to suggest that fatty acid catabolism dominates in WAT and is the primary cause of reduced WAT levels, and that changes in levels of anabolic genes are a secondary effect. Overall, enhanced fat metabolism in WAT may not contribute to RER as much as in wildtype animals because of the reduced fat mass inFtoI367Fmice.
Gene expression analysis showed a slight increase in carbohy-drate metabolic genes in muscle of FtoI367F mice. This might contribute to the phenotype of these mice as they exhibit a higher metabolic rate and higher RER. It is also possible that these changes are secondary to changes in substrate supply to muscle, produced by changes in nutrient storage in WAT and liver. The elevation of fatty acid synthase (Fasn) levels suggests that fat synthesis could be enhanced in muscle. However, there was no obvious increase in fat storage in this tissue so this change may be a secondary consequence of a decreased supply of fatty acids to muscle resulting from the lean phenotype.
A reduction in expression of genes involved in the inflammatory response is consistent with the lean phenotype of theFtoI367Fmice and may reflect concomitant reduction of macrophages residing in WAT. Previous reports have shown inflammation has an important role in obesity and that a lean phenotype results in decreased expression of inflammatory markers [27,28,29].
We found a significant reduction inNpy expression inFtoI367F
mice in the free-fed state (compared to controls). However, we did not observe any significant effect on food intake. Knockout of FTO had no effect on fed levels ofNpyexpression but produced a small reduction in fastingNpyandPomclevels [24].
Does Loss or Gain of FTO Function Cause Obesity? Our data suggest that the I367F mutation leads to a reduction in FTO activity. The mutant protein is expressed at lower levels than wild-type inE. coli, mammalian cell lines, and in tissues isolated from mutant mice. This reduction in FTO protein levels is expected to result in a decrease in total FTO activity. Furthermore, although the activity of mFTOI367F could not be measured that of mFTO1367Awas reduced.
The FtoI367F mouse shares several features with a mouse in which the Fto gene has been knocked out [24], which provides additional support for the idea that theFtoI367Fmutation causes a (partial) loss of function. Thus, in the homozygous state, both types of mice weigh less than wild-type, have a reduced fat mass, exhibit an increased metabolic rate and increased sympathetic nervous system activity and have a stronger phenotype in male than female mice.
Collectively, these data suggest that FTO is involved in fat accumulation and that reduction in the activity of its gene product accounts for the lean phenotype of our mutant mice.
Differences betweenFtoI367FandFtoKnockout Mice
There are, however, significant differences between FtoI367F
mice and theFtoknockout mouse [24]. This is presumably because the latter results in a null allele, whereas the mFTOI367Fprotein may retain some functional activity, as suggested by the lowered activity of mFTOI367A.
TheFtoknockout mouse exhibits no significant phenotype in the heterozygous state [24], whereas heterozygous FtoI367F mice resemble their homozygous littermates. As described above, this most probably results from a dominant negative effect of the I367F mutation. Thus, inhibition of FTO dimerisation may represent a novel strategy for inhibition of FTO activity. We confine our discussion here to a comparison of homozygous animals.
The divergence of weight between knockout and wild-type mice has an early onset being apparent from day 2 after birth, and by 6 weeks of age homozygous mice weigh 30–40% less than controls. In contrast, the weight of homozygousFtoI367Fmice only diverges after 12 weeks and at its maximum (24 weeks) is only 10% less than wild-type. This smaller weight difference is closer to that observed in humans carrying different FTO SNPs, where the mean difference between at-risk and low-risk alleles is 3 kg for an average adult body weight of 90 kg - or around 3.4% [1].
Ftoknockout mice are smaller than wild-type (on average, males are 1.5 cm shorter) [24]. In contrast, FtoI367F mice showed no difference in body length, which is consistent with the lack of association of humanFTOSNPs with height [1,21].
Fat mass was reduced by 60% and 23% in homozygous male and femaleFto knockout mice, respectively. In contrast, we only observed a phenotype in males and the reduction in fat mass was much less, between 16–18%. This is closer to the difference in body fat of 14% found between humans with at-risk and low-risk
FTOvariants [1].
There are several other differences between FtoI367F and Fto
knockout mice. In particular, the latter showed a postnatal increase in mortality suggesting they are less healthy. They also exhibited relative hyperphagia and decreased spontaneous loco-motor activity, which we did not detect inFtoI367Fmice.
These data reveal that the phenotype of FtoI367F mice more closely resembles that of humanFTOvariants than the knockout mice, and suggests that the low-risk allele does not result in a total knockout of FTO function in humans. The FtoI367F mouse provides a more physiologically relevant model for studying the effects of human FTO variants than a complete gene knockout, where the phenotype is more extreme.
Relation to Human FTO
Human studies suggest thatFTOSNPs are not associated with differences in physical activity, as found for FtoI367F mice [20]. There is strong evidence for increased food intake in humans with the ‘at-risk allele’. This was not observed inFtoI367Fmice although homozygotes showed a trend to towards reduced food intake on both standard and high-fat diets. Unlike humans withFTOgene variants, we observed no differences in homozygous and heterozygous mice. However, this is not unexpected as we have shown that our mutation affects FTO dimerisation, which may lead to dominant negative effects: it is unlikely this occurs with an intronic SNP, which presumably exerts a gene dosage effect on protein levels.
Conclusions
Our data provide functional evidence thatFTOis a causal gene underlying the association of SNPs within intron 1 ofFTOwith obesity. They further suggest that the ‘at-risk’ allele may lead to enhanced FTO function - or conversely that the low risk allele may lead to reduced FTO function.
The FtoI367F model shows that mutations in this gene are consistent with viable metabolic effects and provides a physiolog-ically more relevant model for further study than does the knockout mutation where the phenotype is more extreme.
Our results cannot exclude the possibility that the intronic SNP found in humans may have an additional regulatory role on other genes. Nevertheless, because a missense point mutation is unlikely to affect the expression of adjacent genes, the phenotype of our mice provides strong support for the idea that FTO function does regulate body weight and further reinforces the evidence from the mouse knockout. By showing that FTO affects whole body metabolism, they provide the basis for further studies designed to
elucidate the molecular mechanism of how FTO influences body weight. The observation that impaired FTO function results in a lean phenotype also suggests that inhibition of FTO may be of therapeutic interest in relation to morbid obesity.
Materials and Methods
ENU Mutation in Exon 6
The Harwell ENU-DNA archive (http://www.har.mrc.ac.uk/ services/dna_archive/) was screened by denaturing high perfor-mance liquid chromatography (dHPLC) using a Transgenomic WAVE system [25,35]. Coding sequence from the 9Fto exons, including flanking (approximately 70 bp) splice sites, was tested in DNA derived from 6,624 mutagenised animals giving a total of approximately 10.29 Mbp screened (see Text S1 for primer sequences). Six ENU induced point mutations (2 missense, 3 intronic (non-splice site), 1 silent) were found. We selected an exon 6 missense mutation (I367F) for further work. Fto exon 6 was amplified with the following primers: FTOex6F 59
ATGTA-CAGCTGGAAGAGTGC-39 and FTOex6R 59
-TCCCCTCTGACTAGGATCTC-39 using Ampli Taq Gold (Applied Biosystems). The mouse (C57BL/6J6C3H/HeH F1) was rederived by in vitro fertilization from frozen sperm using C3H/HeH eggs. Progeny were backcrossed for two generations to C3H/HeH and intercrossed to produce mice heterozygous and homozygous for the mutation.
Sequence Analysis
PCR amplification products were purified using a QIAquick PCR purification kit (Qiagen). Sequencing reactions were performed by GATC Biotech (Jakob-Stadler-Platz 778467 Kon-stanz, Germany) and analyzed using Vector NTI advance 10-ContigExpress (Invitrogen).
Sequence Alignment
FTO genomic, transcript and peptide sequences were exported from Ensembl (http://www.ensembl.org/index.html). Sequence alignment was performed using NTI advance 10-AlignX software (Invitrogen).
Mutant Construct Production
cDNA encoding hFTO was synthesised by Geneart and cloned into the pET-28a(+) vector to generate a His-tagged fusion protein. The hFTO construct used was produced by deletion of the thrombin cleavage region separating the His-tag from the protein sequence, using the QuikChange Site-Directed Mutagen-esis Kit (Stratagene), and confirmed by DNA sequencing. This construct was used to prepare the hFTO 332–505 truncation (ChFTO). The mFTO 329–502 truncation (CmFTO),C-terminal truncations mFTO 1–408, mFTO 1–387 and mFTO 1–329, and point mutant I367F mFTO and I367A mFTO constructs were prepared in a similar manner from the wild-type mFTO construct. Further details are provided in the Text S1.
Protein Expression and Purification
Proteins were prepared as previously reported for full length mFTO [8].
Analytical Gel Filtration Analyses
buffer, containing 50 mM NaCl, 1 mM DTT, 50 mM Tris pH 7.5. The UV trace of the eluted volume was monitored. Protein standards used to create calibration curves were analysed by the same method. For CmFTO the masses obtained were 23.2 kDa and 38.2 kDa, consistent with the presence of monomeric and dimeric species (calculated masses of 21.6 and 43 kDa, respectively). CmFTOI367A elutes at a volume corre-sponding to 27.8 kDa.
Circular Dichroism Analyses
Protein (0.25 mg/ml) samples were analysed in 50 mM KCl, 20 mM K2PO4, pH 7.0, on an Applied Photophysics Chirascan
machine, with 1 mm pathlength quartz cuvettes. Measurements were taken at 0.5 nm intervals between 180 and 260 nm at 4uC. Spectral fitting to determine relative contributions of secondary structure elements was performed using a CDNN deconvolution program (Chirascan).
Non–Denaturing Mass Spectrometric Analyses
Protein samples were exchanged into 15 mM ammonium acetate, pH 7.5. ESI-MS was carried out on a Waters Micromass Q-ToF spectrometer and an Advion Biosciences NanoMate HD Robot chip-based nano-electrospray device. 10mM protein samples were sprayed from 15 mM NH4OAc (pH 7.5) at a chip
nozzle voltage of 1.66 kV and cone voltage of 80 V. Samples were also run on a Waters Synapt HDMS, Advion Biosciences NanoMate HD Robot chip-based nano-electrospray device. 15mM protein samples were sprayed from 15 mM NH4OAc
(pH 7.5) at a chip nozzle voltage of 1.7–1.8 kV, a gas pressure of 0.25 psi and cone voltage of 80 V.
2OG Decarboxylation Assays
Decarboxylation assays of [1-14C]-labelled 2OG were carried out as reported [36], and incubated (37uC for 10 minutes). Assays were carried out with an 18mer methylated oligonucleotide substrate of sequence 59-GCXAGGTCCCGTAGTGCG-39, where X is 3-methylthymine, which was synthesised by ATDBio Ltd. (University of Southampton, UK). Assay mixes contained 4mM enzyme, 100mM substrate, 4 mM ascorbic acid, 300mM 2OG (4% [1-14C]-2OG), 0.3 mg/ml catalase, 1 mM DTT and 25mM FeSO4.7H2O, made to 100ml with 50 mM Tris pH 7.5.
Constructs for Fluorescent FTO Fusion Proteins
An N-Terminally labelled YFP-Fto fusion construct was generated as described [8]. The I367F variant was created from the wild-type construct using the QuikChange Site-Directed Mutagenesis Kit (Stratagene) and confirmed by DNA sequencing. The primers used were (bold codons indicate the site of mutation): mFTOI367F fwd: 59- AAA CAA GGA GAG GAA TTC CAT AAT GAG GTG GAG -39mFTOI367F rev: 59- CTC CAC CTC ATT ATG GAA TTC CTC TCC TTG TTT-39. Cell culture and confocal microscopy are described in Text S1.
The HA-Fto chimera was generated by fusing an HA coding sequence to theN-terminus of FTO by PCR. The amplified PCR product was cloned into the pGEM-T Easy vector (Promega), sequenced, and then recloned into the pcDNA3 vector (Invitro-gen). The I367F variant was created from the wildtype construct using the QuikChange Site-Directed Mutagenesis Kit (Stratagene).
Protein Extraction and Immunoblotting
Western blots were performed on 40mg of total proteins using a rabbit anti recombinant mFTO antibody. Detection was per-formed using ultrasensitive horseradish Enhanced
Chemilumines-cence Plus (ECL plus; Amersham). Cos-7 cells expressing HA-FTO or HA-HA-FTOI367F, were lysed with RIPA buffer (containing 1% NP40, 0.5% DOC and 0.1% SDA detergents) and proteins separated by SDS-PAGE. Blots were probed with an anti-HA antibody (Roche) and with an antibody to the TATA-binding protein (Abcam) as a loading control for nuclear proteins.
Animal Experiments
All animal studies were carried out using guidelines issued by the Medical Research Council in ’Responsibility in the Use of Animals for Medical Research’ (July 1993). Mice were kept in accordance with UK Home Office welfare guidelines and project license restrictions under controlled light (12 hr light and 12 hr dark cycle, dark 7 pm-7 am), temperature (2162uC) and humidity (55%610%) conditions. They had free access to water (25 ppm chlorine) and were fedad libitumon a commercial diet (SDS Rat and Mouse No.3 Breeding diet (RM3)) containing 11.5 kcal% fat, 23.93 kcal% protein and 61.57 kcal% carbohydrate. Alternatively, mice were maintained on a high-fat diet (D12451, Research Diets, New Brunswick, NJ, USA) containing 45 kcal% fat, 20 kcal% protein and 35 kcal% carbohydrate. Phenotyping tests were performed according to EMPReSS (European Phenotyping Resource for Standardised Screens from EUMORPHIA) stan-dardized protocols as described at (http://empress.har.mrc.ac.uk).
Body Mass and Composition
Body mass was measured each week on scales calibrated to 0.01 g. Analysis of body composition was performed by DEXA using the Lunar PIXImus Mouse Densitometer (Wipro GE Healthcare, Madison, WI).
Measurement of Food Consumption, Blood, Serum, and Urinary Parameters
At 10 and 20 weeks of age mice were placed in metabolic Techniplast cages with free access to water and food. Food consumption was measured by weighing. Urine was collected after 24 hours and urinary catecholamines measured using a 3-CAT Epinephrine, Norepinephrine, Dopamine ELISA (Demeditec) according to the manufacturer’s instructions. Creatinine was used to standardize between urine samples. Plasma leptin insulin, adiponectin and glucagon levels were measured using a mouse endocrine Lincoplex kit (Linco research, Missouri, USA) and a Bio-Plex 200 system (Bio-Rad, Hemel Hempstead, UK), according to the manufacturer’s instructions. At 24 weeks of age, fasted mice were anaesthetized, killed by exsanguination and blood collected by cardiac puncture. Plasma concentrations of glucose, triglycer-ides, total cholesterol, HDL cholesterol and LDL cholesterol and urine creatinine were measured on an AU400 (Olympus UK), as described [37].
Metabolic Rate and Activity Measurements
Metabolic rate was measured at 18 weeks of age using indirect calorimetry (Oxymax; Columbus Instruments) to determine oxygen consumption, carbon dioxide production, respiratory exchange ratio (RER) and heat production. Physical activity was assessed using a Threshold load cell system (Med Associates, VT, USA) over 22 hours and analysed with Threshold Summary, Version 3.0 for upper and lower threshold crossings.
Gene Expression Profiling
and Ingenuity pathway analysis tools. All data is MIAME compliant and has been submitted to ArrayExpress under accession number E-MEXP-2201. Further details of the micro-array methodology and SYBR-Green/Taqman (Table S5) PCR assays are described in the Text S1.
Statistics
Statistical analyses were performed with a Student’s t-test for independent samples. Correlation coefficients were obtained by the Pearson method using GraphPad Prism version 5.00 for Windows, GraphPad Software, San Diego California USA, www. graphpad.com. Data are expressed as mean6SEM, and P,0.05 was considered as statistically significant. For microarray studies, differentially expressed genes were identified (after RMA normal-ization) using an unpaired t-test with a cut-off of P#0.05. A$ 1.5-fold change difference between wildtype and FtoI367F mice was taken to indicate expression changes between genotypes.
Additional detail on materials and methods is given in Text S1.
Supporting Information
Figure S1 Non-denaturing mass spectrometric analysis of CmFTO. Peak A corresponds to the predicted mass of the C -terminal domain of mFTO, CmFTO (21522 Da). Peak B likely results from a-N-gluconylation of the N-terminal His-tag of CmFTO, creating a+178 Da adduct (see Figure S2).
Found at: doi:10.1371/journal.pgen.1000599.s001 (0.58 MB TIF)
Figure S2 Scheme showing the likely modification of the N -terminal His-tag of the CmFTO protein bya-N-gluconylation of anN-terminal amino group, creating a+178 Da adduct [3]. Found at: doi:10.1371/journal.pgen.1000599.s002 (0.46 MB TIF)
Figure S3 Non-denaturing electrospray ionisation mass spec-trometry analyses carried out on a Waters SynaptTMHDMSTM, showing the oligomeric composition of (i) I367A mFTO, (ii) mFTO and (iii) hFTO.
Found at: doi:10.1371/journal.pgen.1000599.s003 (0.60 MB TIF)
Figure S4 Secondary structure predictions showing relative proportions of secondary structure elements present in CmFTO (left) and mFTO (right), obtained through spectral fitting of circular dichroism spectra (Figure 2D) using the program CDNN (Chirascan). A greater proportion ofa-helix is identified in the C-terminus of mFTO (CmFTO) than for the full length mFTO. Proportions obtained for the analogous proteins for the I367A variants are very similar (data not shown).
Found at: doi:10.1371/journal.pgen.1000599.s004 (0.31 MB TIF)
Figure S5 Difference circular dichroism spectra, identifying the increased proportion ofa-helical content in theC-terminal domain relative to the wild-type FTO proteins, and indicating overall structural similarity between the wild type and I367A variants: mFTO-CmFTO (blue), I367A mFTO-I367A CmFTO (red), hFTO-ChFTO (light blue), mFTO-I367A mFTO (green), CmFTO-I367A CmFTO (black).
Found at: doi:10.1371/journal.pgen.1000599.s005 (0.39 MB TIF)
Figure S6 Circular dichroism spectra showing the secondary structures of hFTO (red), and ChFTO (blue) at 0.25mM, 4uC. Found at: doi:10.1371/journal.pgen.1000599.s006 (0.33 MB TIF)
Figure S7 (A,B) Intraperitoneal glucose tolerance test (A) at 12 weeks following overnight fasting (B) at 16 weeks following overnight fasting. Heterozgyous (I/F, n = 23), homozygous (F/F, n = 18) and wildtype littermate (I/I, n = 22). (C) Circulating overnight fast plasma leptin level at 24 weeks. Heterozgyous (I/F,
n = 26), homozygous (F/F, n = 19) and wildtype littermate (I/I, n = 28). (D) Circulating overnight fast plasma leptin level expressed as a function of percentage of body fat at 24 weeks. Heterozgyous (I/F, n = 25), homozygous (F/F, n = 19) and wildtype littermate (I/ I, n = 18). (E) Circulating overnight fast plasma insulin level at 24 weeks. Heterozgyous (I/F, n = 26), homozygous (F/F, n = 19) and wildtype littermate (I/I, n = 28). (F) Circulating overnight fast plasma adiponectin level at 24 weeks Heterozgyous (I/F, n = 26), homozygous (F/F, n = 10) and wildtype littermate (I/I, n = 14). (G) Liver triglyceride concentration at 24 weeks. Heterozgyous (I/F, n = 8), homozygous (F/F, n = 7) and wildtype littermate (I/I, n = 8). Data are expressed as mean6SEM, Statistical analysis was carried out using the Student’s t-test for differences between
FtoI367F heterozygous or homozygous mice and wild-type litter-mates.
Found at: doi:10.1371/journal.pgen.1000599.s007 (0.80 MB TIF)
Figure S8 A-C Body Mass (A) fat mass (B) and lean body mass (C) of 24-week old male heterozygous (n = 20), homozygous (n = 15) and wildtype (n = 9) on high fat diet. (D) Food Intake over 24 hours (10 wk I/I n = 14, I/F n = 22, F/F n = 9, 20 wk I/I n = 12, I/F n = 22, F/F n = 9) on high fat diet. E-G Circulating overnight fasting plasma insulin (E), leptin (F) and glucagon (G) level at 8 and 24 weeks. Heterozgyous (I/F, n = 20), homozygous (F/F, n = 9) and wildtype littermate (I/I, n = 12). (H) Glucose and lipid serum levels were measured after overnight fasting at 24-weeks of age. WT (I/I; n = 11), Heterozygous (I/F; n = 18), Homozygous (F/F; n = 9). I-K Oxygen Consumption (I) and carbon dioxide production (J) and calculated respiratory exchange ratio (RER; K) during the light and dark period for 18-week old males on standard diet (heterozygous (I/F; n = 30) and homozy-gous (F/F; n = 15) and FtoI367F mice wild-type littermates (I/I; n = 26) and high fat diet (heterozygous (I/F; n = 23) and homozygous (F/F; n = 9)FtoI367Fmice wild-type littermates (I/I; n = 12). L-M Oxygen Consumption (L) and carbon dioxide production (M) over a 22-hr period for 18- week old male heterozygous (I/F; n = 23) and homozygous (F/F; n = 9)FtoI367F
mice and wild-type littermates (I/I; n = 12) on high fat diet. Data are expressed as mean6SEM, Statistical analysis was carried out using the Student’s t-test (* P,0.05, **P,0.01, *** P,0.001) for differences between FtoI367F heterozygous or homozygous mice and wild-type littermates.
Found at: doi:10.1371/journal.pgen.1000599.s008 (0.11 MB PDF)
Figure S9 Endoplasmic Reticulum Stress pathway in homozy-gousFtoI367Fmice liver microarray. Upregulated genes are marked in red and genes showing no change in expression are shown in grey (Downloaded from Ingenuity).
Found at: doi:10.1371/journal.pgen.1000599.s009 (3.25 MB TIF)
Figure S10 Gene expression in hypothalamus of Agrp, Npy, and Pomc in FtoI367F expressed relative to GAPDH. Free fed heterozgyous (I/F, n = 6), homozygous (F/F, n = 7) and wildtype littermates (I/I, n = 7). Fasted heterozgyous (I/F, n = 8), homozy-gous (F/F, n = 8) and wildtype littermate (I/I, n = 8). Data are expressed as mean6SEM, Statistical analysis was carried out using the Student’s t-test for differences betweenFtoI367Fheterozygous or homozygous mice and wild-type littermates. *, P,0.05.
Found at: doi:10.1371/journal.pgen.1000599.s010 (0.57 MB TIF)
Table S1 Metabolic parameters in femaleFtoI367Fmice. Values are mean6SEM. Numbers shown in brackets represent n number for each parameter. No statistically significant differences were observed between female wildtype littermates (I/I) and heterozy-gous (I/F) mice and homozyheterozy-gous (F/F)FtoI367Fmice.
Table S2 Immune genes statistically altered$1.5 fold in 16 week
FtoI367Fwhite adipose tissue.
Found at: doi:10.1371/journal.pgen.1000599.s012 (0.07 MB PDF)
Table S3 Fatty acid metabolism genes statistically altered$1.5 fold in 16 weekFtoI367Fwhite adipose tissue.
Found at: doi:10.1371/journal.pgen.1000599.s013 (0.02 MB PDF)
Table S4 Metabolism genes statistically altered$1.5 fold in 16 weekFtoI367Fliver.
Found at: doi:10.1371/journal.pgen.1000599.s014 (0.01 MB PDF)
Table S5 Taqman Gene Expression Assay, probe Assay ID for qRT-PCR.
Found at: doi:10.1371/journal.pgen.1000599.s015 (0.01 MB PDF)
Text S1 Supplemental data.
Found at: doi:10.1371/journal.pgen.1000599.s016 (0.06 MB DOC)
Acknowledgments
We thank Juris Galvanovskis and Stuart Townsend for help with confocal microscopy and Christophe Girard for his assistance. We thank the staff of the Mary Lyon Centre and the MRC Harwell Clinical Chemistry, FESA, and GEMS cores for their excellent technical support.
Author Contributions
Conceived and designed the experiments: CC CJS FMA RDC. Performed the experiments: CC SL EALB JSM RD TG AL LM JM MMQ. Analyzed the data: CC SL EALB JSM RD TG AL JM MMQ CJS FMA RDC. Wrote the paper: CC EALB CJS FMA RDC.
References
1. Frayling TM, Timpson NJ, Weedon MN, Zeggini E, Freathy RM, et al. (2007) A common variant in the FTO gene is associated with body mass index and predisposes to childhood and adult obesity. Science 316: 889–894.
2. Dina C, Meyre D, Gallina S, Durand E, Korner A, et al. (2007) Variation in FTO contributes to childhood obesity and severe adult obesity. Nat Genet 39: 724–726.
3. Chang YC, Liu PH, Lee WJ, Chang TJ, Jiang YD, et al. (2008) Common Variation in the FTO Gene Confers Risk of Obesity and Modulates Body Mass Index in the Chinese Population. Diabetes 57: 2245–2252.
4. Hinney A, Nguyen TT, Scherag A, Friedel S, Bronner G, et al. (2007) Genome Wide Association (GWA) Study for Early Onset Extreme Obesity Supports the Role of Fat Mass and Obesity Associated Gene (FTO) Variants. PLoS ONE 2: e1361. doi:10.1371/journal.pone.0001361.
5. Ohashi J, Naka I, Kimura R, Natsuhara K, Yamauchi T, et al. (2007) FTO polymorphisms in oceanic populations. J Hum Genet 52: 1031–1035. 6. Peeters A, Beckers S, Verrijken A, Roevens P, Peeters P, et al. (2008) Variants in
the FTO gene are associated with common obesity in the Belgian population. Mol Genet Metab 93: 481–484.
7. Scuteri A, Sanna S, Chen WM, Uda M, Albai G, et al. (2007) Genome-Wide Association Scan Shows Genetic Variants in the FTO Gene Are Associated with Obesity-Related Traits. PLoS Genet 3: e115. doi:10.1371/journal. pgen.0030115.
8. Gerken T, Girard CA, Tung YC, Webby CJ, Saudek V, et al. (2007) The obesity-associated FTO gene encodes a 2-oxoglutarate-dependent nucleic acid demethylase. Science 318: 1469–1472.
9. Clifton IJ, McDonough MA, Ehrismann D, Kershaw NJ, Granatino N, et al. (2006) Structural studies on 2-oxoglutarate oxygenases and related double-stranded beta-helix fold proteins. J Inorg Biochem 100: 644–669.
10. Jia G, Yang CG, Yang S, Jian X, Yi C, et al. (2008) Oxidative demethylation of 3-methylthymine and 3-methyluracil in single-stranded DNA and RNA by mouse and human FTO. FEBS Lett 582: 3313–3319.
11. Lein ES, Hawrylycz MJ, Ao N, Ayres M, Bensinger A, et al. (2007) Genome-wide atlas of gene expression in the adult mouse brain. Nature 445: 168–176. 12. Morton GJ, Cummings DE, Baskin DG, Barsh GS, Schwartz MW (2006)
Central nervous system control of food intake and body weight. Nature 443: 289–295.
13. Wardle J, Llewellyn C, Sanderson S, Plomin R (2008) The FTO gene and measured food intake in children. Int J Obes (Lond) 33: 42–45.
14. Wardle J, Carnell S, Haworth CM, Farooqi IS, O’Rahilly S, et al. (2008) Obesity-associated genetic variation in FTO is associated with diminished satiety. J Clin Endocrinol Metab 93: 3640–3643.
15. Timpson NJ, Emmett PM, Frayling TM, Rogers I, Hattersley AT, et al. (2008) The fat mass- and obesity-associated locus and dietary intake in children. Am J Clin Nutr 88: 971–978.
16. Speakman JR, Rance KA, Johnstone AM (2008) Polymorphisms of the FTO gene are associated with variation in energy intake, but not energy expenditure. Obesity (Silver Spring) 16: 1961–1965.
17. Wardle J, Llewellyn C, Sanderson S, Plomin R (2009) The FTO gene and measured food intake in children. Int J Obes (Lond) 33: 42–45.
18. Haupt A, Thamer C, Staiger H, Tschritter O, Kirchhoff K, et al. (2009) Variation in the FTO gene influences food intake but not energy expenditure. Exp Clin Endocrinol Diabetes 117: 194–197.
19. Cecil JE, Tavendale R, Watt P, Hetherington MM, Palmer CN (2008) An obesity-associated FTO gene variant and increased energy intake in children. N Engl J Med 359: 2558–2566.
20. Berentzen T, Kring SI, Holst C, Zimmermann E, Jess T, et al. (2008) Lack of association of fatness-related FTO gene variants with energy expenditure or physical activity. J Clin Endocrinol Metab 93: 2904–2908.
21. Hakanen M, Raitakari OT, Lehtimaki T, Peltonen N, Pahkala K, et al. (2009) FTO Genotype Is Associated with Body Mass Index after the Age of 7 Years but Not with Energy Intake or Leisure-time Physical Activity. J Clin Endocrinol Metab 94(4): 1281–7.
22. Peters T, Ausmeier K, Ruther U (1999) Cloning of Fatso (Fto), a novel gene deleted by the Fused toes (Ft) mouse mutation. Mamm Genome 10: 983–986. 23. van der Hoeven F, Schimmang T, Volkmann A, Mattei MG, Kyewski B, et al.
(1994) Programmed cell death is affected in the novel mouse mutant Fused toes (Ft). Development 120: 2601–2607.
24. Fischer J, Koch L, Emmerling C, Vierkotten J, Peters T, et al. (2009) Inactivation of the Fto gene protects from obesity. Nature;doi: 10.1038/ nature07848.
25. Quwailid MM, Hugill A, Dear N, Vizor L, Wells S, et al. (2004) A gene-driven ENU-based approach to generating an allelic series in any gene. Mamm Genome 15: 585–591.
26. Lancaster DE, McNeill LA, McDonough MA, Aplin RT, Hewitson KS, et al. (2004) Disruption of dimerization and substrate phosphorylation inhibit factor inhibiting hypoxia-inducible factor (FIH) activity. Biochem J 383: 429–437. 27. Cancello R, Henegar C, Viguerie N, Taleb S, Poitou C, et al. (2005) Reduction
of macrophage infiltration and chemoattractant gene expression changes in white adipose tissue of morbidly obese subjects after surgery-induced weight loss. Diabetes 54: 2277–2286.
28. Clement K, Viguerie N, Poitou C, Carette C, Pelloux V, et al. (2004) Weight loss regulates inflammation-related genes in white adipose tissue of obese subjects. Faseb J 18: 1657–1669.
29. Lumeng CN, Deyoung SM, Bodzin JL, Saltiel AR (2007) Increased inflammatory properties of adipose tissue macrophages recruited during diet-induced obesity. Diabetes 56: 16–23.
30. Romeo S, Kozlitina J, Xing C, Pertsemlidis A, Cox D, et al. (2008) Genetic variation in PNPLA3 confers susceptibility to nonalcoholic fatty liver disease. Nat Genet 40: 1461–1465.
31. Gui Y, Silha JV, Murphy LJ (2004) Sexual dimorphism and regulation of resistin, adiponectin, and leptin expression in the mouse. Obes Res 12: 1481–1491.
32. Wang S, Yehya N, Schadt EE, Wang H, Drake TA, et al. (2006) Genetic and genomic analysis of a fat mass trait with complex inheritance reveals marked sex specificity. PLoS Genet 2: e15. doi:10.1371/journal.pgen.0020015.
33. Hubacek JA, Pitha J, Adamkova V, Lanska V, Poledne R (2009) A common variant in the FTO gene is associated with body mass index in males and postmenopausal females but not in premenopausal females. Czech post-MONICA and 3PMFs studies. Clin Chem Lab Med 47: 387–390.
34. Vaz FM, Wanders RJ (2002) Carnitine biosynthesis in mammals. Biochem J 361: 417–429.
35. Shimomura K, Galvanovskis J, Goldsworthy M, Hugill A, Kaizak S, et al. (2009) Insulin secretion from beta-cells is affected by deletion of nicotinamide nucleotide transhydrogenase. Methods Enzymol 457: 451–480.
36. Rhoads RE, Udenfriend S (1968) Decarboxylation of alpha-ketoglutarate coupled to collagen proline hydroxylase. Proc Natl Acad Sci U S A 60: 1473–1478.
37. Hough TA, Nolan PM, Tsipouri V, Toye AA, Gray IC, et al. (2002) Novel phenotypes identified by plasma biochemical screening in the mouse. Mamm Genome 13: 595–602.