Cop
yright
© ABE&M t
odos os dir
eit
os r
eser
vados
.
1 Faculdade de Nutrição, Universidade Federal de Mato Grosso (UFMT), Cuiabá, MT, Brasil 2 Departamento de Fisiologia da Nutrição, Universidade Federal de São Paulo (Unifesp), São Paulo, SP, Brasil
Correspondence to: Maria Salete F. Martins Departamento de Alimentos e Nutrição, Faculdade de Nutrição, UFMT
Av. Fernando Correa da Costa, s/n 78060-900 − Cuiabá, MT, Brasil [email protected]
Received on Aug/4/2009 Accepted on Jan/30/2010
Nutritional recovery with rice bran
did not modify energy balance
and leptin and insulin levels
Recuperação nutricional com farelo de arroz não modiicou o balanço energético e os níveis de leptina e insulina
Maria Salete F. Martins1, Lila M. Oyama2, Marcia Q. Latorraca1, Maria Helena G. Gomes-da-Silva1, Claudia M. O. Nascimento2
ABSTRACT
Objective: To investigate the effect of nutritional recovery with rice bran on energy balance, leptin and insulin levels. Methods: Weaned Wistar rats were fed on a 17% (Control − C) or 0.5% (Aproteic − A) protein diet for 12d. After this, rats were kept on a C diet (C) or recovered with control (Recovered Control − RC) or control plus recovered rice bran diet (Recovered Rice Bran − RRB). Results: Despite the increased food intake, group A exhibited lower carcass fat associated to low serum leptin. RRB and RC groups showed lower carcass weight and energy intake and expenditure. Energy expenditure was positively associated with food intake and carcass wei-ght. Negative correlations between HOMA-IR and energy expenditure and energy intake were observed. Conclusion: Nutritional recovery with rice bran did not modify energy balance, leptin and insulin levels. Arq Bras Endocrinol Metab. 2010;54(3):289-94
Keywords
Energy balance; leptin; insulin; rice bran; nutritional recovery
RESUMO
Objetivo: Investigar o efeito da recuperação nutricional com farelo de arroz sobre o balanço energético e níveis de leptina e insulina. Métodos: Ratos Wistar recém-desmamados foram alimentados com 17% (Controle − C) ou 0,5% (Aproteico − A) de proteína (caseína) durante 12 dias. Em seguida, ratos permaneceram com dieta controle (C) ou foram recuperados com con-trole (Recuperados Concon-trole − RC) ou concon-trole mais 5% de farelo de arroz (Recuperados com Farelo de Arroz − RFA) durante 21 dias. Resultados: Apesar de a ingestão alimentar ter sido maior em A, a gordura na carcaça foi reduzida, sendo associada com menor nível de leptina. Os grupos RFA e RC tiveram redução no peso da carcaça, no gasto e ingestão de energia. O gasto energético foi correlacionado com a ingestão de alimentos e o peso da carcaça fresco. Foi ob-servada correlação negativa entre HOMA-IR com gasto energético e com ingestão de energia. Conclusão: A recuperação nutricional com farelo de arroz não modiicou o balanço energético, nem os níveis de leptina e insulina. Arq Bras Endocrinol Metab. 2010;54(3):289-94
Descritores
Balanço energético; leptina; insulina; farelo de arroz; recuperação nutricional
INTRODUCTION
T
he prevalence of obesity has increased dramatically over the past few decades and diet composition is one of the factors that can inluence its development (1). High-fat, high-sucrose and varied “cafeteria” diets may induce obesity (2,3). Moreover, it has been sug-gested that rats fed low-protein diets that showedCop
yright
© ABE&M t
odos os dir
eit
os r
eser
vados
.
In Brazil the use of some non-conventional foods called “multi-mixture” is disseminated to recover mal-nourished children, and rice bran is one of their constit-uents. Rice bran contains high levels of protein, mineral (6) and lipids, consequently high energy content. Stud-ies have shown that the aminoacid composition of rice bran is the best among cereals. Moreover, this cereal is an important source of dietary iber (7,8).
Dietary iber has been proven to be an eficient tac-tic to prevent obesity, because it reduces energy intake by inducing satiation and satiety (9,10) and decreases the energy density by lowering digestibility (11). The addition of ibers that form viscous colloidal dispersions when hydrated affects multiple aspects of gastrointes-tinal functions, such as gastric emptying, small bowel transit time, and the digestion and absorption of nutri-ents, particularly fat and carbohydrate (12,13).
Due to its elevated nutritional value and signiicant iber content, that exert a beneicial role in the preven-tion of obesity, rice bran could be an excellent alterna-tive feed in the recovery of the nutritional status in an animal model with tendency to body fat accumulation. Thus, irstly we examined whether severe protein mal-nutrition during the growth phase after weaning is a risk factor for the development of obesity. Secondly we examined, if nutritional recovery with rice bran changes body composition, energy balance and leptin and in-sulin levels. Finally, because inin-sulin and leptin regulate food intake and energy expenditure we veriied the rela-tionship of these hormones and the homeostasis model assessment – insulin resistance (HOMA-IR) index with these components of energy balance.
MATERIALS AND METHODS
Animals and diets
All animal experiments were approved by the Federal University of São Paulo Ethics Committee (São Paulo, Brazil) (Proc. Nº 0305). Twenty nine weaned male Wistar rats (21 days old and weighing 40-50 g) were obtained from the University’s own breeding colony, randomly separated in individual cages and kept under standard lighting conditions (12-h light/dark cycle) at a temperature of 24 ± 1ºC. Throughout the experimen-tal periodrats were given free access to food and water. During the irst stage of experimentation (12 days), rats (n = 6) received a control diet containing 17% protein (Control − C group) or a 0.5% protein diet (Aproteic
− A group). In the second stage, group A was random-ized to recover during 21 days with either the control diet (Recovered Control − RC group, n = 5) or control diet plus 5% of rice bran (Recovered Rice Bran − RRB group, n = 6), and the control group was maintained in the control diet (C group, n = 6) (14). Rice bran contained 2.3% water, 16.85% protein, 9.46% lipids, 56.5% carbohydrate, 11.32% iber (80% insoluble, 20% soluble), and 3.56 % ash (15-17). Rats were weighed twice per week, and food intake was measured daily.
Biological methods for evaluation of diets
For evaluation of the biological value of the ratios the following indices were used: 1) Protein eficiency ratio (PER) was determined by the following formula: PER = weight gain (g)/protein intake (g); 2) Digestibility (%) (D) = [(Nitrogen intake-Fecal nitrogen)/Nitrogen intake]x100 (18). The fecal nitrogen was determined by Micro-Kjeldahl method (15).
Sample collection and analysis
At the end of the experimental period and after over-night fasting, rats were killed by decapitation, and their liver and spleen were removed and weighed. The en-tire carcasses were eviscerated and frozen for subse-quent body composition analysis. Blood samples were collected, serum was obtained by centrifugation and aliquots were used to measure serum glucose by the oxidase-peroxidase method (19), total serum protein by the biuret-modiied method (20), serum albumin by the green bromocresol method (21), using com-mercial kits (Labtest Diagnóstica, Brazil). Comcom-mercial radioimmunoassay kits were used to determine serum insulin (Coat-A-Count DPC MedLab, CA, USA) and serum leptin (Linco Research, Inc, MO, USA) concen-trations. The physiological index of insulin resistance used was HOMA-IR (22), assessed from fasting glu-cose and fasting insulin concentrations using the fol-lowing formula: fasting insulin (µU/mL) x fasting glu-cose (mmol/L)/22.5.
Measurement of carcass composition and energy intake
Cop
yright
© ABE&M t
odos os dir
eit
os r
eser
vados
.
To calculate energy intake, we considered the en-ergy content of protein and carbohydrate to be 16.74 kJ/g, and of fat to be 37.7 kJ/g (4). The body energy content was calculated from the amount of fat and pro-tein using constants 40 kJ/g fat and 24 kJ/g propro-tein. To calculate carcass composition before the recovery stage (initial carcass energy) data from rats under similar dietary treatments were used. From the difference be-tween the inal carcass composition and the initial car-cass composition residual lipid balance, protein balance, energy balance, energy eficiency [(energy gain/energy intake)x100] and energy expenditure (difference be-tween energy intake and energy gain) were calculated.
Statistical analysis
Results were expressed as mean ± SEM for the num-ber of rats indicated. Groups C and A were compared with unpaired t-tests. One-way analysis of variance was
used to compare data from the control (C), recovered control (RC) and recovered rice bran (RRB) groups. When necessary, these analyses were complemented by Tukey test to determine the signiicance of individual differences. Levene’s test for homogeneity of variances was initially used to determine whether data complied with the assumptions of parametric analysis of variance. When necessary, data were log-transformed to correct for variance in heterogeneity or non-normality (25). The Pearson correlation coeficient was used to exam-ine the relationship between energy intake and energy expenditure, between fresh carcass weight and energy expenditure, between HOMA-IR and energy expendi-ture, between fresh carcass weight and energy intake, between HOMA-IR and energy intake. A p < 0.05 indicated statistical signiicance. All statistical compari-sons were performed using the Statistics software pack-age (Statsoft, Tulsa, OK, USA).
RESULTS
After twelve days on an aproteic diet group A’s car-cass weight corresponded to 48% of group C’s carcar-cass weight. Despite the reduction observed in the whole protein content, its proportion was similar in both groups. The absolute and relative amount of body lipid was lower in group A than in group C. Serum total pro-tein, albumin, leptin and insulin concentrations were reduced in A as compared to group C. Only serum glu-cose levels were similar between groups (Table 1).
Table 1. Carcass composition, serum concentration of total protein, albumin, glucose, insulin and leptin of rats weaned and maintained for 12 days with C (Control) or A (Aproteic) diet
Variables C (n = 6) A (n = 6) P
Fresh carcass (g) 94.0 ± 2.8 45.2 ± 1.4 P < 0.001
Protein (g) 15.4 ± 0.5 5.2 ± 0.3 P < 0.001
Protein (g/100 g carcass weight) 16.5 ± 0.5 17.0 ± 0.7 P > 0.05
Lipid (g) 4.9 ± 0.6 0.7 ± 0.1 P < 0.001
Lipid (g/100 g carcass weight) 5.9 ± 0.7 2.3 ± 0.3 P < 0.001
Total protein (g/dL) 5.87 ± 0.09 4.37 ± 0.12 P < 0.001
Albumin (g/dL) 3.10 ± 0.07 2.20 ± 0.05 P < 0.001
Glucose (mg/dL) 76.86 ± 2.91 67.68 ± 4.66 P > 0.05
Insulin (µU/mL) 16.84 ± 2.95 < 4.0 P < 0.001
Leptin (ng/mL) 0.69 ± 0.10 0.39 ± 0.004 P < 0.05
Data are reported as means ± SEM. Student’s independent t-test.
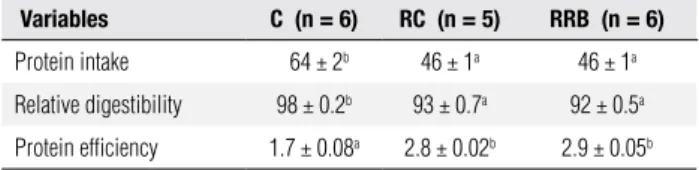
Similar protein intake and protein digestibility in both RC and RRB groups was observed, but it was sig-niicantly lower when compared to group C. Protein eficiency did not differ in RC and RRB groups, but it was increased in relation to group C (Table 2).
Table 2. Protein intake (g), relative digestibility and protein efficiency of rats weaned and maintained with C (Control) and recovered for 21d with RC (Recovered Control) or with RRB (Recovered Rice Bran)
Variables C (n = 6) RC (n = 5) RRB (n = 6)
Protein intake 64 ± 2b 46 ± 1a 46 ± 1a
Relative digestibility 98 ± 0.2b 93 ± 0.7a 92 ± 0.5a
Protein efficiency 1.7 ± 0.08a 2.8 ± 0.02b 2.9 ± 0.05b
Values are means ± SEM for the number of rats in parentheses. Means with different superscript letters are significantly different by one-way ANOVA followed by Tukey test (p < 0.05).
Fresh carcass weights from the RC and RRB groups were similar and signiicantly lower than in the group C. In the RRB group the total carcass protein content was decreased compared to group C and equal to the RC group. The lipid content in the RC and in RRB groups was lower than in group C. However, the proportion of protein and lipids were not different among groups.
Cop
yright
© ABE&M t
odos os dir
eit
os r
eser
vados
.
Increased sympathetic activity and thermogenesis may inhibit insulin release (29) and simultaneously stim-ulate glucose transport (30). The hypoinsulinaemia and euglycemia exhibited by our rats from the aproteic group reinforce the hypothesis of increased sympathetic activ-ity and thermogenesis in this animal model. However, this hypothesis is attenuated if one considers that murine leptin deiciency is accompanied by hypometabolism and decreased sympathetic activity (31) in mice (32).
Rats recovering from malnutrition with rice bran or on control diets showed a lower carcass weight as compared to control rats, despite the similar energy gain. Although the RC group had exhibited lower lipid gain than group C, the proportion of carcass lipids was equal in all groups. In addition, all groups had similar protein and proportion of carcass protein gains. These results are partially in agreement with the observation that under restricted nutritional conditions followed by recovery, the proportion of lean mass does not change, but the proportion of fat tissue increases (5). However, elevated adiposity after nutritional rehabilitation has been evidenced in models of caloric restriction and our rats were maintained on an aproteic diet.
Relative protein digestibility in the RRB and RC groups was similar and lower than in group C, prob-ably due to permanent damages resulting from the severe protein restriction imposed during critical de-velopment phase. This supposition is reinforced by the observation that malnutrition has dramatic effects on small intestinal mucosal structure and transport activ-ity, reducing the speciic aminoacid absorption that remains impaired even after nutritional recovery (33). Curiously, the recovered groups that had lower protein digestibility demonstrated higher protein eficiency and equal energy eficiency. Taking into consideration that protein eficiency was calculated from the total body weight gain (including water) and energy eficiency was based on energy gain from protein and lipids, it is pos-sible that the irst variable had been overestimated.
Energy expenditure and energy intake in the RRB and RC rats were reduced when compared to control rats, but these variables did not correlate with serum insulin or leptin levels. Energy expenditure was strongly associated with food intake and fresh carcass weight. Positive association between food intake and energy ex-penditure results from diet-induced thermogenesis that recognizably varies with energy ingested as well as with macronutrient composition (34). The relationship be-tween energy expenditure and body weight is remark-Table 3. Carcass composition and energy balance of rats weaned and
maintained with C (Control) and recovered for 21d with RC (Recovered Control) or with RRB (Recovered Rice Bran)
Variables C (n = 6) RC (n = 5) RRB (n = 5)
Fresh carcass (g) 196 ± 2b 129 ± 9a 135 ± 8a
Protein (g) 35 ± 1b 30 ± 2ab 29 ± 1a
Protein (g/100 g carcass weight) 16 ± 0.4 18 ± 0.8 17 ± 0.9
Lipid (g) 27 ± 1.6b 18 ± 1.7a 19 ± 2.5a
Lipid (g/100 g carcass weight) 13 ± 0.8 11 ± 0.7 11 ± 0.9
Energy intake (kJ) 7677 ± 98b 5115 ± 32a 5148 ± 56a
Initial carcass energy (kJ) 601 ± 13b 153 ± 4a 157 ± 8a
Final carcass energy (kJ) 1751 ± 79b 1094 ± 72a 1170 ± 105a
Energy gain (kJ) 1160 ± 83 941 ± 73 1013 ± 102
Gain as protein (kJ) 386 ± 22 418 ± 29 435 ± 44
Gain as lipid (kJ) 775 ± 73b 523 ± 49a 579 ± 78ab
Energy expenditure (kJ) 6517 ± 86b 4174 ± 84a 4134 ± 137a
Energy efficiency 15 ± 1 18 ± 1 20 ± 2
Values are means ± SEM for the number of rats in parentheses. Means with different superscript letters are significantly different by one-way ANOVA followed by Tukey test (p < 0.05).
Energy expenditure was directly correlated with en-ergy intake (r2 = 0.974, P < 0.0001) and fresh carcass
weight (r2 = 0.569, P < 0.0001), but inversely
correlat-ed with HOMA-IR (r2 = 0.314, P < 0.01) (Figure 1A,
1B and 1C). Also, there was a signiicant positive cor-relationbetween energy intake and fresh carcass weight (r2 = 0.809, P < 0.0001) (Figure 1D) as well as a
nega-tive correlation between energy intake and HOMA-IR (r2 = 0.261, P < 0.02) (Figure 1E). Correlations were
absent for energy expenditure and energy intake, and serum insulin and leptin levels.
DISCUSSION
In this study, weaned rats, when submitted to an aproteic diet for twelve days, displayed typical features of malnu-trition, such as reduced carcass mass, hypoproteinaemia and hypoalbuminaemia. Also, reduced absolute energy intake but increased energy intake in proportion to body mass (data not shown) was observed, which can be ex-plained by the preserved proportion of carcass protein.
Cop
yright
© ABE&M t
odos os dir
eit
os r
eser
vados
.
2500 5000 7500
2500 5000 7500 10000
r2= 0.974, P < 0.0001
(A)
Energy expenditure (kJ)
Energy intake (kJ)
2500 5000 7500
50 100 150 200
250 r2 = 0.569, P < 0.0001
(B)
Energy expenditure (kJ)
Carcass weight (g)
2500 5000 7500
0.0 2.5 5.0 7.5
10.0 r2= 0.314, P < 0.01
(C)
Expenditure energy (kJ)
HOMA-IR
2500 5000 7500 10000
50 100 150 200 250 (D)
Energy intake (kJ)
Carcass weight (g)
r2 = 0.809, P < 0.0001
2500 5000 7500 10000
0.0 2.5 5.0 7.5
10.0 r2 = 0.261, P < 0.02
Energy intake (kJ)
HOMA-IR
(E)
Figure 1. Correlation between energy expenditure and energy intake (A), energy expenditure and carcass weight (B), energy expenditure and HOMA-IR (C), energy intake and carcass weight (D) and HOMA-IR and energy intake (E) of C, RC and RRB groups.
C (● closed circle), RC (○ open circle), RRB (∆ open triangle).
ably consistent in a wide range of animal species (35) and body area has been used as the unit that traditional-ly expresses basal metabolism, based on the supposition that body heat loss is proportional body surface (36).
There was a negative correlation between HOMA-IR and energy expenditure, i.e., recovered rats that tended to be more insulin resistant showed low energy expenditure. This observation agrees with the reports that insulin increases sympathetic neural activity and energy expenditure (37,38). Unexpectedly, although weak, there was also an inverse relationship between HOMA-IR and energy intake. Thus, recovered rats that
were insulin resistant ate more than the control rats that showed higher insulin sensitivity. The literature supports the hypothesis that insulin resistance may impair regula-tion of energy intake and at least in obese animals, in-sulin resistance leads to greater energy intake (39,40).
Cop
yright
© ABE&M t
odos os dir
eit
os r
eser
vados
.
Acknowledgements: The authors acknowledge Celso Roberto Afonso for his technical assistance, and the National Council of Research (CNPq) for inancial support.
Disclosure: no potential conlict of interest relevant to this article was reported.
REFERENCES
1. Geloneze B, Mancini MC, Coutinho W. Obesity: knowledge, care, and commitment, but not yet cure. Arq Bras Endocrinol Metabol. 2009;53:117-9.
2. Rothwell NJ, Stock MJ. The development of obesity in animals: the role of dietary factors. Clin Endocrinol Metab. 1984;13:437-49. 3. Eguchi R, Cheik NC, Oyama LM, Oller do Nascimento CM, de Mello MT, Tuik S, et al. Efeitos do exercício crônico sobre a con-centração circulante da leptina e grelina em ratos com obesidade induzida por dieta. Rev Bras Med Esporte. 2008;14:182-7. 4. Du F, Higginbotham DA, White BD. Food intake, energy balance
and serum leptin concentrations in rats fed low-protein diets. J Nutr. 2000;130:514-21.
5. Harris PM, Widdowson EM. Deposition of fat in the body of the rat during rehabilitation after early undernutrition. Br J Nutr. 1978;39:201-11.
6. Barbosa CO, Lopes IBM, Morgano MA, Araújo MAM, Moreira-Araújo RSR. Conteúdo de minerais dos ingredientes e da multi-mistura. Ciênc Tecnol Aliment (Campinas). 2006;26(4):916-20. 7. Santana LFR, Costa NMB, Oliveira MGA, Gomes MRA. Valor
nu-tritivo e fatores antinutricionais de multimisturas utilizadas como alternativa alimentar. Braz J Food Technol. 2000;3:129-35. 8. Glória ECS, Almeida NAV, Costa ASV, Junior EH, Martins SL,
Paula H, et al. Avaliação protéica de uma nova multimistura com base no milho QPM BR 473. Rev Nutr. 2004;17(3):379-85. 9. Mello VD, Laaksonen DE. Fibra na dieta: tendências atuais e
bene-fícios à saúde na síndrome metabólica e no diabetes melito tipo 2. Arq Bras Endocrinol Metabol. 2009;53-5.
10. Lyly M, Liukkonen KH, Salmenkallio-Marttila M, Karhunen L, Pou-tanen K, Lähteenmäki L. Fibre in beverages can enhance percei-ved satiety. Eur J Nutr. 2009;48(4):251-8.
11. Eggum BO, Thorbek G, Beames RM, Chwalibog A, Henckel S. In-luence of diet and microbial activity in the digestive tract on di-gestibility, and nitrogen and energy metabolism in rats and pigs. Br J Nutr. 1982;48(1):161-75.
12. Vahouny GV, Satchithanandam S, Chen I, Tapper SA, Kritche-vsky D, Lightlot FG, et al. Dietary iber and intestinal adaptation: effects on lipid absorption and lymphatic transport in the rat. Am J Clin Nutr. 1988;47:201-6.
13. Juvonen KR, Purhonen AK, Salmenkallio-Marttila M, Lähteenmäki L, Laaksonen DE, Herzig KH, et al. Viscosity of oat bran-enriched be-verages inluences gastrointestinal hormonal responses in heal-thy humans. J Nutr. 2009;139(3):461-6.
14. Reeves PG, Nielsen FH, Fahey GC Jr. AIN-93 puriied diets for laboratory rodents: inal report of the American Institute of Nu-trition ad hoc writing committee on the reformulation of the AIN-76A rodent diet. J Nutr. 1993;123(11):1939-51.
15. Association Oficial Analytical Chemists. Oficial Methods of Analysis. 1995; 16. ed. Arlington: AOAC.
16. Asp NG, Johnansson CG, Hallmer H, Siljestrom M. Rapid enzy-matic assay of insoluble and soluble dietary ibre. J Agric Food Chem. 1983;1:476-82.
17. Instituto Adolfo Lutz − IAL. Normas Analíticas do Instituto Adolfo Lutz. Métodos químicos e físicos para análise de alimentos. 3.ed. São Paulo: IMESP; 1985. p. 21-4.
18. Boza JJ, Jimenez J, Martinez O, Suarez MD, Gil A. Nutritional va-lue and antigenicity of two milk protein hydrolysates in rats and guinea pigs. J Nut. 1994;124(10):1978-86.
19. Trinder P. Determination of blood glucose using an oxidase-pero-xidase system with a non-carcinogenic chromogen. J Clin Path. 1969;22:158-61.
20. Wolfson WQ, Cohn C, Calvary F, Ichiba F. Studies in serum pro-teins. A rapid procedure for the estimation of total protein true albumin, total globulin, alpha globulin and gamma globulin in 1.0 mL of serum. Am J Clin Pathol. 1948;18:723-30.
21. Doumas BT, Watson WA, Biggs HG. Albumin standards and mea-surements of serum albumin with bromocresol green. Clin Chim Acta. 1971;31:87-96.
22. Matthews DR, Hosker JP, Rudenski AS, Naylor BA, Treacher DF, Turner RC. Homeostasis model assessment: insulin resistance and beta-cell function from fasting plasma glucose and insulin concentrations in man. Diabetol. 1985;28:412-9.
23. Folch J, Lees M, Stanley GHS. A simple method for the isolation and puriication of total lipids from animal tissues. J Biol Chem. 1957;226:497-509.
24. Leshner AI, Litwin VA, Squibb RL. A simple method for carcass analysis. Physiol Behav. 1972;9:281-2.
25. Sokal RR, Rohlf FJ. Biometry: the principles and practice of statis-tics in biological research. New York: WH Freeman and Company; 1995. p. 392-450.
26. White BD, Porter MH, Martin RJ. Protein selection, food intake, and body composition in response to the amount of dietary pro-tein. Physiol Behav. 2000;69:383-9.
27. Rothwell NJ, Stock MJ. Inluenced of carbohydrate and fat intake on diet-induced thermogenesis and brown fat activity in rats fed low protein diets. J Nutr. 1987;117(10):1721-6.
28. Cannon B, Nedergaard J. Brown adipose tissue: function and physiological signiicance. Physiol Rev. 2004;84(1):277-359. 29. Baroody GM, Howland RJ. Insulin secretion by the perfused
pancreas of the cold- acclimated rat. Can J Physiol Pharmacol. 1980;58:1426-30.
30. Aparecida de França S, dos Santos MP, Garófalo MAR, Navegan-tes LC, Kettelhut IC, Lopes CF, et al. Low protein diet changes the energetic balance and sympathetic activity in brown adipose tis-sue of growing rats. Nutrition. 2009;1186-92.
31. Montez JM, Soukas A, Asilmaz E, Fayzikhodjaeva G, Fantuzzi G, Friedman JM. Acute leptin deiciency, leptin resistance, and the physiological response to leptin withdrawal. Proc Natl Acad Sci. 2005;102:2537-42.
32. Huang K, Rabold R, Abston E, Schoield B, Misra V, Galdzicka E, et al. Effects of leptin deiciency on postnatal lung development in mice. J Appl Physiol. 2008;105:249-59.
33. Ventrucci G, Ramos SLG, Roston MMA, Gomes MMC. Effects of a leucine-rich diet on body composition during nutritional recovery in rats. Nutrition. 2004;20:213-7.
34. Riggs AJ, White BD, Gropper SS. Changes in energy expenditure associated with ingestion of high protein, high fat versus high protein, low fat meals among underweight, normal weight, and overweight females. J Nutr. 2007;12:6-40.
35. Kleiber M. Body size and metabolic rate. Physiol Rev. 1947;15:511-41. 36. Dubois D, Dubois EF. Clinical calorimetry. The formula to
estima-te the approximaestima-te surface area if height and weight be known. Arch Inter Med. 1916;17:863.
37. Plum L, Belgardt BF, Brüning JC. Central insulin action in energy and glucose homeostasis. J Clin Invest. 2006;116(7):1761-6. 38. Velloso LA. O controle hipotalâmico da fome e da termogênese
– Implicações no desenvolvimento da obesidade. Arq Bras Endo-crinol Metabol. 2006;50(2):165-76.
39. Han JC, Rutledge MS, Kozlosky M, Salaita CG, Gustafson JK, Keil MF, et al. Insulin resistance, hyperinsulinemia, and energy intake in overweight children. J Pediatr. 2008;152(5):612-7.