Effect of Octreotide on Hepatic Steatosis in
Diet-Induced Obesity in Rats
Mao Li1,2¤, Ting Ye1,2, Xiao-Xia Wang1,2, Xian Li1, Ou Qiang1, Tao Yu1,2, Cheng-Wei Tang2, Rui Liu1*
1Division of Peptides Related to Human Disease, State Key Laboratory of Biotherapy, West China Hospital, Sichuan University, Chengdu, China,2Department of Gastroenterology, West China Hospital, Sichuan University, Chengdu, China
¤ Current address: Department of Internal Medicine, Chongqing Emergency Medical Center, Chongqing Institution of Accident & Emergency Medicine, Chongqing, China
*lrui60@163.com
Abstract
Background
Non-alcoholic fatty liver disease (NAFLD) caused by liver lipid dysregulation is linked to obesity. Somatostatin (SST) and its analogs have been used to treat pediatric hypothalamic obesity. However, the application of such drugs for the treatment of NAFLD has not been evaluated.
Objective
This study aimed to investigate the expression levels of important regulators of hepatic lipid metabolism and the possible effect of the SST analog octreotide on these regulators.
Methods
SD rats were assigned to a control group and a high-fat diet group. Obese rats from the high-fat diet group were further divided into the obese and octreotide-treated groups. The body weight, plasma SST, fasting plasma glucose (FPG), insulin, triglyceride (TG), total cholesterol (TC), low-density lipoprotein cholesterol (LDL-C), high-density lipoprotein cho-lesterol (HDL-C) and free fatty acid (FFA) levels were measured. Hepatic steatosis was evaluated based on the liver TG content, HE staining and oil red O staining. The SREBP-1c, ACC1, FAS, MTP, apoB and ADRP expression levels in the liver were also determined by RT-PCR, qRT-PCR, western blot or ELISA.
Results
The obese rats induced by high-fat diet expressed more SREBP-1c, FAS and ADRP but less MTP protein in the liver than those of control rats, whereas octreotide intervention reversed these changes and increased the level of apoB protein. Compared to the control group, obese rats showed increased liver ACC1, SREBP-1c and apoB mRNA levels, whereas octreotide-treated rats showed decreased mRNA levels of apoB and SREBP-1c.
a11111
OPEN ACCESS
Citation:Li M, Ye T, Wang X-X, Li X, Qiang O, Yu T, et al. (2016) Effect of Octreotide on Hepatic Steatosis in Diet-Induced Obesity in Rats. PLoS ONE 11(3): e0152085. doi:10.1371/journal.pone.0152085
Editor:Jonathan Peterson, East Tennessee State University, UNITED STATES
Received:July 28, 2015
Accepted:March 8, 2016
Published:March 22, 2016
Copyright:© 2016 Li et al. This is an open access article distributed under the terms of theCreative Commons Attribution License, which permits unrestricted use, distribution, and reproduction in any medium, provided the original author and source are credited.
Data Availability Statement:All relevant data are within the paper and its Supporting Information files.
Funding:The project was supported by National Natural Science Foundation of China. The grant number was No. 30870919 and Rui Liu received the funding. Rui Liu had an important role in study design, decision to publish, and preparation of the manuscript.
This was accompanied by increased body weight, liver TG contents, FPG, TG, TC, LDL-C, FFA, insulin and derived homeostatic model assessment (HOMA) values. Octreotide inter-vention significantly decreased these parameters. Compared to the control group, the obese group showed a decreasing trend on plasma SST levels, which were significantly increased by the octreotide intervention.
Conclusion
Octreotide can ameliorate hepatic steatosis in obese rats, possibly by decreasing hepatic lipogenesis and increasing TG export from hepatocytes.
Introduction
Non-alcoholic fatty liver disease (NAFLD) is closely related to diabetes and obesity [1,2] and
has become a primary disease endangering public health. The incidence of NAFLD is report-edly 19.0% in the United States and as high as 44.3–56.6% in obese individuals with a BMI
(body mass index) exceeding 35 kg/m2[3]. NAFLD is manifested by the accumulation of lipids
in the liver in the absence of excess alcohol consumption, caused by the imbalance between lipid input (fatty acid uptake and de novo lipogenesis) and output (VLDL export and fatty acid
β-oxidation) [4].
Acetyl-CoA carboxylase (ACC1) and fatty acid synthase (FAS) are the regulatory enzymes for hepatic lipid synthesis. Insulin regulates the transcription and activation of liver sterol regu-latory element binding protein-1c (SREBP-1c), which participates in liver fatty acid synthesis by stimulating the expression of ACC1 and FAS. Hyperactivation of SREBP-1c induces hepatic
lipid accumulation [5,6,7], indicating that SREBP-1c-associated de novo lipogenesis is an
important target of hepatic steatosis.
For hepatic lipid export, triglyceride (TG) export depends not only on the secretion rate of VLDL but also on the TG content of VLDL. Microsomal triglyceride transfer protein (MTP) is a rate-limiting factor for the assembly of VLDL, which involves the transfer of a few lipids to
apolipoprotein B (ApoB) [8,9]. The esterification and maturation process of VLDL is
associ-ated with adipose differentiation-relassoci-ated protein (ADRP). ADRP can reduce the TG content of VLDL and promote fatty liver disease by diverting fatty acids from the VLDL assembly path-way into the production of cytosolic triglycerides [10].
Octreotide, a synthetic and eight-peptide analog of somatostatin (SST), has a strong affinity to somatostatin receptor 2 (SSTR2), which was high-expressed in the liver. Valuable results show that octreotide has been used to treat obese patients with insulin hypersecretion [11] and pediatric hypothalamic obesity [12]. Recently, we have found that octreotide shows new and important functions in decreasing body weight via the suppression of intestinal fat absorption [13] and also in improving pancreatic fatty infiltration [14] in high-fat diet (HFD)-induced obese rats. However, the effects of octreotide on fatty liver disease in HFD-induced obese rats remain uncertain.
Materials and Methods
Animals and experimental designs
Fifty-six healthy, 21-day-old male Sprague-Dawley rats were purchased from the Animal Cen-ter of Sichuan University. All rats were housed in individual cages with 12 h light-dark cycles and given free access to water and chow. After 3 days of adjustable feeding at the Animal Cen-ter of West China Hospital, the rats were randomly divided into two groups as follows: the first group containing 16 rats was maintained on standard chow (290 kcal/100 g, in accordance with the People’s Republic of China National Standard GB 14924–2001) for 176 days which was set as the normal control group, whereas the second group containing 40 rats was fed high-fat chow (430 kcal/100 g, supplemented with 10% protein, 15% lard, and 10% sucrose). It has reported that such high-fat diet formulation induces obesity in rats [15]. The body weights
and body lengths were measured once per week. Then, Lee’s index [body weight (g)1/3× 1,000/
body length (cm)] was calculated. At the end of week 24, 32 eligible obese rats with a mean body weight at least 1.4 times heavier than that of the control group were selected from the high-fat diet rats [16] and divided into the obese group and octreotide-treated group, with 16 rats each. Both groups of rats were continuously fed high-fat chow, but the rats in the latter
group were administered a subcutaneous injection of octreotide at a dose of 40μg/kg body
weight twice daily for 8 days. In previous clinical studies, it was shown that both a high dosage (60 mg) and low dosage (40 mg) of octreotide administered to patients resulted in similar weight loss in obese adults with insulin hypersecretion, suggesting that a higher dose of octreo-tide used did not achieve better curative effect in treating obesity [11]. On the contrary, high dose of octrotide could damage small intestinal morphology in rats [17]. Therefore, in our study, a single low dose of octreotide was selected to study its influence on hepatic steatosis
associated with obesity [13,18]. Food intake was measured daily in all groups to calculate the
energy intake during the final 8 days.
The rats were fasted for 12 hours and anesthetized with 2% sodium pentobarbital adminis-tered intraperitoneally at the end of the experiments. The liver and abdominal adipose (perire-nal, testicular, and omental adipose tissue) were collected and weighed. Portions of the liver were either frozen at -80°Cfor the analysis of gene and protein expression or fixed in 4% para-formaldehyde for further histopathological analysis. The blood samples were centrifuged (1,000 rpm, 4°C, 15 min) to separate the plasma and then stored at -80°C for use.
The Institutional Animal Care and Ethic Committee of Sichuan University (Approved No. SYXK 2008–119) approved all animal studies.
Fasting glucose, lipids, insulin, SST and HOMA index
binding of125I-SST with its antibody. Therefore, the total binding to SST antibody in the plasma after octreotide injection was defined as SST-like immunoreactivity (SST-LIR) [20].
Histopathological study of liver steatosis
Liver tissues were fixed, dehydrated and embedded in paraffin. Paraffin sections (3-μm
thick-ness) were then subjected to hematoxylin and eosin (HE) staining. The liver tissue morphology and unstained areas of fat vacuoles were observed under a light microscope. Oil red O (ORO) staining was performed to detect neutral lipids and lipid droplet morphology with slight
modi-fications [21]. Briefly, rat livers were flash-frozen in liquid N2and subjected to frozen
section-ing. Then, the frozen tissue sections (9-μm thickness) were immersed in 1% oil red O working
solution for 10 min, counterstained with hematoxylin, and then rinsed under running tap water for 30 min. Photomicrographs were captured under a microscope (Olympus, Tokyo, Japan) from different views. The integrated optical density (IOD) of the oil red O-stained area was analyzed with Image-Pro Plus 6.0 software (Media Cybernetics, Silver Spring, MD, USA).
Liver lipid content
To determine the liver lipid content, hepatic lipids were extracted [22]. Briefly, liver tissues (15 mg) were homogenized in 1 ml of chloroform: methanol solution (v/v, 2:1), shaken for 20 min and centrifuged at 1800 rpm for 10 min. The supernatant was separated, mixed with 0.9% NaCl and centrifuged at 2000 rpm for an additional 20 min. The organic phase was dried and re-dissolved in 3% Triton X-100. After lipid extraction, TG concentration in the liver was mea-sured with commercial kits (ZhongSen Co., Beijing, China), which are presented as milligrams of triglyceride per gram of liver.
Hepatic VLDL production
In a separate experiment, the rats from three groups (control, obese and octreotide-treated group) were fed as described above. At the end of the octreotide treatment, three groups of rats were fasted for 12 h and injected with Triton WR-1339 (Sigma-Aldrich, USA) via the tail vein at a dose of 500 mg/kg body weight [23,24]. Plasma samples were collected at 0, 1, 2, 3, and 4 h respectively after the injection via tail bleed, and the serum TG was measured using enzymatic methods (ZhongSen Co., Beijing, China). Because Triton WR-1339 effectively blocks the deg-radation of VLDL [25], the increase in TG represents the VLDL production from the liver.
A linear relationship was observed between VLDL-TG concentrations and time after i.v. injection of Triton WR-1339, and the VLDL-TG secretion rate was calculated as the slope of this linear curve [23].
RT- PCR
gray intensity was analyzed using Quantity One software 4.6.2 (Bio-Rad Laboratories, Hercu-les, CA, USA). GAPDH was used as the internal control.
Quantitative real-time PCR (qRT-PCR)
The 2×SYBR Green qPCR Master Mix qRT-PCR RNA Detection Kit (Biotool, Houston) was used in conjunction with SYBR Green for the quantification of the ADRP, FAS, and SREBP-1c genes. Total RNAs from the liver tissues were extracted using Trizol reagent (Takara Bio-Engi-neering Co., Ltd., Kyoto, Japan). The cDNA was obtained from reverse transcription (RT) reac-tions. Briefly, ~50 ng of total RNA was subjected to reverse transcription with random primers according to the manufacturer’s instructions. Then, the cDNA products were used for SYBR green-quantitative real-time PCR reaction together with the relative primers (Table 1). The amplification reactions were performed at 95°C for 5 min followed by 35 cycles of 95°C for 15 s
and 60°C for 30 s (Biotool, Houston) on the iQTM5Real Time PCR Detection System. The
expression of ADRP, FAS, and SREBP-1c was analyzed from the real-time PCR assay, which
was normalized using the 2-ΔΔCtCtmethod relative toβ-actin.
Western Blot analysis
The concentration of the proteins extracted from the livers was quantitated with a BCA protein assay kit (Pierce Biotechnology Inc., Rockford, IL, United States) prior to mixing with loading
buffer and heating at 100°C for 5 min. The extracted protein (40μg) was separated by
SDS-PAGE and then transferred to polyvinylidene difluoride membranes (Millipore, Bedford, MA, USA). Nonspecific binding sites were blocked with 5% non-fat dry powdered milk in incubation buffer, and the membranes were then incubated with antibodies against rat MTP (1:5,000, BD Biosciences, San Jose, CA, USA), SREBP-1c (1:1, 000, Santa Cruz, CA), or ADRP (1:3,000, Epitomics, USA) at 4°C overnight. The membranes were washed, followed by incuba-tion with the appropriate HRP-conjugated secondary antibodies for 2 h at room temperature (Zhongshan Golden Bridge Bio-technology, Beijing, China). Specific bands were visualized by ECL detection. The band densities were quantified using Quantity One software 4.6.2. The
housekeeping proteinβ-actin or GAPDH was analyzed for normalization.
Immunohistochemical studies of liver sections
After deparaffinization, sections of liver tissue were subjected to high-pressure antigen retrieval
for 10 min in citrate buffer at pH 6.0 and treated with 3% H2O2for 10 min. After blocking with
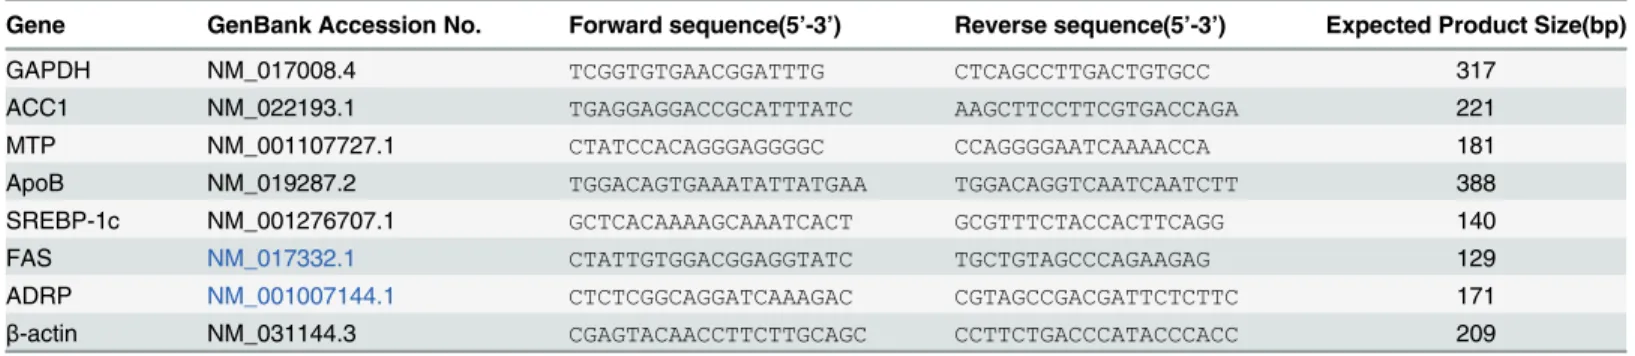
Table 1. List of primers for RT-PCR or qRT-PCR.
Gene GenBank Accession No. Forward sequence(5’-3’) Reverse sequence(5’-3’) Expected Product Size(bp)
GAPDH NM_017008.4 TCGGTGTGAACGGATTTG CTCAGCCTTGACTGTGCC 317
ACC1 NM_022193.1 TGAGGAGGACCGCATTTATC AAGCTTCCTTCGTGACCAGA 221
MTP NM_001107727.1 CTATCCACAGGGAGGGGC CCAGGGGAATCAAAACCA 181
ApoB NM_019287.2 TGGACAGTGAAATATTATGAA TGGACAGGTCAATCAATCTT 388
SREBP-1c NM_001276707.1 GCTCACAAAAGCAAATCACT GCGTTTCTACCACTTCAGG 140
FAS NM_017332.1 CTATTGTGGACGGAGGTATC TGCTGTAGCCCAGAAGAG 129
ADRP NM_001007144.1 CTCTCGGCAGGATCAAAGAC CGTAGCCGACGATTCTCTTC 171
β-actin NM_031144.3 CGAGTACAACCTTCTTGCAGC CCTTCTGACCCATACCCACC 209
ACC1, Acetyl-CoA carboxylase; MTP, Microsomal triglyceride transfer protein; ApoB, apolipoprotein B; SREBP-1c, sterol regulatory element binding protein-1c; FAS, fatty acid synthase; ADRP, Adipose Differentiation-Related Protein.
goat serum, the sections were incubated with FAS (1:100, Bioss, Beijing, China) and anti-ADRP (1:500) overnight at 4°C. The FAS and anti-ADRP proteins were detected by incubating the sections with biotinylated secondary antibodies to form streptavidin-biotin-complexes. Finally, the immunocomplex was visualized by a solution of diaminobenzidine tetrahydrochloride, and the sections were counterstained with hematoxylin. Three fields were randomly selected for each rat liver, and the IOD value was analyzed with Image Pro Plus 6.0 software.
Enzyme-linked immunosorbent assay (ELISA)
In brief, liver tissue (40 mg) was homogenized at 4°C in phosphate buffered saline (pH 7.4) and centrifuged at 2000 rpm for 20 min at 4°C. The levels of apoB protein were determined using an ELISA kit (R&D Systems, Minneapolis, USA) following the manufacturer’s instructions.
Statistical analysis
Data are presented as the mean± SD and were analyzed with SPSS 16.0 statistical software (SPSS, Chicago, IL, USA). Comparisons among three groups were performed by one-way ANOVA test, and then Student-Newman-Keuls test was applied to detect significant differ-ences. A test for the homogeneity of variances was also necessary. Differences were considered statistically significant when P values were less than 0.05.
Results
Body weight, food intake and parameters associated with obesity
Body weight gain was calculated by the difference between final body weight at the end of the experiments and original body weight in all rats within the 176-day period. As shown in Table 2, the body weight at the 24thweek, final body weight, body weight gain and Lee’s indexwere significantly greater in the obese rats compared to these of the control group (p<0.01).
The final body weight and body weight gain of the octreotide-treated group were significantly
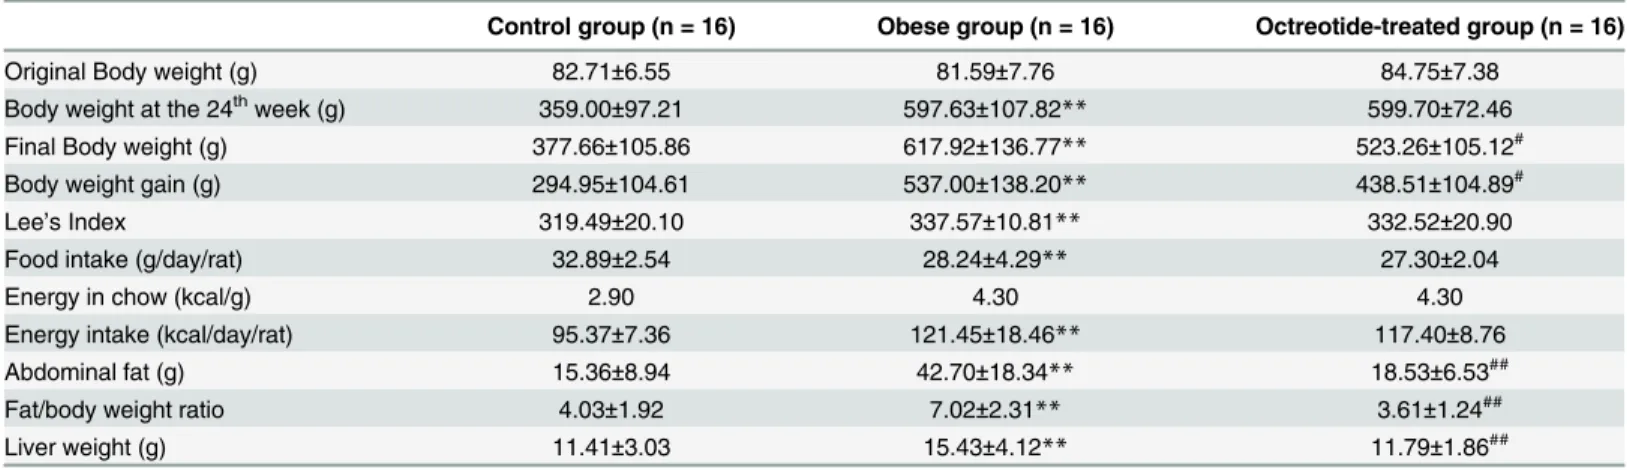
Table 2. The food intake, body weight and parameters associated with obesity in each group.
Control group (n = 16) Obese group (n = 16) Octreotide-treated group (n = 16)
Original Body weight (g) 82.71±6.55 81.59±7.76 84.75±7.38
Body weight at the 24thweek (g) 359.00±97.21 597.63±107.82
** 599.70±72.46
Final Body weight (g) 377.66±105.86 617.92±136.77** 523.26±105.12#
Body weight gain (g) 294.95±104.61 537.00±138.20** 438.51±104.89#
Lee’s Index 319.49±20.10 337.57±10.81** 332.52±20.90
Food intake (g/day/rat) 32.89±2.54 28.24±4.29** 27.30±2.04
Energy in chow (kcal/g) 2.90 4.30 4.30
Energy intake (kcal/day/rat) 95.37±7.36 121.45±18.46** 117.40±8.76
Abdominal fat (g) 15.36±8.94 42.70±18.34** 18.53±6.53##
Fat/body weight ratio 4.03±1.92 7.02±2.31** 3.61±1.24##
Liver weight (g) 11.41±3.03 15.43±4.12** 11.79±1.86##
Body weight gain was calculated by the difference betweenfinal body weight at the end of the experiments and original body weight. Data are expressed as mean±SD
**p<0.01 vs. control group #
p<0.05 vs. obese group ##
p<0.01 vs. obese group
decreased compared to the obese group (p<0.05). However, Lee’s index did not differ
signifi-cantly between these two groups. In addition, octreotide was effective in attenuating the increased abdominal fat and fat/body weight ratio in obese rats.
The consumption of a high-fat diet led to a decrease in food intake (g/day/rat); however, energy intake (kcal/day/rat) in the obese group was 27.3% higher than that in the control
group (p<0.01). The food/energy intake on the HFD was not significantly different between
the obese group and the octreotide-treated group. The octreotide intervention had no effect on food/energy intake in the obese rats.
Serum glucose, lipids, insulin, SST level and HOMA index
As shown inTable 3, the serum FPG, TG, TC, LDL-C, FFA, insulin and HOMA index were
sig-nificantly increased in the obese group compared to the control group. Octreotide treatment
significantly reduced the levels of these parameters (p<0.05). As the good cholesterol, the
HDL-C concentration was lower in the obese group compared to that in the control group
(p<0.05); however, octreotide was not effective in increasing the HDL-C levels. Compared to
the control group, the plasma SST levels in the obese group were decreased, but there was no
significant difference (p>0.05). Nevertheless, the plasma SST levels notably increased in the
octreotide-treated group compared to the obese group (p<0.05).
Octreotide reduces liver steatosis in obese rats
It can be seen fromFig 1Athat the livers of obese rats were slightly yellow in appearance. The
liver weights of the obese rats were heavier than that of the control group (Table 2,Fig 1E). By
contrast, the livers of the octreotide-treated and control groups were similar in weight and macroscopic appearance. Lipid accumulation was elevated in the obese rats, as indicated by larger H&E unstained areas of hepatocytes (Fig 1B), as well as more red hepatocytes and higher
IOD values (p<0.01;Fig 1D) in the oil red O-stained sections (Fig 1C) compared to the control
group. However, octreotide treatment significantly decreased the H&E unstained area and the
Table 3. The serum lipid, fasting glucose, insulin, somatostatin levels and HOMA index in each group.
Control group (n = 16) Obese group (n = 16) Octreotide-treated group (n = 16)
Serum lipids levels
Triglyceride (mmol/L) 0.93±0.20 1.54±0.36** 1.12±0.26##
Total cholesterol (mmol/L) 1.74±0.31 2.08±0.40* 1.60±0.35##
LDL-C (mmol/L) 0.53±0.07 0.70±0.10** 0.50±0.11##
HDL-C (mmol/L) 1.01±0.15 0.84±0.13* 0.91±0.20
FFA/ (μmol/L) 327.33±130.59 754.79±129.21** 533.68±203.48#
Fasting glucose (mmol/L) 7.13±0.58 8.64±0.93** 7.81±1.04#
Serum insulin (mmol/L) 17.71±11.43 38.01±23.70** 14.27±10.63##
HOMA Index 5.15±3.56 14.19±11.37** 6.38±5.28##
Somatostatin (pg/mL) 129.51±47.17 116.12±55.42 185.44±98.55#
LDL-C, Low-density lipoprotein cholesterol; HDL-C, High-density lipoprotein cholesterol; FFA, Free fatty acid; Data are expressed as mean±SD
*p<0.05 vs. control group
**p<0.01 vs. control group #
p<0.05 vs. obese group ##
p<0.01 vs. obese group
oil red O-stained red tissue. Also, the IOD value of the octreotide-treated group was
signifi-cantly lower than that of the obese group (p<0.01). Consistent with these results, the TG
con-tent in the liver tissue was 3.2 times higher in the obese rats than in the normal control group, whereas the levels of liver TG decreased by 35.5% after octreotide treatment (Fig 1F).
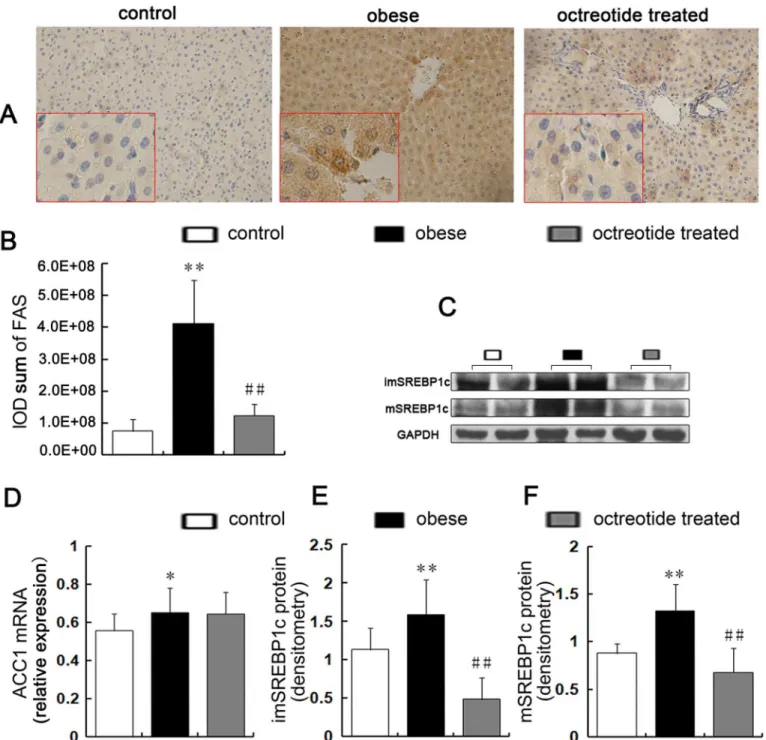
Expression of hepatic genes and proteins for fatty acid synthesis
Both immature and mature SREBP-1c proteins (Fig 2C, 2E and 2F) were elevated in the obese
group compared to the control group (p<0.01), but octreotide treatment induced decreases of
immature and mature SREBP-1c proteins by approximately 69.3 and 48.8% (p<0.01),
respec-tively. The results of the immunohistochemical staining showed that the up-regulation of FAS in the livers of the obese group significantly decreased in response to octreotide treatment (Fig 2A and 2B).Fig 3shows that compared to the control group, the obese group had a 2.4-fold higher SREBP-1c level and 6.3-fold higher FAS level, respectively. However, treatment with octreotide led to a significant decrease in SREBP-1c and FAS expression (48.6 and 93.3%,
Fig 1. Reduction of hepatic steatosis with octreotide treatment.Compared to the livers in the control group, typical hepatic steatosis was evidenced by a faint yellow color (A), a larger unstained area that consisted of fat vacuoles (B; H&E-stained; ×400 magnification), a larger red area that consisted of lipid droplets (C, D; oil red O staining; ×400 magnification), heavier livers (E), and higher TG contents (F) in the livers of the obese group. Octreotide treatment significantly reversed these changes in the liver.**p<0.01 vs. control group; ##p<0.01 vs. obese group.
Fig 2. Expression of key factors related to hepatic lipogenesis synthesis.The positive expression of FAS is indicated by brown granules (A,
immunohistochemistry stain, ×400 magnification). The protein levels of FAS were detected by immunohistochemistry (A, B). Immature SREBP1c (C, E) and mature SREBP1c (C, F) were measured by western blot and were significantly higher in the obese group than the control group, whereas octreotide intervention inhibited these increases to varying degrees. A semi-quantitative RT-PCR analysis showed that the level of ACC1 mRNA was higher in the obese group than the control group, but the liver ACC1 mRNA levels did not differ between the obese and octreotide-treated groups (D).*p<0.05 vs. control group;**p<0.01 vs. control group; #p<0.05 vs. obese group; ##p<0.01 vs. obese group.
respectively) in the octreotide-treated rats, the results of which were similar to the control group. The liver mRNA levels of ACC1 increased by 19% in the obese group compared to the
control group (p<0.05). Unexpectedly, the liver ACC1 mRNA levels in the obese and
octreo-tide-treated groups showed no difference (p>0.05;Fig 2D).
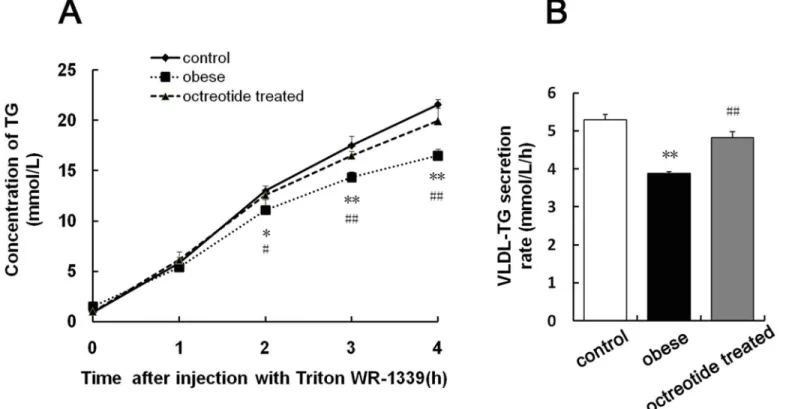
Effect of octreotide on hepatic VLDL production
Fig 4Ashows that the TG concentration was increasing as function of time in all groups. Also, compared with obese group, octreotide could significantly induce TG secretion after 2-h Triton
Fig 3. Expression of SREBP1c, FAS and ADRP mRNA in the liver.The quantitative real-time PCR showed that the levels of SREBP1c, FAS and ADRP mRNA in the obese group were higher than the control group, whereas octreotide intervention inhibited the expression of these genes.**p<0.01 vs. control
group; ##p<0.01 vs. obese group.
WR-1339 injection (p<0.05 at 2 h;p<0.01 at 3 and 4 h). To our best knowledge, the VLDL-TG
secretion rate was calculated as the slope of the curve linearization between VLDL-TG concen-trations and time [23]. The VLDL-triglyceride secretion rate in the obese group was
signifi-cantly decreased compared with the control group (p<0.01;Fig 4B). Treatment with octreotide
resulted in a significantly increased hepatic VLDL-triglyceride secretion rate compared to the
obese group (p<0.01;Fig 4B).
Expression of hepatic genes and proteins for VLDL assembly and
maturation
The MTP mRNA levels showed no difference among the three groups (p>0.05;Fig 5D);
how-ever, the hepatic MTP protein levels in the obese rats were decreased compared to the control group. On the contrary, the MTP protein level was significantly increased in response to
octreotide treatment (p<0.01;Fig 5B and 5F).
RT-PCR showed that the level of apoB mRNA in the obese group increased by 110% and
115.5% compared to the control and the octreotide-treated groups, respectively (p<0.01;Fig
5G). In contrast to the mRNA changes, ELISA demonstrated that the apoB protein levels did
not differ significantly between the control and obese groups (p>0.05). However, the apoB
pro-tein level in the octreotide-treated group was significantly increased by 27% compared to the
obese group (p<0.01;Fig 5H).
Fig 4. Hepatic secretion of VLDL-triglycerides in fasting rats after i.v. administration of Triton WR-1339.Three groups of rats (control, obese and octreotide-treated group) were fasted for 12 hours prior to tail intravenous injection of Triton WR1339 at 500 mg/kg body weight. Blood samples were taken at 0, 1, 2, 3, and 4 hours post-injection for the estimation of plasma TG concentrations (A). The VLDL secretion rates (mmol/L/h) were calculated using the slopes of the curves (B). Data are presented as the mean±SD (n= 3).*p<0.05 vs. control group;**p<0.01 vs. control group; #p<0.05 vs. obese group; ##p<0.01 vs. obese group.
The immunohistochemistry indicated that the ADRP protein localized to the surface of the
lipid droplets (LDs) (Fig 5A). The immunohistochemical staining (p<0.01;Fig 5A and 5C),
western blot (p<0.01;Fig 5B and 5E) and real-time PCR (p<0.01;Fig 3) analyses showed that
ADRP protein and mRNA were up-regulated in the obese group compared to the control
Fig 5. Expression of key factors involved in VLDL assembly, esterification and secretion.The positive expression of ADRP is manifested by brown granules (A, immunohistochemistry staining, ×400 magnification). The Integral Optical Density (IOD) of ADRP were analyzed by Image Pro Plus 6.0 software (C). ADRP expression was significantly higher in obese rats than in the control and octreotide-treated rats, as evidenced by immunohistochemistry and western blot analyses (B, E). The level of MTP mRNA were detected by RT-PCR (D). The protein level of hepatic MTP in the obese group was the lowest of the three groups, as measured by a western blot (B, F). Semi-quantitative RT-PCR showed that the level of apoB mRNA in the obese group was the highest among the three groups (G). The protein levels of apoB were measured by ELISA (H).**p<0.01 vs. control group; ##p<0.01 vs. obese group.
group. The addition of octreotide significantly down-regulated the levels of hepatic ADRP
pro-tein and mRNA (p<0.01).
Discussion
A high-fat diet tends to induce obesity, which increases the prevalence of liver steatosis [26]. In our study, the TG content and lipid droplets in the livers of HFD-induced obese rats were sig-nificantly increased, indicating the successful establishment of an animal fatty liver model. Interestingly, octreotide treatment potently suppressed liver lipid accumulation.
Liver steatosis arises from an imbalance between lipid input (fatty acid uptake and de novo lipogenesis) and output (VLDL export and fatty acid oxidation) [4]. SREBP-1c is the key factor for hepatic de novo lipid synthesis and is synthesized as precursors in the endoplasmic reticu-lum. Then, proteolytic cleavage allows the activation and accumulation of SREBP in the nucleus. Mature SREBP-1c is an activated transcription factor that promotes the expression of key enzymes involved in hepatic lipogenesis, including FAS and ACC1. In this study, mature SREBP-1c, immature SREBP-1c, FAS protein and ACC1 mRNA increased in the livers of obese rats compared to the control group. Consistent with these findings, previous studies showed the high expression of FAS and ACC1 in HFD-induced obese mice [27]. It was recently reported that SREBPs are essential for hepatic steatosis in dietary and genetic rodent models of obesity [28], suggesting that a high level of SREBP-1c in high-fat diet-induced obese rats up-regulates the expression of FAS and ACC1 and subsequently increases lipid synthesis, which may be associated with increased insulin levels in obese rats. In fact, insulin can up-regulate and activate hepatic SREBP-1c both transcriptionally and post-translationally, irrespective of insulin resistance [29]. Studies reported that somatostatin and somatostatin analogs can inhibit insulin release via the receptor-selective direction of somatostatin receptor subtype 5 on the membrane surface of islet B cells [30]. Interestingly, we found that octreotide reversed the HFD-induced up-regulation of insulin, SREBP-1c and FAS in the liver, whereas the transcrip-tional level of ACC1 remained unchanged. Octreotide is likely to improve insulin resistance in obese rats, which promotes the transport of glucose, accelerates the glycolysis and oxidation of glucose, and increases the level of citric acid. To our best knowledge, citrate is a key inducer for acetyl-CoA carboxylase (ACC) expression and activity [31], and increased citric acid may inhibit the decrease in ACC1 expression induced by SREBP1c. Therefore, the down-regulation of insulin may reduce the transcription of SREBP-1c and inactivate SREBP-1c protein, which subsequently decrease the expression of FAS and suppress fatty acid synthesis.
VLDL is the principal vehicle for the export of endogenous TG in the liver. The assembly and maturation of VLDL are hypothesized to occur as two steps. The first step is the lipidation of apolipoprotein B (apoB) with a few lipids aided by MTP, forming lipid-poor pre-VLDL
par-ticles [32,33]. The second step is the addition of bulk lipids in the microsome to the pre-VLDL
several explanations for the differences between these studies, such as differences in the genetic backgrounds of the animals, dietary ingredients, and study lengths. Additionally, Chang et al. found that DNA methylation of the MTP promoter may contribute to its down-regulation in rat NAFLD induced by feeding a HFD for 24 weeks [38].
ApoB is the main structural protein of VLDL. In this study, the expression of apoB mRNA was increased in obese rats compared to the control group, but the expression of the apoB pro-tein did not differ between these two groups. Previous studies of heterozygous MTP knockout mice suggested that half-normal levels of MTP decrease the level of plasma apoB100 to the same extent (25–35%) at any level of apoB synthesis [41]. Therefore, although the expression of apoB protein remains unchanged, low levels of MTP in the obese rat liver can reduce apoB secretion. The overexpression of MTP and apoB protein in the octreotide treatment group can increase VLDL assembly and secretion and subsequently increase hepatic TG output. Interest-ingly, we observed that octreotide treatment up-regulated the expression of apoB protein and down-regulated the expression of apoB mRNA compared to the obese group. This phenome-non may be attributed to the protection of apoB from degradation due to the normal folding of apoB protein induced by MTP [42], which ensures a higher VLDL secretion rate.
The esterification and maturation processes of VLDL are associated with ADRP. The level of TG in the cytosol is reduced in ADRP-deficient mice, whereas TG concomitantly accumu-lates in the microsome [43]. The microsomal pool is coupled to VLDL secretion, whereas the
cytosolic pool is not [44,45]. ADRP is suggested to negatively regulate the esterification of
VLDL and TG output, and the overexpression of ADRP leads to lipid accumulation in the liver. Previous research showed that ADRP expression is higher in NAFLD than normal livers [46]. The absence of ADRP reduces the amount of TG in the liver and protects the liver against diet-induced fatty liver development [43]. In our study, octreotide treatment reversed the up-regulation of ADRP in high-fat diet-induced obese rats. The down-up-regulation of ADRP in the octreotide-treated group may positively regulate hepatic microsomal TG accumulation and promote esterification and the secretion of TG-rich VLDL to ultimately reduce the abnormal accumulation of hepatic TG.
In fact, octreotide has been used to cure clinical diseases for several decades, such as pancre-atitis and gastrointestinal bleeding, with relative safety including no toxicity to the liver and kidney and no genetic-related side effects. As a bioactive molecule, however, many other func-tions of octreotide were overlooked. In this study, we found that octreotide improved nonalco-holic fatty liver disease, suggesting that octreotide is a novel promising drug for treating fatty liver disease.
To our knowledge, unsatisfactory safety has limited the practical use of conventional drugs for nonalcoholic fatty liver disease. Unlike conventional drugs, octreotide is an analog of endogenous somatostatin (SST). In addition, octreotide can improve the low level of somato-statin in obesity, improve insulin resistance and pancreatic fat, and inhibit the intestinal absorption of fat. These properties indicate the good biocompatibility of octreotide. Here, we have shown that octreotide decreases rat liver fat levels by regulating SREBP-1c, ACC, FAS, MTP, apoB, and ADRP expression. However, the detailed molecular mechanism remains uncertain. It was reported that the adenosine monophosphate-activated protein kinase
(AMPK) pathway plays an important role in modulating hepatic lipogenesis [47,48,49]. First,
octreotide can ameliorate hepatic steatosis in obese rats fed a high-fat diet and is a promising drug for treating nonalcoholic fatty liver disease.
Supporting Information
S1 File. Original results of the RT-PCR electrophoretic gel analysis for hepatic ACC1 mRNA levels.
(DOC)
S2 File. Original results of the RT-PCR electrophoretic gel analysis for hepatic ApoB mRNA levels.
(DOC)
S3 File. Original results of the RT-PCR electrophoretic gel analysis for hepatic MTP mRNA levels.
(DOC)
S4 File. Original results of the western blot analysis for ADRP protein.
(DOC)
S5 File. Original results of the western blot analysis for MTP protein.
(DOC)
S6 File. Original results of the western blot analysis for SREBP-1c protein.
(DOC)
Acknowledgments
The authors thank Jin-Hang Gao for his technical assistance at the Division of Peptides Related with Human Diseases, State Key Laboratory of Biotherapy, West China Hospital of Sichuan University.
Author Contributions
Conceived and designed the experiments: ML RL. Performed the experiments: ML T. Ye XXW T. Yu OQ. Analyzed the data: ML RL. Contributed reagents/materials/analysis tools: XL OQ CWT. Wrote the paper: ML RL.
References
1. Zhang L, Song HY, Ge YL, Ji G, Yao ZM. Temporal Relationship between Diet-Induced Steatosis and Onset of Insulin/Leptin Resistance in Male Wistar Rats. PloS one. 2015; 10(2). doi: ARTN
e0117008doi:10.1371/journal.pone.0117008ISI:000349444900090.
2. Jung UJ, Choi MS. Obesity and Its Metabolic Complications: The Role of Adipokines and the Relation-ship between Obesity, Inflammation, Insulin Resistance, Dyslipidemia and Nonalcoholic Fatty Liver Disease. Int J Mol Sci. 2014; 15(4):6184–223. doi:10.3390/ijms15046184ISI:000336841200067. PMID:24733068
3. Lazo M, Hernaez R, Eberhardt MS, Bonekamp S, Kamel I, Guallar E, et al. Prevalence of Nonalcoholic Fatty Liver Disease in the United States: The Third National Health and Nutrition Examination Survey, 1988–1994. Am J Epidemiol. 2013; 178(1):38–45. doi:10.1093/aje/kws448ISI:000321449400005. PMID:23703888
4. Guturu P, Duchini A. Etiopathogenesis of nonalcoholic steatohepatitis: role of obesity, insulin resis-tance and mechanisms of hepatotoxicity. Int J hepatol. 2012; 2012:212865. Epub 2012/07/14. doi:10. 1155/2012/212865PMID:22792473; PubMed Central PMCID: PMC3389710.
6. Li XW, Li Y, Yang WT, Xiao C, Fu SX, Deng QH, et al. SREBP-1c overexpression induces triglycerides accumulation through increasing lipid synthesis and decreasing lipid oxidation and VLDL assembly in bovine hepatocytes. J Steroid Biochem. 2014; 143:174–82. doi:10.1016/j.jsbmb.2014.02.009 ISI:000341465500019.
7. Daemen S, Kutmon M, Evelo CT. A pathway approach to investigate the function and regulation of SREBPs. Genes and Nutrition. 2013; 8(3):289–300. doi:10.1007/s12263-013-0342-x
ISI:000318367600004. PMID:23516131
8. Bakillah A, El Abbouyi A. The role of microsomal triglyceride transfer protein in lipoprotein assembly: An update. Front Biosci. 2003; 8:D294–D305. ISI:000180266400036. PMID:12456294
9. Sundaram M, Yao ZM. Recent progress in understanding protein and lipid factors affecting hepatic VLDL assembly and secretion. Nutr Metab. 2010; 7. doi: Artn 35doi:10.1186/1743-7075-7-35 ISI:000278315400001.
10. Magnusson B, Asp L, Bostrom P, Ruiz M, Stillemark-Billton P, Linden D, et al. Adipocyte differentiation-related protein promotes fatty acid storage in cytosolic triglycerides and inhibits secretion of very low-density lipoproteins. Arterioscl Throm Vas. 2006; 26(7):1566–71. doi:10.1161/01.Atv.0000223345. 11820.DaISI:000243408900024.
11. Lustig RH, Greenway F, Velasquez-Mieyer P, Heimburger D, Schumacher D, Smith D, et al. A multi-center, randomized, double-blind, placebo-controlled, dose-finding trial of a long-acting formulation of octreotide in promoting weight loss in obese adults with insulin hypersecretion. Int J Obesity. 2006; 30 (2):331–41. doi:10.1038/sj.ijo.0803074ISI:000235133600021.
12. Lustig RH, Hinds PS, Ringwald-Smith K, Christensen RK, Kaste SC, Schreiber RE, et al. Octreotide therapy of pediatric hypothalamic obesity: A double-blind, placebo-controlled trial. J Clin Endocr Metab. 2003; 88(6):2586–92. doi:10.1210/jc.2002-030003ISI:000183318200032. PMID:12788859 13. Huang W, Liu R, Ou Y, Li X, Qiang O, Yu T, et al. Octreotide promotes weight loss via suppression of
intestinal MTP and apoB48 expression in diet-induced obesity rats. Nutrition. 2013; 29(10):1259–65. doi:10.1016/j.nut.2013.01.013ISI:000324784900014. PMID:23911221
14. Yu T, Liu R, Li M, Li X, Qiang O, Huang W, et al. Effects of octreotide on fatty infiltration of the pancreas in high-fat diet induced obesity rats. Wei sheng yan jiu = Journal of hygiene research. 2014; 43(2):186–
92. Epub 2014/05/30. PMID:24868966.
15. Wang CJ, Yang NH, Xu MJ, Yuan XM, Liu LG, Sun XF. Different susceptibility to high-fat diet induced obesity in rats. Acta Med Univ Sci Technol Huazhong. 2005; 34: 65–68.
16. Lui R, Sun CH, Wang SR, Yu XF, Fu RX. Study on obesity related index between DIO-R and DIO of rats. Chin J Public Health. 2003; 5:563–565.
17. Wang ZX, Chen JW, Zhou YK. An experimental study of the effects of octreotide on small intestinal mucosa in rats. Journal of Mathematical Medicine. 2002; 15(2):125–127.
18. Silva AP, Bethmann K, Raulf F, Schmid HA. Regulation of ghrelin secretion by somatostatin analogs in rats. Eur J Endocrinol. 2005; 152(6):887–94. doi:10.1530/eje.1.01914ISI:000230084200011. PMID: 15941929
19. Ding SL, Chi MM, Scull BP, Rigby R, Schwerbrock NMJ, Magness S, et al. High-Fat Diet: Bacteria Inter-actions Promote Intestinal Inflammation Which Precedes and Correlates with Obesity and Insulin Resistance in Mouse. PloS one. 2010; 5(8). doi: ARTN e12191doi:10.1371/journal.pone.0012191 ISI:000280968000017.
20. Liu R, Wei N, Guo W, Qiang O, Li X, Ou Y, et al. Octreotide alleviates obesity by reducing intestinal glu-cose absorption and inhibiting low-grade inflammation. Eur J Nutr. 2013; 52(3):1067–75. doi:10.1007/ s00394-012-0413-6ISI:000317078900021. PMID:22806765
21. Mehlem A, Hagberg CE, Muhl L, Eriksson U, Falkevall A. Imaging of neutral lipids by oil red O for ana-lyzing the metabolic status in health and disease. Nat Protoc. 2013; 8(6):1149–54. doi:10.1038/nprot. 2013.055ISI:000319673300011. PMID:23702831
22. Folch J, Lees M, Sloane Stanley GH. A simple method for the isolation and purification of total lipides from animal tissues. The Journal of biological chemistry. 1957; 226(1):497–509. Epub 1957/05/01. PMID:13428781.
23. Yue JT, Mighiu PI, Naples M, Adeli K, Lam TK. Glycine normalizes hepatic triglyceride-rich VLDL secre-tion by triggering the CNS in high-fat fed rats. Circ Res. 2012; 110(10):1345–54. Epub 2012/04/05. doi: 10.1161/CIRCRESAHA.112.268276PMID:22474253.
25. Lam TK, Gutierrez-Juarez R, Pocai A, Bhanot S, Tso P, Schwartz GJ, et al. Brain glucose metabolism controls the hepatic secretion of triglyceride-rich lipoproteins. Nat Med. 2007; 13(2):171–80. Epub 2007/02/03. doi:10.1038/nm1540PMID:17273170.
26. Rolo AP, Teodoro JS, Palmeira CM. Role of oxidative stress in the pathogenesis of nonalcoholic steato-hepatitis. Free Radical Biol Med. 2012; 52(1):59–69. Epub 2011/11/09. doi:10.1016/j.freeradbiomed. 2011.10.003PMID:22064361.
27. Figarola JL, Singhal P, Rahbar S, Gugiu BG, Awasthi S, Singhal SS. COH-SR4 reduces body weight, improves glycemic control and prevents hepatic steatosis in high fat diet-induced obese mice. PloS one. 2013; 8(12):e83801. Epub 2014/01/01. doi:10.1371/journal.pone.0083801PMID:24376752; PubMed Central PMCID: PMC3869817.
28. Moon YA, Liang GS, Xie XF, Frank-Kamenetsky M, Fitzgerald K, Koteliansky V, et al. The Scap/ SREBP Pathway Is Essential for Developing Diabetic Fatty Liver and Carbohydrate-Induced Hypertri-glyceridemia in Animals. Cell Metab. 2012; 15(2):240–6. doi:10.1016/j.cmet.2011.12.017
ISI:000300481600014. PMID:22326225
29. Li S, Brown MS, Goldstein JL. Bifurcation of insulin signaling pathway in rat liver: mTORC1 required for stimulation of lipogenesis, but not inhibition of gluconeogenesis. Proc Natl Acad Sci U S A. 2010; 107 (8):3441–6. Epub 2010/02/06. doi:10.1073/pnas.0914798107PMID:20133650; PubMed Central PMCID: PMC2840492.
30. Zambre Y, Ling Z, Chen MC, Hou X, Woon CW, Culler M, et al. Inhibition of human pancreatic islet insu-lin release by receptor-selective somatostatin analogs directed to somatostatin receptor subtype 5. Bio-chem Pharmacol. 1999; 57(10):1159–64. Epub 2001/03/07. PMID:11230804.
31. Solinas G, Boren J, Dulloo AG. De novo lipogenesis in metabolic homeostasis: More friend than foe? Mol Metab. 2015; 4(5):367–77. Epub 2015/05/15. doi:10.1016/j.molmet.2015.03.004PMID: 25973385; PubMed Central PMCID: PMC4421107.
32. Fisher EA, Ginsberg HN. Complexity in the secretory pathway: the assembly and secretion of apolipo-protein B-containing lipoapolipo-proteins. J Biol Chem. 2002; 277(20):17377–80. Epub 2002/05/15. doi:10. 1074/jbc.R100068200PMID:12006608.
33. Rutledge AC, Su Q, Adeli K. Apolipoprotein B100 biogenesis: a complex array of intracellular mecha-nisms regulating folding, stability, and lipoprotein assembly. Biochem Cell Biol = Biochimie et biologie cellulaire. 2010; 88(2):251–67. Epub 2010/05/11. doi:10.1139/o09-168PMID:20453928.
34. Olofsson SO, Stillemark-Billton P, Asp L. Intracellular assembly of VLDL: two major steps in separate cell compartments. Trends Cardiovasc Med. 2000; 10(8):338–45. Epub 2001/05/23. PMID:11369260. 35. Gordon DA, Jamil H. Progress towards understanding the role of microsomal triglyceride transfer
pro-tein in apolipopropro-tein-B lipopropro-tein assembly. Biochimi Biophys Acta. 2000; 1486(1):72–83. Epub 2000/06/17. PMID:10856714.
36. Gambino R, Cassader M, Pagano G, Durazzo M, Musso G. Polymorphism in microsomal triglyceride transfer protein: a link between liver disease and atherogenic postprandial lipid profile in NASH? Hepa-tology. 2007; 45(5):1097–107. Epub 2007/04/28. doi:10.1002/hep.21631PMID:17464986.
37. Li X, Grundy SM, Patel SB. Obesity in db and ob animals leads to impaired hepatic very low density lipoprotein secretion and differential secretion of apolipoprotein B-48 and B-100. J Lipid Res. 1997; 38 (7):1277–88. Epub 1997/07/01. PMID:9254055.
38. Chang X, Yan H, Fei J, Jiang M, Zhu H, Lu D, et al. Berberine reduces methylation of the MTTP pro-moter and alleviates fatty liver induced by a high-fat diet in rats. J Lipid Res. 2010; 51(9):2504–15. Epub 2010/06/23. doi:10.1194/jlr.M001958PMID:20567026; PubMed Central PMCID: PMC2918435. 39. Quesada H, del Bas JM, Pajuelo D, Diaz S, Fernandez-Larrea J, Pinent M, et al. Grape seed proantho-cyanidins correct dyslipidemia associated with a high-fat diet in rats and repress genes controlling lipo-genesis and VLDL assembling in liver. Int J Obes (Lond). 2009; 33(9):1007–12. Epub 2009/07/08. doi: 10.1038/ijo.2009.136PMID:19581912.
40. Higuchi N, Kato M, Tanaka M, Miyazaki M, Takao S, Kohjima M, et al. Effects of insulin resistance and hepatic lipid accumulation on hepatic mRNA expression levels of apoB, MTP and L-FABP in non-alco-holic fatty liver disease. Exp Ther Med. 2011; 2(6):1077–81. Epub 2012/09/15. doi:10.3892/etm.2011. 328PMID:22977624; PubMed Central PMCID: PMC3440820.
41. Leung GK, Veniant MM, Kim SK, Zlot CH, Raabe M, Bjorkegren J, et al. A deficiency of microsomal tri-glyceride transfer protein reduces apolipoprotein B secretion. J Biol Chem. 2000; 275(11):7515–20. Epub 2000/03/14. PMID:10713055.
42. Hussain MM, Shi J, Dreizen P. Microsomal triglyceride transfer protein and its role in apoB-lipoprotein assembly. J Lipid Res. 2003; 44(1):22–32. Epub 2003/01/09. PMID:12518019.
(3):1063–76. Epub 2006/01/24. doi:10.1128/MCB.26.3.1063-1076.2006PMID:16428458; PubMed Central PMCID: PMC1347045.
44. Gusarova V, Brodsky JL, Fisher EA. Apolipoprotein B100 exit from the endoplasmic reticulum (ER) is COPII-dependent, and its lipidation to very low density lipoprotein occurs post-ER. J Biol Chem. 2003; 278(48):48051–8. doi:10.1074/jbc.M306898200ISI:000186731400084. PMID:12960170
45. Tran K, Thorne-Tjomsland G, DeLong CJ, Cui Z, Shan J, Burton L, et al. Intracellular assembly of very low density lipoproteins containing apolipoprotein B100 in rat hepatoma McA-RH7777 cells. J Biol Chem. 2002; 277(34):31187–200. Epub 2002/06/18. doi:10.1074/jbc.M200249200PMID:12065576. 46. Kohjima M, Enjoji M, Higuchi N, Kato M, Kotoh K, Yoshimoto T, et al. Re-evaluation of fatty acid
metab-olism-related gene expression in nonalcoholic fatty liver disease. Int J Mol Med. 2007; 20(3):351–8. Epub 2007/08/03. PMID:17671740.
47. Li Y, Xu S, Mihaylova MM, Zheng B, Hou X, Jiang B, et al. AMPK phosphorylates and inhibits SREBP activity to attenuate hepatic steatosis and atherosclerosis in diet-induced insulin-resistant mice. Cell Metab. 2011; 13(4):376–88. Epub 2011/04/05. doi:10.1016/j.cmet.2011.03.009PMID:21459323; PubMed Central PMCID: PMC3086578.
48. Porstmann T, Santos CR, Griffiths B, Cully M, Wu M, Leevers S, et al. SREBP activity is regulated by mTORC1 and contributes to Akt-dependent cell growth. Cell Metab. 2008; 8(3):224–36. doi:10.1016/j. cmet.2008.07.007ISI:000258939500010. PMID:18762023