Loss of Expression of Reprimo, a p53-induced
Cell Cycle Arrest Gene, Correlates with
Invasive Stage of Tumor Progression and p73
Expression in Gastric Cancer
Kathleen Saavedra1,2,3, José Valbuena4, Wilda Olivares1,2, María José Marchant5,
Andrés Rodríguez1,2, Verónica Torres-Estay1¤, Gonzalo Carrasco-Avino6,7,
Leda Guzmán5, Francisco Aguayo8, Juan Carlos Roa1,2,4, Alejandro H. Corvalán1,2,9
*
1Advanced Center for Chronic Diseases (ACCDiS), Pontificia Universidad Católica de Chile, Santiago, Chile,2UC—Center for Investigational Oncology (CITO), Pontificia Universidad Católica de Chile, Santiago, Chile,3Scientific and Technological Bioresource Nucleus (BIOREN), Centro de Estudios Genéticos e Inmunológicos (CEGIN) and Department of Pathology, Universidad de La Frontera, Temuco, Chile,
4Department of Pathology, Pontificia Universidad Católica de Chile, Santiago, Chile,5Instituto de Química, Pontificia Universidad Católica de Valparaíso, Valparaíso, Chile,6Department of Pathology, Universidad de Chile, Santiago, Chile,7Pathology Department Icahn School of Medicine at Mount Sinai, New York, New York, United States of America,8Virology Program, Institute of Biomedical Sciences, Faculty of Medicine, Universidad de Chile, Santiago, Chile,9Department of Hematology-Oncology, Faculty of Medicine, Pontificia Universidad Católica de Chile, Santiago, Chile
¤ Current address: Department of Physiology, Faculty of Biological Sciences, Pontificia Universidad Católica de Chile, Santiago, Chile
Abstract
Reprimo (RPRM), a downstream effector of p53-induced cell cycle arrest at G2/M, has been proposed as a putative tumor suppressor gene (TSG) and as a potential biomarker for non-invasive detection of gastric cancer (GC). The aim of this study was to evaluate the epi-genetic silencing of RPRM gene by promoter methylation and its tumor suppressor function in GC cell lines. Furthermore, clinical significance of RPRM protein product and its associa-tion with p53/p73 tumor suppressor protein family was explored. Epigenetic silencing of RPRM gene by promoter methylation was evaluated in four GC cell lines. Protein expres-sion of RPRM was evaluated in 20 tumor and non-tumor matched cases. The clinical signifi-cance of RPRM association with p53/p73 tumor suppressor protein family was assessed in 114 GC cases. Tumor suppressor function was examined through functional assays. RPRM gene expression was negatively correlated with promoter methylation (Spearman rank r = -1; p = 0.042). RPRM overexpression inhibited colony formation and anchorage-in-dependent growth. In clinical samples, RPRM gene protein expression was detected in 75% (15/20) of non-tumor adjacent mucosa, but only in 25% (5/20) of gastric tumor tissues (p = 0.001). Clinicopathological correlations of loss of RPRM expression were significantly associated with invasive stage of GC (stage I to II-IV, p = 0.02) and a positive association between RPRM and p73 gene protein product expression was found (p<0.0001 and kappa value = 0.363). In conclusion, epigenetic silencing of RPRM gene by promoter methylation OPEN ACCESS
Citation:Saavedra K, Valbuena J, Olivares W, Marchant MJ, Rodríguez A, Torres-Estay V, et al. (2015) Loss of Expression of Reprimo, a p53-induced Cell Cycle Arrest Gene, Correlates with Invasive Stage of Tumor Progression and p73 Expression in Gastric Cancer. PLoS ONE 10(5): e0125834. doi:10.1371/journal.pone.0125834
Academic Editor:Mohammed Soutto, Vanderbilt University Medical Center, UNITED STATES
Received:January 16, 2015
Accepted:March 25, 2015
Published:May 8, 2015
Copyright:© 2015 Saavedra et al. This is an open access article distributed under the terms of the Creative Commons Attribution License, which permits unrestricted use, distribution, and reproduction in any medium, provided the original author and source are credited.
Data Availability Statement:All relevant data are within the paper and its Supporting Information files.
Funding:This works was supported by grants CONICYT-FONDECYT#1111014 (AHC) and CONICYT-FONDAP#15130011 (AHC and JCR) from the Government of Chile.
is associated with loss of RPRM expression. Functional assays suggest that RPRM be-haves as a TSG. Loss of expression of RPRM gene protein product is associated with the invasive stage of GC. Positive association between RPRM and p73 expression suggest that other members of the p53 gene family may participate in the regulation of RPRM expression.
Introduction
Gastric cancer (GC) is the third leading cause of cancer-related death and the fifth most com-mon malignancy worldwide [1]. Despite the decreasing incidence of GC, in part due to the rec-ognition of certain risk factors (e.g.Helicobacter pyloriand environmental factors), it remains one of the most common cancers worldwide and continues to be a clinical challenge [2,3]. Gas-tric carcinogenesis involves a gradual accumulation of genetic and epigenetic alterations, lead-ing to dysregulation in the expression of oncogenes and tumor suppressor genes (TSGs) [4]. Reprimo (RPRM) is a novel putative TSG [5,6] and associated with gastric carcinogenesis [7]. Moreover we have proposed that methylated RPRM cell-free DNA may be a potential bio-marker for the non-invasive detection of GC [8,9].
RPRM is a highly glycosylated protein localized predominantly in the cytoplasm and has been identified as a downstream effector of p53-induced cell cycle arrest at G2/M [10]. Reports suggest that RPRM expression is regulated by two mechanisms, one through DNA methylation at its promoter region [8] and the other by p53 pathway [10]. However, more recent studies have not been able to confirm these findings [6]. On the other hand, the clinical significance of RPRM has been poorly studied [11]. In the present study we evaluated the role of DNA methyl-ation in the regulmethyl-ation of RPRM expression, its clinical significance and its associmethyl-ation with members of the p53 tumor suppressor protein family (i.e. p53 and p73). We found dense meth-ylation in the RPRM promoter region, which was associated with loss of expression in GC cell lines. In clinical cases, loss of expression was associated with the invasiveness stage of GC. Fur-thermore, we observed a positive association between expression of RPRM and p73, suggesting that other members of the p53 gene family might be novel candidates for the regulation of RPRM expression.
Methods
Cell Lines and Tissue Samples
Four GC cell lines (AGS, SNU-1, KATOIII and NCI-N87) were purchased from American Type Culture Collection (ATCC) in December 2012 cultured in RPMI-1640 medium (Hyclone) and supplemented with 10% fetal bovine serum (FBS) and maintained at 37°C, 5% CO2. Twenty matched tumor and non-tumor adjacent mucosa (NTAM) samples were selected
Ética Científico, Servicio de Salud Metropolitano Central, Santiago, Chile). Written informed consent was obtained from each participant involved in the study.
Tissue microarray and Immunohistochemistry
Tissue microarrays (TMA) were done by using a Manual Tissue Array II instrument (Beecher Instruments) as previously described [14,15]. Core sections (4μm) were subjected to
immunos-taining by Vectastain Elite Kit R.T.U (Vector Labs), according to manufacturer’s instructions. Antibodies used in this study were RPRM (38–50, Sigma-Aldrich), p53 (clone 318-6-11, Dako Denmark) and p73 proteinα(clone 24, Novacastra). Results of immunostaining in whole tumor and NTAM as well as TMA sections were considered positive for RPRM if>30% of
epi-thelial cells showed cytoplasmic staining,>10% nuclear staining for p53, or>10% nuclear/
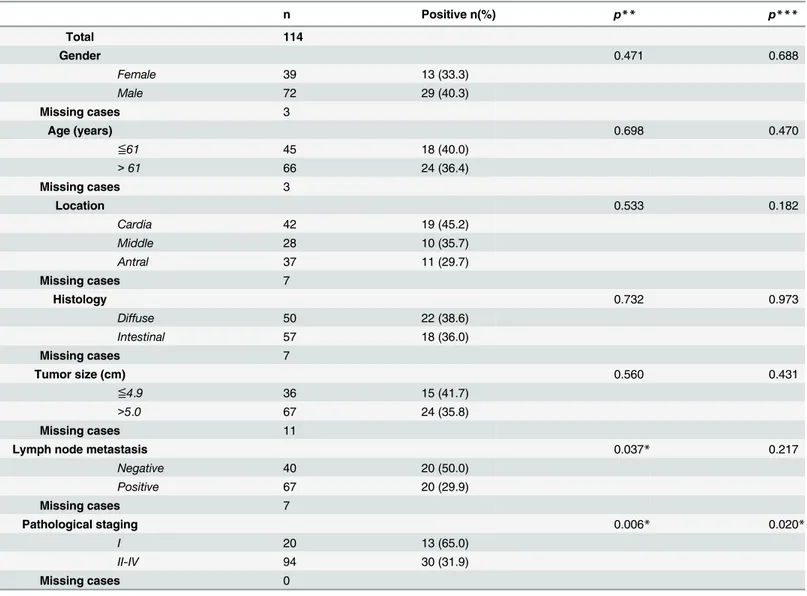
Table 1. Clinicopathological correlations of RPRM in gastric cancer.
n Positive n(%) p** p***
Total 114
Gender 0.471 0.688
Female 39 13 (33.3)
Male 72 29 (40.3)
Missing cases 3
Age (years) 0.698 0.470
≦61 45 18 (40.0)
>61 66 24 (36.4)
Missing cases 3
Location 0.533 0.182
Cardia 42 19 (45.2)
Middle 28 10 (35.7)
Antral 37 11 (29.7)
Missing cases 7
Histology 0.732 0.973
Diffuse 50 22 (38.6)
Intestinal 57 18 (36.0)
Missing cases 7
Tumor size (cm) 0.560 0.431
≦4.9 36 15 (41.7)
>5.0 67 24 (35.8)
Missing cases 11
Lymph node metastasis 0.037* 0.217
Negative 40 20 (50.0)
Positive 67 20 (29.9)
Missing cases 7
Pathological staging 0.006* 0.020*
I 20 13 (65.0)
II-IV 94 30 (31.9)
Missing cases 0
*p<0.05
**Pearson Chi-Square Test (categorical variables)
***Logistic regression (Multivariate analyses)
cytoplasmic staining for p73. Evaluation of immunohistochemical staining was performed in-dependently by two pathologists (JV & GC) who were blinded to clinical data.
Bisulfite sequencing and quantitative RT-PCR Expression Analysis
DNA from GC cell lines was extracted using TRIzol reagent (Life Technologies) according man-ufacturer’s protocol, followed by bisulfite conversion using the EZ DNA methylation Gold kit (Zymo Research). RPRM promoter was amplified from bisulfite-treated DNA, using primers
RPRM_B_FW 5’-TTGTAAAAGTAAGTAATAAAAAGTAAG-3’and RPRM_B_RV 5’-CTAC
TATTAACCAAAAACAAAC-3’, allowing the detection of 52 CpG sites within a 509-bp pro-moter region. PCR products were purified with QIAXEN II gel extraction kit (QIAGEN) and ligated into pGEM-T vector. The ligation product was used to transform competentE.coli
Top10 cells, according to the procedure described by Inoue et al. [16]. The transformants were selected on LB agar plates supplemented with ampicillin (100μg/mL), X-Gal (50 mg/mL) and
IPTG (100 mM). The resulting white colonies were assessed by colony-PCR. Positive clones were grown on liquid medium (LB/ampicillin) until late exponential phase (OD600 = 1) and DNA plasmids were purified using Pure Yield miniprep system kit (Promega). The RPRM pro-moter region was sequenced using universal M13 (W 5’-GTAAAACGACGGCCAG-3’and RV 5’-CAGGAAACAGCTATGAC-3’) by Macrogen (http://dna.macrogen.com). BiQ analyzer soft-ware was used for the analysis of sequenced clones. All positive pGEM-T clones were grown on LB/ampicillin medium and stored at -80°C (in 14% glycerol). Total RNA was extracted using TRIzol reagent (Invitrogen) and cDNA was synthesized using iScript cDNA Synthesis kit ac-cording to the manufacturer’s instructions (Biorad). Subsequently, cDNA was used for each PC R reaction with each primer pair. The RPRM specific primers are: RPRM_FW 5’-GAGC
GTAGCCTGTACATAATGC-3’and RPRM_RV 5’-CCTTCACGAGGAAGTTGATCAT-3’.
Real time RT–PCR analysis was performed using LightCycler Fast Start DNA MasterPlus SYBR Green I (Roche) in a LightCycler 1.5 Real-Time Detection System (Roche). Relative quantitative analysis normalized to RPL-30 was conducted via the comparative cycle threshold method [17]. The RPL-30 specific primers are: RPL-30_Fw 5’-ACAGCATGCGGAAAATACTAC-3’and
RPL30_RV 5’-AAAGGAAAATTTTGCAGGTTT-3’.
Validation of RPRM antibody by Immunoblot and Immunofluorescence
3x10⁵AGS cells were transiently transfected with pCMV6/RPRM or pCMV6 (Origene) empty
vector, using Lipofectamine 2000 (Invitrogen), according to manufacturer’s protocol. Forty-eight hours after transfection, cells were incubated for 24 h in RPMI1640 with 10% FBS in the presence or absence of N-glycosylation inhibitor Tunicamicyn (10 ng/mL). Cells were harvested and whole-cell lysates were extracted using Triton buffer (Tris-HCl 50mM pH7.5, NaCl 0.1M, 0.5% Triton X-100) with Protease Inhibitor Cocktail Kit (P8340, Sigma Aldrich) and Phospha-tase Inhibitor Cocktail Kit (sc-45045, Santa Cruz Biotechnology). Protein concentrations were determined using Quick Start Bradford Reagent (Bio-Rad). Fiftyμg of protein were separated on
cellular location of RPRM, immunofluorescence assay was performed. AGS cells transiently transfected with pCMV6-RPRM or pCMV6 were grown on coverslips. The transiently trans-fected AGS cells were fixed in 4% paraformaldehyde for 20 min at room temperature and then washed three times in Phosphate-buffered saline (PBS). Cells were permeabilized in 0.1% Tri-ton-X-100 (Sigma–Aldrich) for 10 min, blocked in 3% BSA for 1 h at room temperature, and subsequently labeled with an anti-RPRM antibody (1:1000, 38–50, Sigma-Aldrich). After wash-ing with PBS, cells were incubated with an Alexa Fluor 488-conjugated antibody (1:200, Molecu-lar Probes, Invitrogene) for 1 h at room temperature. Images were acquired by fluorescence laser scanning confocal microscopy (see Supporting InformationS1andS2Figs).
Cell culture and transfection
For stable transfection experiments, AGS cells were plated at 3x10⁵cells/100-mm culture dish and transfected after 24 h with pCMV6-RPRM or pCMV6 (Origene) empty vector using Lipo-fectamine 2000 (Invitrogen), according to the manufacturer’s protocol. Forty-eight hours after transfection, cells were cultured under the same conditions with G418 (500g/mL). Culture media was changed every 24 h for 14 days.
Colony formation assay
For colony formation assay, 200 cells were stably transfected with pCMV6-RPRM or pCMV6 empty vector. Cells were cultured in RPMI-1640 medium (Hyclone) and supplemented with 10% FBS. Culture media was changed every 24 h. Colonies were stained using 0.4% crystal vio-let (Sigma) in 50% methanol, 21 days after initial seeding, and counted at 20 images taken under inverted microscope (Evos XL Core Cell imaging System, Life Technologies). Each transfection was carried out in triplicate. In addition, replicate experiments were carried out to obtain further clones for expression analysis.
Anchorage-independent growth assay
Anchorage-independent cell growth was analyzed by plating 1% agarose containing 2x10⁵cells
stable transfected with pCMV6-RPRM or pCMV6 empty vector in 6-well plates. Cells were fed weekly by overlying fresh soft-agar solution, and colonies were photographed after 4 weeks of incubation. The experiment was carried out in triplicate.
Statistical Analysis
Spearman correlation coefficient was calculated to analyze the correlation between RPRM methylation and gene expression levels. Categorical variables were analyzed by Pearson Chi-Square Test (two-sided), the p-value was corrected using a logistic regression analysis. Contin-uous variables were analyzed using Student’sttest and data was expressed as mean ± SD. Kappa test was used to analyze the correlation between the RPRM expression and p73 expres-sion. Statistical analyses were performed using SPSS version 17.0 (SPSS Inc., Chicago, IL) statis-tical package and GraphPad Prism5 software (La Jolla, CA, United States). All of the values were two-tailed, except for Spearman rank correlation. Statistical significance was defined as p<0.05.
Results
RPRM methylation and expression in gastric cancer cell lines
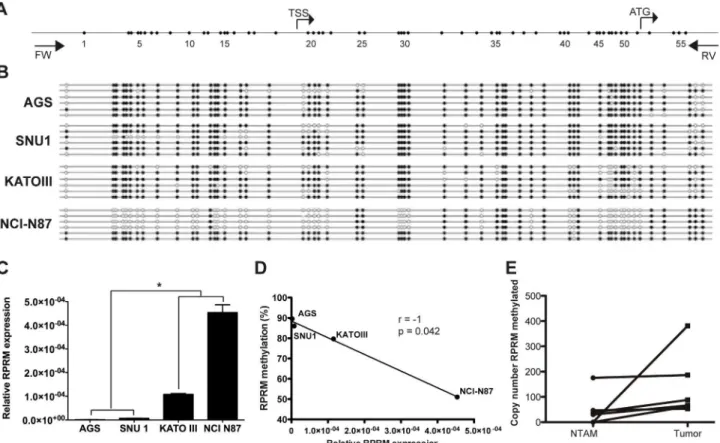
However RPRM methylation has been weakly correlated with its expression [18]. To further assess the association between RPRM promoter methylation and gene expression, the complete promoter region of RPRM gene was analyzed by DNA bisulfite sequencing in four GC cell lines (AGS, SNU-1, KATO III and NCI-N87) (Fig 1A). Thus, the methylation status of 52 CpG sites, located between -207 and +302 nucleotides relative to the transcription start site (TSS), were analyzed. This analysis shows dense methylation in cell lines AGS and SNU-1 (89.6% and 86%, respectively), in comparison to KATO III and NCI-N87 (79.7% and 51.8%, respectively) (p = 0.0002) (Fig 1B). Next, level of RPRM expression was determined by quantitative RT-PCR. Low RPRM gene expression was observed in AGS and SNU-1 compared to KATO III and NCI-N87 cell lines (p<0.0001) (Fig 1C). By Spearman’s correlation analysis revealed
significant negative correlation was found between methylation density and RPRM gene ex-pression (r = -1; p = 0.042) (Fig 1D). Taken together, these findings suggest that methylation of RPRM promoter region plays a critical role in the regulation of RPRM expression.
RPRM methylation and expression in gastric cancer tissues
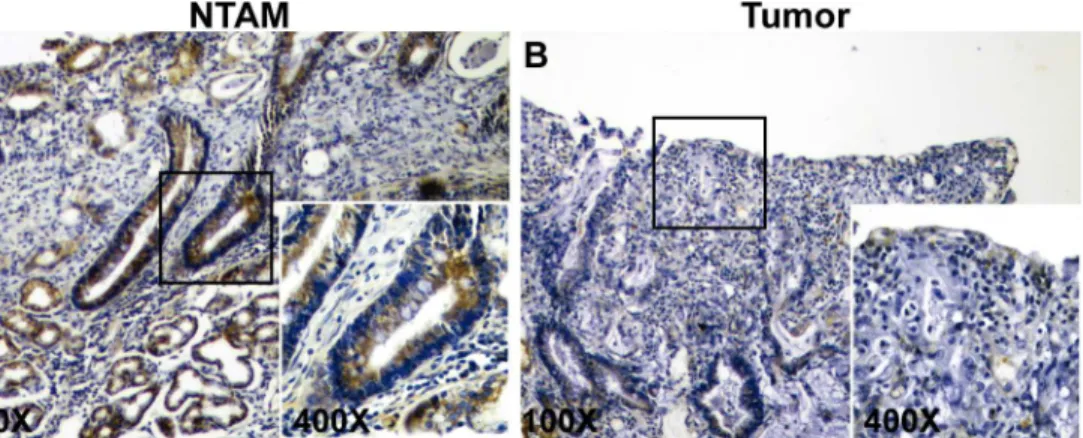
To corroborate previous data in GC tissues, RPRM methylation levels were determined in 6 paired tumor and NTAM samples. Results indicate higher methylation levels in tumor tissues compared to NTAM tissues (SeeFig 1E). To investigate the expression of RPRM gene protein product in GC tissues IHC analysis was performed. Positive RPRM expression was mainly ob-served in the cytoplasm of gastric epithelial cells. RPRM gene protein expression was detected in
Fig 1. Regulation of RPRM expression by methylation of its promoter region.A) RPRM promoter region analyzed by bisulfite quantification. B) DNA Bisulfite sequencing in gastric cancer cell lines. C) Relative expression of RPRM in four gastric cancer cell lines ns: no significative;*p<0.01; ANOVA test One-way. D) Spearman rank correlation between RPRM expression and promoter methylation status of RPRM. E) RPRM methylation in tumor and non-tumor adjacent mucosa (NTAM) tissues, higher methylation levels in non-tumor tissues are observed in comparison to NTAM in all six paired GC cases.
75% (15/20) of NTAM tissues samples. However only 25% (5/20) of tumor samples showed ex-pression of RPRM gene protein product (Fig 2). These differences were highly significant (p = 0.001) and suggest that expression of RPRM is lost in GC tissues. To evaluate the clinical sig-nificance of this loss of RPRM expression a cohort of 114 GC cases was evaluated. Loss of RPRM expression was found in 62% (71/114) of GC cases. Clinicopathological correlations of RPRM ex-pression are shown inTable 1. Progression from stage I GC to stages II-IV (p = 0.006) and lymph node metastasis (p = 0.037) were significantly associated with loss of expression of RPRM gene protein product. However, logistic regression analysis shows that only progression from stage I to II-IV is significantly associated with loss of RPRM gene protein product (p = 0.020).
Functional assay of RPRM in gastric cancer (colony formation and
anchorage-independent growth)
As the loss of RPRM expression was associated in GC and mainly with the progression from stage I to II-IV, a tumor suppressor role of RPRM might be plausible. Therefore, functional as-says such asin vitrocolony formation and anchorage-independent growth assays were per-formed in AGS cell transfected with pCMV6/RPRM (Fig 3A). Non-expressing AGS cell lines transfected with RPRM expression plasmids showed a significantly reduced number of colonies in comparison to pCMV6- empty vector-transfected cell lines transfected with pCMV6-empty vector (p<0.05) (Fig 3B). The effect of RPRM overexpression on anchorage-independent
growth in a soft agar colony formation assay was also assessed in stable transfected AGS cell line clones. Colonies were counted after initial seeding and incubation in soft agar for 4 weeks. Cells transfected with empty vector showed robust colony growth, by number and size of colo-nies. This was greatly reduced when RPRM was re-expressed in AGS cells (Fig 3C).
Association of RPRM expression and p53/p73 tumor suppressor protein
family in gastric cancer
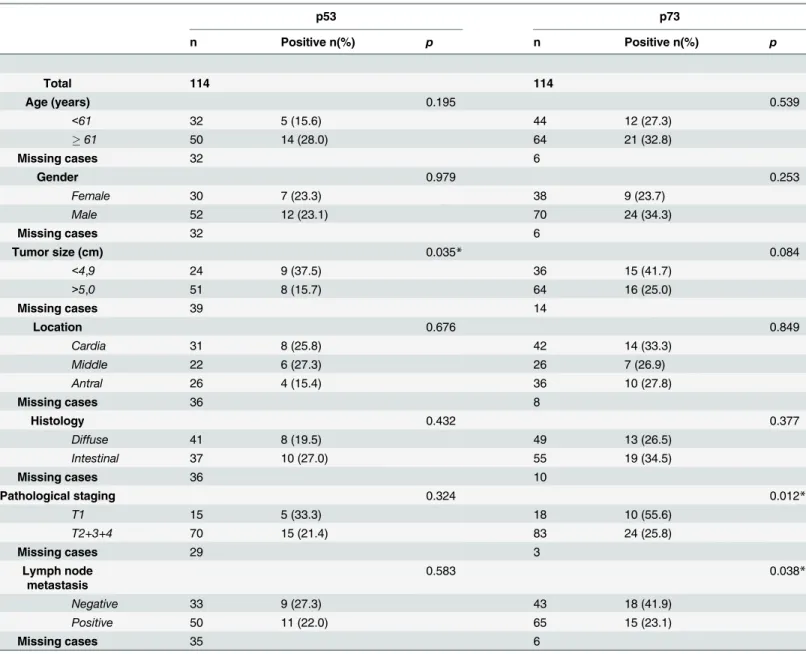
RPRM has been defined as a p53-mediated gene in embryonic fibroblast cells [18]. However, it has been reported that regulation of RPRM expression might be independent from p53 gene status in neuronal cells treated with copper [19]. On the other hand p73 can activate the tran-scription of p53-responsive genes [20]. Considering this setting, we evaluated the expression of p53 and other member of the p53 protein family, p73 TSG. Expression of p53 was located in the nuclei of gastric mucosa cells. Positive p53 expression was detected in 23.5% (20/114) of
Fig 2. Immunohistochemical staining for RPRM in gastric cancer.A) Representative example of non-tumor adjacent mucosa (NTAM) showing positive cytoplasmic staining of RPRM in more than 30% of cells. B) Representative example of tumor (T) gastric cancer sample showing negative staining of RPRM.
GC cases. Only tumor size was associated with the expression of p53 (p = 0.035, seeTable 2). Expression of p73 was located in the cell nuclei and cytoplasm of epithelial cells. Positive p73 expression was found in 30.6% (34/114) of GC samples. Interestingly, significant clinicopatho-logical correlations of p73 expression were associated with invasive stage (stage I 55.6%; 10/18 to stages II-IV 25.8%; 24/93, p = 0.012) and lymph node metastasis (p = 0.038) (Table 2). Since losses of expression of RPRM and p73 gene protein products have similar clinicopathological correlations, we evaluated association between expressions of levels of both proteins. To this end cases were separated into four groups according to the expression of RPRM and p73 pro-tein products. The analysis showed that 22 out 111 GC cases were positive for both RPRM and p73 proteins, whereas 57 out 111 were negative. This association was statistically significant (p<0.0001) with a kappa value of 0.363 (Table 3).
Discussion
RPRM is a highly glycosylated cytoplasmic protein, initially identified as a downstream effector of p53-induced cell cycle arrest at G2/M. Previously, it has been proposed that RPRM is si-lenced by promoter methylation, although it has been weakly correlated with its expression [5,8]. In addition, RPRM has been proposed as a putative tumor suppressor gene in renal cell carcinoma and pituitary tumors [5,6]. In this study, we demonstrated that RPRM gene expres-sion is strongly associated with its promoter region methylation status, suggesting epigenetic si-lencing of RPRM gene expression. In addition, we show that RPRM gene protein product was decreased in GC tissue compared with noncancerous gastric mucosa. These results are similar to that of Luoet al. [11], who reported loss of RPRM in GC when compared to gastric ulcer tis-sue samples. Furthermore, our finding regarding loss of expression of RPRM in the transition from stage I to stages II-IV is clinically relevant. Luoet al. [11] reported a similar finding, but in a small number of stage I GC cases (n = 15). These findings may have clinical significance as a predictive factor for the progression of GC. Accordingly with this loss of RPRM expression in the progression of GC, our functional assays (colony formation and anchorage-independent growth) also proposed a putative tumor suppressor role for RPRM in GC.
Although p53 was initially described as a RPRM inductor [10], clinical studies performed up to date have not been able to confirm such finding [6,18]. Here, we identified that loss of RPRM expression correlates with loss of expression of another member of p53 family, p73. Al-though p73 TSG is expressed at a very low level in normal human tissues [21], is overexpressed in many different human cancers such as breast, neuroblastoma, lung, esophagus, stomach, colon, bladder and ovary [14,22]. In addition, it has been reported that p73 can activate the transcription of p53-responsive genes, including p21Waf1/Cip1, bax, mdm2, cyclin-G,
Fig 3. Overexpression of RPRM reduces colony formation and anchorage-independent growthin vitro.A) Western blot of AGS cells with overexpression of RPRM (pCMV6/RPRM) and empty control (pCMV6). B) Overexpression of RPRM in AGS cells (pCMV6/RPRM) resulted in a significant reduction ofin vitrocolony formation compared with AGS cell line transfected with pCMV6 empty vector (pCMV6). Each experiment was carried out in triplicate. There was a statistically significant reduction of colony formation in overexpression experiments (*p<0.05). Below each graph are representative plates showing reduction of colonies after gene overexpression Error bars; SD. C) Overexpression of RPRM in AGS cells (pCMV6/ RPRM) resulted in a significant reduction ofin vitroanchorage-independent colony formation compared with AGS cell line transfected with pCMV6 empty vector (pCMV6). Each experiment was carried out in triplicate. There was a statistically significant reduction of colonies formation in the overexpression experiments (*p<0.05). Below each graph are representative plates showing reduction of colonies after gene overexpression Error bars; SD
Table 2. Clinicopathological correlations of p53/p73 tumor suppressor protein family in gastric cancer.
p53 p73
n Positive n(%) p n Positive n(%) p
Total 114 114
Age (years) 0.195 0.539
<61 32 5 (15.6) 44 12 (27.3)
61 50 14 (28.0) 64 21 (32.8)
Missing cases 32 6
Gender 0.979 0.253
Female 30 7 (23.3) 38 9 (23.7)
Male 52 12 (23.1) 70 24 (34.3)
Missing cases 32 6
Tumor size (cm) 0.035* 0.084
<4,9 24 9 (37.5) 36 15 (41.7)
>5,0 51 8 (15.7) 64 16 (25.0)
Missing cases 39 14
Location 0.676 0.849
Cardia 31 8 (25.8) 42 14 (33.3)
Middle 22 6 (27.3) 26 7 (26.9)
Antral 26 4 (15.4) 36 10 (27.8)
Missing cases 36 8
Histology 0.432 0.377
Diffuse 41 8 (19.5) 49 13 (26.5)
Intestinal 37 10 (27.0) 55 19 (34.5)
Missing cases 36 10
Pathological staging 0.324 0.012*
T1 15 5 (33.3) 18 10 (55.6)
T2+3+4 70 15 (21.4) 83 24 (25.8)
Missing cases 29 3
Lymph node metastasis
0.583 0.038*
Negative 33 9 (27.3) 43 18 (41.9)
Positive 50 11 (22.0) 65 15 (23.1)
Missing cases 35 6
*p<0.05, Pearson Chi-Square Test (categorical variables)
doi:10.1371/journal.pone.0125834.t002
Table 3. Kappa value for RPRM and p73 expression in gastric cancer.
RPRM Value p Kappa
Positive Negative
p73 Positive 22 (64.7%) 12 (35.3%) 15.043 <0.0001 0.363
Negative 20 (26.0%) 57 (74.0%)
*p<0.05, x2test and Kappa correlation
GADD45 and IGFBP3 [20]. Thus, based on our findings, we propose that RPRM expression could be regulated by p73 in a p53-independent manner.
In summary, our data suggest that epigenetic silencing of RPRM gene by promoter methyla-tion is associated with loss of RPRM expression and accordingly, funcmethyla-tional assays proposed a putative tumor suppressor role of RPRM in GC. In clinical samples, RPRM is lost at invasive stages of GC and its expression correlates with that of p73 suggesting that other members of the p53 gene family may participate in the regulation of RPRM expression. Further research is warranted to characterize the role of RPRM in the progression of GC and validate the biologi-cal regulation of RPRM by p73.
Supporting Information
S1 Data. Data underlying the study.
(ZIP)
S1 Fig. Effects of Tunicamicyn on RPRM protein.RPRM is a highly glycosylated cytoplasmic protein visualized to 25 kD by Western blot, the glycosylation inhibitor tunicamycin (TK) dis-places the 25 kD RPRM band to 15 kD in AGS cells with RPRM overexpression (pCMV6/ RPRM) (RPRM predicted size 12 kD). Cells were incubated for 24 h in RPMI1640 with 10% FBS in the presence or absence of the inhibitor of N-glycosylation tunicamicyn (10 ng/mL). RPRM expression was determined by Western blotting using a RPRM polyclonal antibody (upper panel, dilution 1:1000, Sigma-Aldrich). The expression ofβ-actin (lower panel, dilution 1:2000, Santa Cruz) represents protein loading.
(TIF)
S2 Fig. Localization of RPRM expression in overexpressing AGS cell line Immunofluores-cence of RPRM in gastric cancer AGS cell line transfected with pCMV6 vector encoding RPRM.24 h post-transfection cells were fixed in paraformaldehyde 4% and incubated with anti-RPRM-rabbit (1:1000, 38–50, Sigma-Aldrich) and secondary antibody Alexa Fluor-488 (1:200, Molecular Probes, Invitrogene). A positive expression of RPRM (GREEN) is mainly seen in the cytoplasm. Images were captured at using Axio Vision4 multichannel software in fluorescence microscope Axio Scope.A1- Zeiss.
(TIF)
S3 Fig. RPRM expression is silenced by promoter methylation.A) RT-PCR analysis of RPRM mRNA expression in AGS gastric cancer cell line with and without the DNA methyla-tion inhibitor 5-Azacytidine (1 uM for 72 hrs). GAPDH was used as a control. B) Amplificamethyla-tion of RPRM by Methylation Specific PCR in AGS gastric cancer cell line. Amplification of methyl-ated MYOD1 was used as control. AGS cell line was methylmethyl-ated in the promoter region. NC: negative control.
(TIF)
S4 Fig. RPRM expression is silenced by promoter methylation (original gel).A) RT-PCR analysis of RPRM mRNA expression in AGS gastric cancer cell line with and without the DNA methylation inhibitor 5-Azacytidine (1 uM for 72 hrs). GAPDH was used as a control. B) Am-plification of RPRM by Methylation Specific PCR in AGS gastric cancer cell line. AmAm-plification of methylated MYOD1 was used as control. AGS cell line was methylated in the promoter re-gion. NC: negative control.
Acknowledgments
We would like to thank Sabina Magedson for her contribution in building Tissue Microarrays. We would also like to thank Hiroshi Kawachi for histological review of cases, Ignacio Wich-mann for their valuable comments on our manuscript and Oslando Padilla for his important support in statistical analysis.
Author Contributions
Conceived and designed the experiments: KS MJM WO AR VTE GCA AHC. Performed the experiments: KS JV MJM WO AR VTE GCA. Analyzed the data: KS JV MJM WO AR VTE GCA LG FA JCR AHC. Contributed reagents/materials/analysis tools: KS JV MJM GCA LG AHC. Wrote the paper: KS JV MJM WO VTE GCA LG FA JCR AHC.
References
1. Forman D, Bray F, Brewster DH, Gombe-Mbalawa C, Kohler B, Piñeros M, et al. Cancer Incidence in Five Continents, Vol. X IARC. 2013: Available:http://globocan.iarc.fr.
2. Pasechnikov V, Chukov S, Fedorov E, Kikuste I, Leja M. Gastric cancer: prevention, screening and early diagnosis. World J Gastroenterol. 2014; 20: 13842–13862. doi:10.3748/wjg.v20.i38.13842 PMID:25320521
3. McLean MH, El-Omar EM. Genetics of gastric cancer. Nat Rev Gastroenterol Hepatol. 2014; 11: 664– 674. doi:10.1038/nrgastro.2014.143PMID:25134511
4. Bass AJ. Comprehensive molecular characterization of gastric adenocarcinoma. Nature. 2014; 513: 202–209. doi:10.1038/nature13480PMID:25079317
5. Morris MR, Ricketts C, Gentle D, Abdulrahman M, Clarke N, Brown M, et al. Identification of candidate tumour suppressor genes frequently methylated in renal cell carcinoma. Oncogene. 2010; 29: 2104– 2117. doi:10.1038/onc.2009.493PMID:20154727
6. Xu M, Knox AJ, Michaelis KA, Kiseljak-Vassiliades K, Kleinschmidt-DeMasters BK, Lillehei KO, et al. Reprimo (RPRM) is a novel tumor suppressor in pituitary tumors and regulates survival, proliferation, and tumorigenicity. Endocrinology. 2012; 153: 2963–2973. doi:10.1210/en.2011-2021PMID: 22562171
7. Schneider BG, Peng DF, Camargo MC, Piazuelo MB, Sicinschi LA, Mera R, et al. Promoter DNA hyper-methylation in gastric biopsies from subjects at high and low risk for gastric cancer. Int J Cancer. 2010; 127: 2588–2597. doi:10.1002/ijc.25274PMID:20178103
8. Bernal C, Aguayo F, Villarroel C, Vargas M, Diaz I, Ossandon FJ, et al. Reprimo as a potential biomark-er for early detection in gastric cancbiomark-er. Clin Cancbiomark-er Res. 2008; 14: 6264–6269. doi: 10.1158/1078-0432.CCR-07-4522PMID:18829507
9. Sapari NS, Loh M, Vaithilingam A, Soong R. Clinical potential of DNA methylation in gastric cancer: a meta-analysis. PLoS One. 2012; 7: e36275. doi:10.1371/journal.pone.0036275PMID:22558417
10. Ohki R, Nemoto J, Murasawa H, Oda E, Inazawa J, Tanaka N, et al. Reprimo, a new candidate media-tor of the p53-mediated cell cycle arrest at the G2 phase. J Biol Chem. 2000; 275: 22627–22630. PMID:10930422
11. Luo J, Zhu Y, Yang G, Gong L, Wang B, Liu H. Loss of Reprimo and S100A2 expression in human gas-tric adenocarcinoma. Diagn Cytopathol. 2010.
12. Japanese Gastric Cancer A. Japanese classification of gastric carcinoma: 3rd English edition. Gastric Cancer. 2011; 14: 101–112. doi:10.1007/s10120-011-0041-5PMID:21573743
13. Llorens P. Gastric cancer mass survey in Chile. Semin Surg Oncol. 1991; 7: 339–343. PMID:1759081
14. Carrasco G, Diaz J, Valbuena JR, Ibanez P, Rodriguez P, Araya G, et al. Overexpression of p73 as a tissue marker for high-risk gastritis. Clin Cancer Res. 2010; 16: 3253–3259. doi:10.1158/1078-0432. CCR-09-2491PMID:20530692
15. Bernal C, Vargas M, Ossandon F, Santibanez E, Urrutia J, Luengo V, et al. DNA methylation profile in diffuse type gastric cancer: evidence for hypermethylation of the BRCA1 promoter region in early-onset gastric carcinogenesis. Biol Res. 2008; 41: 303–315. PMID:19399343
16. Inoue H, Nojima H, Okayama H. High efficiency transformation of Escherichia coli with plasmids. Gene. 1990; 96: 23–28. PMID:2265755
18. Ooki A, Yamashita K, Yamaguchi K, Mondal A, Nishimiya H, Watanabe M. DNA damage-inducible gene, Reprimo functions as a tumor-suppressor and is suppressed by promoter methylation in gastric cancer. Mol Cancer Res. 2013; 11: 1362–1374. doi:10.1158/1541-7786.MCR-13-0091PMID: 23982217
19. Vanlandingham JW, Tassabehji NM, Somers RC, Levenson CW. Expression profiling of p53-target genes in copper-mediated neuronal apoptosis. Neuromolecular Med. 2005; 7: 311–324. PMID: 16391388
20. Pflaum J, Schlosser S, Muller M. p53 Family and Cellular Stress Responses in Cancer. Front Oncol. 2014; 4: 285. doi:10.3389/fonc.2014.00285PMID:25374842
21. Kovalev S, Marchenko N, Swendeman S, LaQuaglia M, Moll UM. Expression level, allelic origin, and mutation analysis of the p73 gene in neuroblastoma tumors and cell lines. Cell Growth Differ. 1998; 9: 897–903. PMID:9831242