Geobacillus stearothermophilus
as Measured by Raman
Spectroscopy and Differential Interference Contrast
Microscopy
Tingting Zhou1,3, Zhiyang Dong1, Peter Setlow2, Yong-qing Li3*
1Institute of Microbiology, Chinese Academy of Sciences, Beijing, China,2Department of Molecular, Microbial and Structural Biology, University of Connecticut Health Center, Farmington, Connecticut, United States of America,3Department of Physics, East Carolina University, Greenville, North Carolina, United States of America
Abstract
Geobacillus stearothermophilusis a gram-positive, thermophilic bacterium, spores of which are very heat resistant. Raman spectroscopy and differential interference contrast microscopy were used to monitor the kinetics of germination of
individual spores ofG. stearothermophilusat different temperatures, and major conclusions from this work were as follows.
1) The CaDPA level of individualG. stearothermophilusspores was similar to that ofBacillusspores. However, the Raman
spectra of protein amide bands suggested there are differences in protein structure in spores ofG. stearothermophilusand
Bacillusspecies. 2) During nutrient germination ofG. stearothermophilusspores, CaDPA was released beginning after a lag time (Tlag) between addition of nutrient germinants and initiation of CaDPA release. CaDPA release was complete atTrelease,
and DTrelease (Trelease – Tlag) was 1–2 min. 3) Activation by heat or sodium nitrite was essential for efficient nutrient
germination of G. stearothermophilus spores, primarily by decreasing Tlag values. 4) Values of Tlag and Trelease were
heterogeneous among individual spores, butDTreleasevalues were relatively constant. 5) Temperature had major effects on
nutrient germination of G. stearothermophilus spores, as at temperatures below 65uC, average Tlag values increased
significantly. 6)G. stearothermophilusspore germination with exogenous CaDPA or dodecylamine was fastest at 65uC, with
longer Tlagvalues at lower temperatures. 7) Decoating ofG. stearothermophilusspores slowed nutrient germination slightly
and CaDPA germination significantly, but increased dodecylamine germination markedly. These results indicate that the
dynamics and heterogeneity of the germination of individualG. stearothermophilusspores are generally similar to that of
Bacillusspecies.
Citation:Zhou T, Dong Z, Setlow P, Li Y-q (2013) Kinetics of Germination of Individual Spores ofGeobacillus stearothermophilusas Measured by Raman Spectroscopy and Differential Interference Contrast Microscopy. PLoS ONE 8(9): e74987. doi:10.1371/journal.pone.0074987
Editor:Adam Driks, Loyola University Medical Center, United States of America ReceivedJune 21, 2013;AcceptedAugust 7, 2013;PublishedSeptember 13, 2013
Copyright:ß2013 Zhou et al. This is an open-access article distributed under the terms of the Creative Commons Attribution License, which permits unrestricted use, distribution, and reproduction in any medium, provided the original author and source are credited.
Funding:Authors PS and YL acknowledge support by a Department of Defense Multi-disciplinary University Research Initiative through the U.S. Army Research Laboratory and the U.S. Army Research Office under contract number W911F-09-1-0286. Authors TZ and ZD also acknowledge support by a grant from the National Natural Science Foundation of China (No. 31228001) and a grant from the National High Technology Research and Development Program of China (No. 2012AA092103). The funders had no role in study design, data collection and analysis, decision to publish, or preparation of the manuscript.
Competing Interests:The authors have declared that no competing interests exist. * E-mail: [email protected]
Introduction
Many components of the spore germination machinery are conserved between spore forming members of the Bacillales[1]. Bacillus subtilisspore germination can be initiated by a variety of chemicals, including nutrients, cationic surfactants, and enzymes, as well as by hydrostatic pressure [2]. Nutrient germinants for spore germination generally include amino acids, purine deriva-tives, and sugars, and are species and strain specific. These nutrient germinants interact with germination receptors (GRs) located in the inner spore membrane [2], stimulating the release of the spore core’s large (,10% of spore dry wt) depot of pyridine-2,6-dicarboxylic acid (dipicolinic acid [DPA]) and divalent cations, predominantly Ca2+
, which are likely present as a 1:1 chelate (CaDPA) [3]. CaDPA in the core is released and replaced by water in stage I of spore germination, and CaDPA release then triggers stage II of germination, a major event which is the hydrolysis of spores’ peptidoglycan cortex by cortex lytic enzymes (CLEs) [2,4].
Concomitant with cortex hydrolysis, the core’s full rehydration ultimately leads to resumption of enzyme activity, and initiation of metabolism and macromolecular synthesis in the core, and thus spore outgrowth [2,5].
B. subtilisspores contain three major GRs, termed GerA, GerB and GerK, each of which contains A, B and C subunits all of which are required for GR function [2]. These GRs are encoded by three tricistronic operons, each of which appears to encode a single GR [1,2]. The GerD protein is also essential for proper GR function, and the proteins encoded by the spoVA operon are essential for DPA uptake in sporulation and probably CaDPA release during germination as well [1,6,7].Geobacillus stearothermo-philus is a Gram-positive spore-forming thermophile. Genomic analysis suggests thatG. stearothermophilushas clear homologs of the B. subtilisGR genes as well asgerDandspoVAB, C, Dgenes, and genes encoding the cortex lytic enzymes CwlJ and SleB [1,8].
types of foodstuffs [9–12]. These spores are also commonly used as a biological indicator to evaluate the effectiveness of sterilization processes, in particular wet heat. However, the germination of spores ofG. stearothermophilusspecies is much less well studied than that of spores ofBacillusspecies. Limited studies have shown that G. stearothermophilus spores germinate in response to low mol wt nutrient germinants including amino acids, purine and pyrimidine nucleosides, and sugars. However, the kinetics of the germination of individual G. stearothermophilus spores and the heterogeneity among individual spores in a population has not been studied.
In this study, we investigated the nutrient and non-nutrient germination of multiple individual intact and decoated G. stearothermophilusspores at various temperatures. We also measured the CaDPA level and Raman spectra of individualG. stearothermo-philusspores and compared these with those of spores of several Bacillusspecies, as well as effects of different activation methods on kinetics of germination of individual G. stearothermophilus spores. This work has provided new information on the dynamics of and the heterogeneity in the germination ofG. stearothermophilusspores.
Materials and Methods
Bacterial Species Used and Spore Preparation
Spores of G. stearothermophilus NGB101 were prepared and purified as described previously [13]. TheBacillusspecies used in this work were Bacillus subtilis PS533 [14] and Bacillus cereus T (originally obtained from H.O. Halvorson). Spores of these species were prepared and stored as described [15,16]. All spores used in this work were free (.98%) of growing or sporulating cells, as determined by phase contrast microscopy.
Measurement of CaDPA Level and Raman Spectra of Individual Spores by Laser Tweezers Raman
Spectroscopy
The CaDPA levels of individual spores of various species were determined by laser tweezers Raman spectroscopy at 25uC [17]. Briefly, an individual spore was captured with laser tweezers, and its Raman spectrum was acquired with an integration of 20 s and a laser power of 20 mW at 780 nm. Spectra of 30 individual spores were measured and averaged. The CaDPA level in an individual spore was determined from the peak intensity at 1,017 cm21
in its Raman spectrum relative to the peak intensity of the same Raman band from a CaDPA solution of known concentration (50 mM) and by multiplying this concentration value by the excitation volume of 1 fl to obtain attomoles of CaDPA/spore [17]. Raman spectra of 30 individual spores ofG. stearothermophilus,B. subtilis andB. cereusat 25, 65, and 95uC were also averaged for analysis of heat-induced changes in spores’ molecular components.
Activation ofG. stearothermophilusSpores
Unless noted otherwise, prior to germination experiments, G. stearothermophilusspores were activated by one of three methods: 1) incubation in water at 100uC for 30 min followed by cooling in ice water for 15 min; 2) incubation in water at 30uC for 120 h; or 3) incubation in 0.2 M sodium nitrite (pH 8.0) at 30uC for 17 h. Germination of unactivated G. stearothermophilus spores was also carried out in a few experiments.
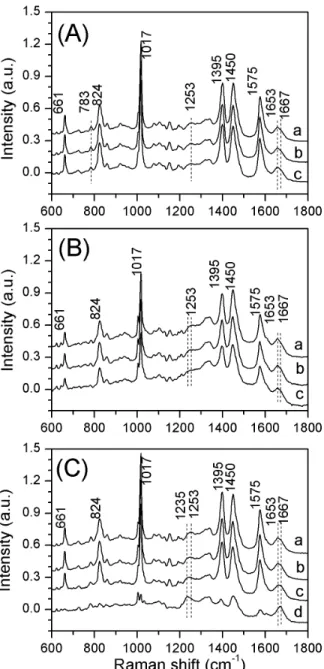
Figure 1. Raman spectra of individual spores. Raman spectra of individualG. stearothermophilus(A),B. subtilis(B), andB. cereus
spores (C), measured at 25uC (curve a), 65uC (curve b) and 95uC (curve c), respectively.Curve d in Fig. 1(C) is the Raman spectrum of singleB. cereusspores that had lost their CaDPA at 95uC. All the spectra were averages from 30 individual spores determined as described in Methods. The dotted lines are the protein bands of amide I (1653/ 1667 cm21) and amide III (1253 cm21), respectively.
doi:10.1371/journal.pone.0074987.g001
Table 1.CaDPA level in individualG. stearothermophilusand Bacillusspores*.
Spores CaDPA level (mM)
G. stearothermophilus 382679
B. cereus 3506105
B. subtilis 335642
*CaDPA levels in 30 individual spores of variousBacillalesspecies were determined, and mean values and standard deviations were calculated as described in Materials and Methods.
Monitoring Germination of Single Spores by Raman Spectroscopy and Differential Interference Contrast (DIC) Microscopy
The germination of an individualG. stearothermophilusspore with 0.1 mM L-valine in 10 mM sodium phosphate buffer (pH 8.0) at 65uC was monitored simultaneously by Raman spectroscopy and DIC microscopy, as described [18,19]. Briefly, a single G. stearothermophilus spore was optically captured immediately after the addition of 65uC 0.1 mM L-valine/10 mM sodium phosphate buffer. Both the Raman spectra and DIC microscopy images of the trapped spore were recorded simultaneously for a period of 45 min with intervals of 30 s per spectrum and 15 s per image frame, respectively. Note that the low concentration of L-valine used in this experiment was to slow spore germination sufficiently to allow its measurement by Raman spectroscopy.
Monitoring Germination of Multiple Individual Spores by DIC Microscopy
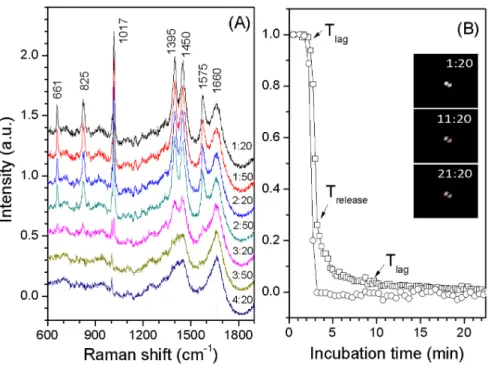
The germination of a number of individual spores was simultaneously monitored with DIC microscopy [18]. Prior to germination, the spores were routinely activated at 100uC for 30 min unless noted otherwise. Briefly, 1ml of heat-activated spores (108spores/ml in water) was spread on the surface of a glass coverslip glued to a clean and sterile sample container. The spores on the container were quickly dried in a vacuum chamber at room temperature so that they adhered to the coverslip. The spore container was then mounted on a microscope heat stage kept at the appropriate temperature. Preheated germinant / buffer solution was then added to the container, and a digital CCD camera (12 bits; 1600 by 1200 pixels) was used to record the DIC images at a rate of 1 frame per 15 s for 60–120 min. These DIC images were analyzed with a computation program in Matlab to Figure 2. Dynamics of nutrient germination of an optically trapped individualG. stearothermophilusspore.A heat activated (30 min, 100uC) spore was germinated at 65uC with 0.1 mM L-valine in 10 mM sodium phosphate buffer (pH 8.0), and the spore was monitored by Raman spectroscopy and DIC microscopy as described in Methods. Time-lapse Raman spectra of the trapped spores after the addition of L-valine were shown in (A). The indicated peaks at 661, 825, 1,017, 1,395 and 1,575 cm21
are the CaDPA bands. Normalized intensities of the CaDPA band at 101721 (#) and DIC images (%) as the function of incubation time were shown in (B). The CaDPA band intensities and DIC image intensities were normalized to their initial values right after the addition of L-valine, and the DIC image intensity at 25 min was normalized to 0. The interval between Raman spectrum acquisitions was 30 s, and the interval between DIC image acquisitions was 15 s. The inserts in Fig. 2(B) are the time-lapse DIC images of the trapped spore with a scale bar of 2mm. The DIC image of a single spore appears as two bright spots in DIC microscopy.
doi:10.1371/journal.pone.0074987.g002
Table 2.Effect of activation methods onG. stearothermophilusspore germination*.
Activation method
No. of spores examined
(% spore germination) Tlag(min) Trelease(min) DTrelease(min) Tlys DTlys(min)
No activation 458 (53.7) 12.666.2 14.166.2 1.460.8 19.566.2 5.462.8 100uC, 30 min 264 (98.1) 5.063.9 6.464.0 1.460.8 13.165.6 6.763.4 30uC, 0.2 M NaNO2, 17 h 248 (97.2) 4.463.2 5.563.3 1.160.6 11.565.6 6.062.9
30uC, 5 d 523 (81.1) 6.264.3 7.464.3 1.260.6 13.665.8 6.263.5
*Activated or unactivated spores were germinated at 65uC with 1 mM L-valine in 10 mM sodium phosphate buffer (pH 8.0) for 30 min, and kinetic parameters for all germinations were determined by analysis of$248 spores that germinated as described in Methods.
locate each spore’s position and to calculate the summed pixel intensity. The DIC image intensity of each spore was plotted as a function of the incubation time (with a resolution of 15 s).
Unless noted otherwise,G. stearothermophilusspores were germi-nated at various temperatures in: (i) 1 mM L-valine in 10 mM sodium phosphate buffer (pH 8.0); (ii) 1 mM AGFK (a mixture of 1 mM each of L-asparagine, D-glucose, D-fructose, and potassium ions) in 10 mM sodium phosphate buffer (pH 8.0); (iii) 60 mM CaDPA made to pH 7.4 with Tris base; and (iv) 1 mM dodecylamine in 10 mM sodium phosphate buffer (pH 8.0). Except for dodecylamine and CaDPA germination, spores were routinely activated for 30 min at 100uC prior to germination experiments unless noted otherwise.
Chemical Decoating of G. stearothermophilus Spores and Germination of Decoated Spores
Spores ofG. stearothermophilusat an optical density at 600 nm of ,10 were decoated by treatment with 1% sodium dodecylsulfate (SDS)–0.1 M NaOH–0.1 M NaCl–0.1 M dithiothreitol for
30 min at 65uC [20]. This procedure removes much of the spore’s coat protein as well as the spore’s outer membrane [20]. The decoated spores were washed at least 10 times with 0.1 M NaCl by centrifugation to remove all traces of the decoating solution and suspended in water. The decoated spores were then germinated with various agents with or without activation treatment as described above.
Data Analysis
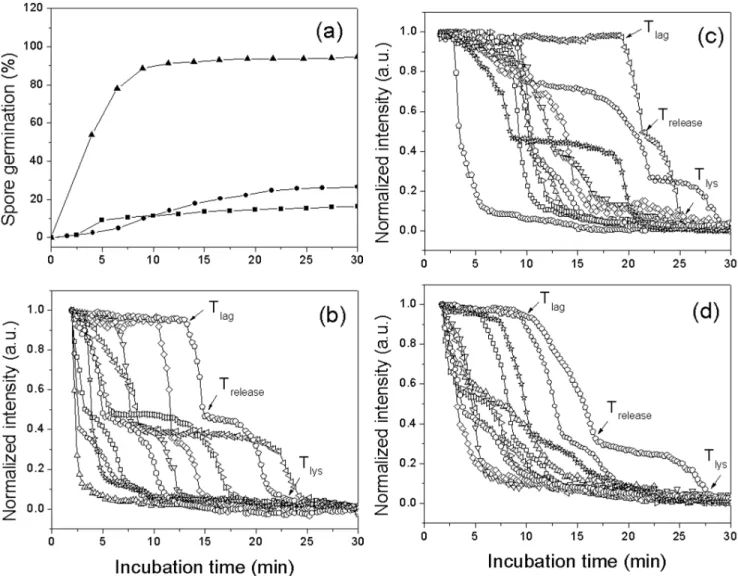
The DIC microscope that monitored individual spores was set such that the polarizer and analyzer were crossed, and thus the DIC bias phase was zero. After adding pre-heated germinant/ buffer solution to spores on the coverslips, a digital CCD camera was used to record the DIC images. These images were analyzed with a Matlab program to locate each spore’s position and to calculate the averaged pixel intensity of an area of 20620 pixels that covered the whole individual spore on the DIC image. The DIC image intensity of each individual spore was plotted as a function of the incubation time and the initial intensity (the first Figure 3. Effects of different activation methods on germination of multiple individualG. stearothermophilusspores.Spores were activated by various methods, and germinated at 65uC with 1.0 mM L-valine and 10 mM sodium phosphate buffer (pH 8.0), and germination of individual spores was monitored by DIC microscopy as described in Methods. Germination of$248 individual spores (Table 2) that were activated in 0.2 M sodium nitrite (pH 8.0) at 30uC for 17 h (
N
), in water at 30uC for 120 h (m), in water at 100uC for 30 min (&), or without activation (*) was shown in (a). Kinetics of germination of ten individual spores without activation (b); activated at 30uC for 120 h (c), and activated in 0.2 M sodium nitrite (pH 8.0) for 17 h (d) was given in (b-d).DIC image recorded after the addition of the germinant) was normalized to 1 and the intensity at the end of measurements was normalized to zero. Invariably, the latter value had been constant for$10 min at the end of measurements.
From the time-lapse DIC image intensity, we can determine the time of completion of the rapid fall of,75% in spore DIC image intensity, which is concomitant with the time of completion of spore CaDPA release (Trelease). CaDPA release kinetics during
germinationof individual spores were described by the parameters Tlag,Trelease andDTrelease [7,18]. We also defined the additional
germination parameters, Tlys and DTlys where Tlys is the time
when spore cortex hydrolysis is completed as determined by the completion of the fall in the spore’s DIC image intensity, and DTlys= (Tlys-Trelease).
Results
Raman Spectra and Average CaDPA Level of Individual G. Stearothermophilus Spores
CaDPA dominates the Raman spectra of individual spores of Bacillus species [21], and this was also the case for spores of G. stearothermophilus (Fig. 1). The intensity of the CaDPA-specific 1,017 cm21
Raman band in the average spectrum from 30 individual spores indicated that the CaDPA level in the core ofG. stearothermophilusspores was, 382 mM, and this value was only slightly higher than the values for B. subtilis and B. cereusspores (Table 1).
Fig. 1 also shows the average Raman spectra of individual G. stearothermophilus spores measured at 25, 65, and 95uC, in comparison to spectra ofB. subtilisandB. cereusspores. The peaks at 661, 824, 1,017, 1,395 and 1,575 cm21
are the bands due to CaDPA, while the dotted lines denote the protein bands of amide I (1653/1667 cm21
) and amide III (1253 cm21
), respectively. The bands at 1,653 and 1,667 cm21
are assigned to thea-helical and nonregular structures of the amide I (peptide bond C = O stretch) of proteins, respectively [22–24]. Raman spectra ofB. subtilisand B. cereus spores (Fig. 1(B, C)) show that as the temperature was increased from 25 to 95uC, the intensity of the 1653 cm21band was slightly decreased and the intensity at 1667 cm21 slightly increased. Similarly, the peak of the 1253 cm21 band (protein amide III) was slightly shifted to the left at the higher temperatures. This suggests that the structure of proteins in B. subtilisandB. cereus spores had changed significantly from ana -helical structure to a nonregular structure at high temperature, indicative of significant denaturation of proteins in these spores as found previously [24–26]. Indeed, when incubated at 95uC, some B. cereusspores lost their CaDPA, the 1653c m21band shifted to
1667 cm21, and the 1253 cm21band shifted to 1235 cm21(curve
d in Fig. 1(C)), suggesting that significant protein denaturation took place after CaDPA release at 95uC. In contrast to results with B. subtilisandB. cereusspores, the Raman bands of protein amide I (1653/1667 cm21
) were unchanged forG. stearothermophilusspores at 95uC (Fig. 1(A)), indicating that these spores’ proteins are stable even at 95uC, consistent with these spores’ extremely high wet heat resistance. The amide III band (1230–1300 cm21
) region centered
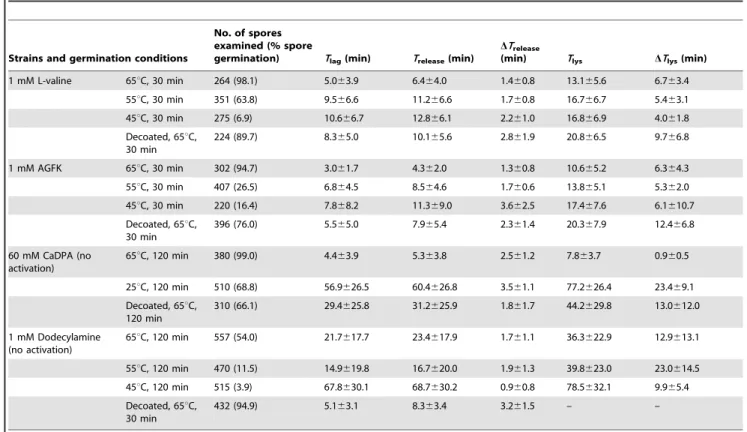
Table 3.Mean values and standard deviations ofTlag,Trelease,DTrelease,Tlys, andDTlysvalues for individual germinatingG. stearothermophilusspores*.
Strains and germination conditions
No. of spores examined (% spore
germination) Tlag(min) Trelease(min)
DTrelease
(min) Tlys DTlys(min)
1 mM L-valine 65uC, 30 min 264 (98.1) 5.063.9 6.464.0 1.460.8 13.165.6 6.763.4 55uC, 30 min 351 (63.8) 9.566.6 11.266.6 1.760.8 16.766.7 5.463.1 45uC, 30 min 275 (6.9) 10.666.7 12.866.1 2.261.0 16.866.9 4.061.8 Decoated, 65uC,
30 min
224 (89.7) 8.365.0 10.165.6 2.861.9 20.866.5 9.766.8
1 mM AGFK 65uC, 30 min 302 (94.7) 3.061.7 4.362.0 1.360.8 10.665.2 6.364.3 55uC, 30 min 407 (26.5) 6.864.5 8.564.6 1.760.6 13.865.1 5.362.0 45uC, 30 min 220 (16.4) 7.868.2 11.369.0 3.662.5 17.467.6 6.1610.7 Decoated, 65uC,
30 min
396 (76.0) 5.565.0 7.965.4 2.361.4 20.367.9 12.466.8
60 mM CaDPA (no activation)
65uC, 120 min 380 (99.0) 4.463.9 5.363.8 2.561.2 7.863.7 0.960.5
25uC, 120 min 510 (68.8) 56.9626.5 60.4626.8 3.561.1 77.2626.4 23.469.1 Decoated, 65uC,
120 min
310 (66.1) 29.4625.8 31.2625.9 1.861.7 44.2629.8 13.0612.0
1 mM Dodecylamine (no activation)
65uC, 120 min 557 (54.0) 21.7617.7 23.4617.9 1.761.1 36.3622.9 12.9613.1
55uC, 120 min 470 (11.5) 14.9619.8 16.7620.0 1.961.3 39.8623.0 23.0614.5 45uC, 120 min 515 (3.9) 67.8630.1 68.7630.2 0.960.8 78.5632.1 9.965.4 Decoated, 65uC,
30 min
432 (94.9) 5.163.1 8.363.4 3.261.5 – –
*Heat-activatedG. stearothermophilusspores were germinated for 30 min with 1 mM L-valine or 1 mM AGFK at 65uC in 10 mM sodium phosphate buffer (pH 8.0), unactivatedG. stearothermophilusspores were germinated at 65uC for 120 min with 60 mM CaDPA or with 1 mM dodecylamine in 10 mM sodium phosphate buffer (pH 8.0), and decoatedG. stearothermophilusspores (heat-activated or unactivated) were germinated with different germinants at 65uC for 30 or 120 min. Kinetic parameters for individual germinations were determined by analysis of$100 spores that germinated as described in Methods.
at 1253 cm21
shifted to a lower wavenumber at 65uC and at 95uC forB. cereusspores, but forG. stearothermophilusandB. subtilisspores, this change was less prominent. The Raman band at 783 cm21 seen at 25uC is attributed to ring breathing of cytosine/thymine/ uracil and the O–P–O symmetric stretch of the phosphodiester bond in DNA and RNA [27,28]. At 95uC, the Raman band at 783 cm21
was nearly unchanged, suggesting that the double helical structure of nucleic acids in G. stearothermophilus spores is stable at elevated temperature.
Dynamics of Germination of SingleG. stearothermophilus Spores
Fig. 2 shows dynamics of an optically trapped individual G. stearothermophilus spore during L-valine germination at 65˚C, as monitored by Raman spectroscopy and DIC microscopy. After the addition of the germinant the CaDPA level as measured by the 1017 cm21
band [17] and the DIC image intensity were nearly unchanged before Tlag at , 2.2 min. The intensity of the 1017 cm21 band then quickly dropped to zero and the spore’s DIC image intensity decreased,70% byTreleaseat,3.2 min. In this experiment, the DIC image intensity of theG. stearothermophilus
spore usually continued to fall (but see below) until Tlys at , 9.6 min, corresponding to the completion of spore cortex hydrolysis, and then remained constant. As seen with the germination ofBacillus spores [19], the termination point of the rapid fall in DIC image intensity precisely corresponded to the completion of CaDPA release forG. stearothermophilusspores.
Effect of Different Activation Methods onG. stearothermophilusSpore Germination
Previous studies [29,30] have shown that germination of G. stearothermophilusspores becomes much more rapid if the spores are first given an activation treatment such as incubation in water for short times at a high temperature, long times in water at a moderate temperature, or incubation in sodium nitrite at a moderate temperature for intermediate times. The current work demonstrated that these different activation regimens led to different kinetics of L-valine germination of individual G. stearothermophilus spores at 65uC (Table 2; Fig. 3). All three activation regimens increased the overall rates of spore germina-tion, almost completely by decreasing average Tlag values with
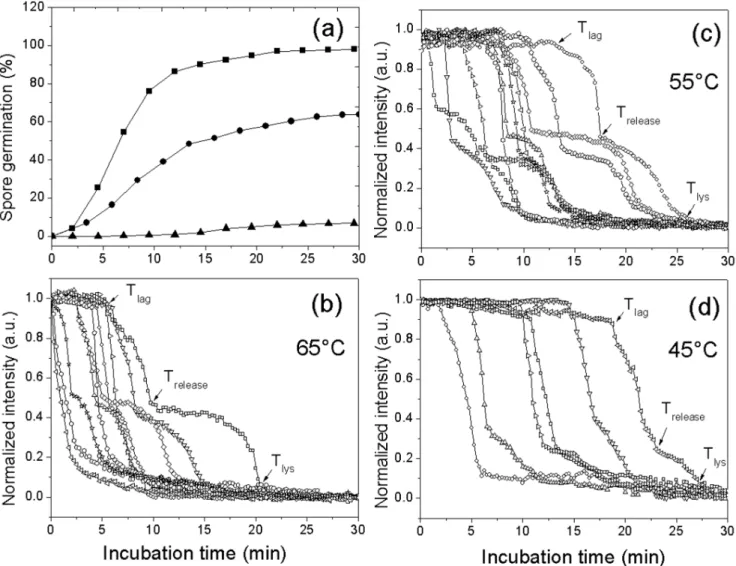
minimal if any effects on values forDTreleaseandDTlys. Note also Figure 4. L-Valine germination of multiple individualG. stearothermophilusspores.Heat activated spores (30 min, 100uC) were germinated at various temperatures with 1 mM L-valine in 10 mM sodium phosphate buffer (pH 8.0), and germination of individual spores was monitored by DIC microscopy as described in Methods. Germination of $264 individual spores at 65uC(&), 55uC (
N
), or 45uC (m) was shown in (a). Kinetics of germination of ten individual spores at 65uC (b), 55uC (c), or 45uC (d) was given in (b–d).that for a number of the individual spores activated by various regimens, following the initial rapid fall in DIC image intensity of ,60%, there was an lag of 5–20 min followingTreleaseand before
the further fall in DIC image intensity. This was also seen in many other germination experiments (see below), although the reason for this lag period is not clear.
Kinetics of Germination of Multiple IndividualG. stearothermophilusSpores with L-valine or AGFK
Previous work [29] has shown thatG. stearothermophilusspores are able to germinate in the presence of L-valine or AGFK. Consequently we used DIC microscopy to analyze the germina-tion of multiple individualG. stearothermophilusspores with L-valine or AGFK at multiple temperatures (Fig. 4 and 5; Table 3; and data not shown).G. stearothermophilusspores germinated faster with AGFK than L-valine at 65uC, and as expected, germination with these nutrients was faster at 65uC than at 55uC or 45uC, while no germination was observed whenG. stearothermophilus spores were incubated with 1 mM L-valine at 37uC or 25uC (Table 3; and data not shown). The slower germination of these spores at lower
temperatures was due primarily to longerTlagvalues as: i) many
spores did not even germinate in the observation times at the lower temperatures, and thus have very long Tlag values; ii) DTrelease
values increased only slightly at lower temperatures; and iii)DTlys values were essentially unchanged at low and high temperatures.
Kinetics of Non-nutrient Germination of IndividualG. stearothermophilusSpores
In addition to nutrients, spores can germinate with a variety of non-nutrients [2,3], including lysozyme, CaDPA, cationic surfac-tants, high pressures and some salts. Unlike the case with nutrient germination, exogenous CaDPA induced germination of G. stearothermophilus spores at 25uC (Fig. 6; Table 3). However, CaDPA germination of G. stearothermophilus spores was faster at 65uC due largely to a much shorter average Tlag value than at
25uC, although theDTreleasevalues were almost identical at these two temperatures. The averageDTlysvalue for CaDPA germina-tion at 25uC was also much longer than for CaDPA germination at 65uC.
Figure 5. Germination of multiple individualG. stearothermophilusspores with AGFK at different temperatures.Heat activated (30 min, 100uC) spores were germinated at various temperatures with AGFK and 10 mM sodium phosphate buffer (pH 8.0), and germination of individual spores was monitored by DIC microscopy as described in Methods. Germination of$220 individual spores at 65uC (m), 55uC (
N
), or 45uC (&) was shown in (a). Kinetics of germination of ten individual spores at 65uC (b), 55uC (c), or 45uC (d) was given in (b–d).Another group of non-nutrient germinants is cationic surfac-tants, with dodecylamine being the one that has been best studied [31].With 1 mM dodecylamine at 65uC, only , 50% of G.
stearothermophilusspores germinated in 120 min, a slow germination compared to those with other germinants, and dodecylamine germination was minimal at 45uC (Fig. 7; Table 3). As seen with CaDPA germination at low and high temperatures, most of the decrease in the rate of germination with dodecylamine at the lower temperature was due to much longer averageTlagvalues.
Kinetics of Germination of Individual DecoatedG. stearothermophilusSpores
Since at least some proteins involved in spore germination in Bacillusspecies are located in the spore coats, in particular the CLE CwlJ [2], we also examined the effect of chemical decoating onG. stearothermophilus spores’ germination with nutrient and non-nutrient germinants, all at 65uC (Fig. 8; Table 3). With L-valine and AGFK, the rate of germination of decoatedG. stearothermophilus spores decreased by,15%, whileTlagvalues increased,1.5 fold. However, the amount and rate of CaDPA germination of the
decoated spores were markedly lower than with intact spores, as the average Tlag value increased.6-fold while the averageTlys
value increased,13-fold, although the averageDTreleasevalue was
essentially unchanged from that for intact spores. Decoating also greatly increased the rate of dodecylamine germination of G. stearothermophilusspores markedly, largely by decreasing the average Tlagvalue (Table 3).
Discussion
The work in this communication has revealed a number of similarities in the properties of spores ofG. stearothemophilus and Bacillusspecies, in particular the nearly identical DPA concentra-tions in these spores’ core. However, there were some differences. One was the lack of change in the Raman spectrum of proteins in Figure 6. Germination of multiple individualG.
stearothermo-philusspores with CaDPA.Unactivated spores were germinated with CaDPA at various temperatures, and germination of individual spores was followed by DIC microscopy as described in Methods. Germination at 65uC (&) or 25uC (
N
), with germination of$380 individual spores examined was shown in (a). Kinetics of germination of ten individual spores at 65uC (b) or25uC (c) was given in (b, c).doi:10.1371/journal.pone.0074987.g006 Figure 7. Germination of multiple individualphilus spores with dodecylamine. Unactivated spores wereG. stearothermo-germinated at various temperatures with 1 mM dodecylamine in 10 mM sodium phosphate buffer (pH 8.0), and germination of$470 individual spores was monitored by DIC microscopy. Germination at 65uC (&), 55uC (
N
) and 45uC (m) was shown in (a). Kinetics of germination of ten individual spores at 65uC (b) or 55uC (c) was given in (b, c).G. stearothermophilusspores upon incubation at 95uC. This behavior, as well as the high temperature needed for heat activation ofG. stearothermophilus spores, is undoubtedly a reflection of G. stear-othermophilusbeing a thermophile, and is consistent with both the high temperature optimum for germination of spores of this species and their extremely high wet heat resistance compared to spores ofB. cereusandB. subtilis[10]. The second difference, and a more intriguing one was the highly variable lag period between Treleaseand the initiation of the second fall inG. stearothermophilus
spores’ DIC image intensity during spore germination with all germinants tested, as this has been seen only rarely in germination of spores of Bacillus species [19,32]. While we have no good explanation for this difference, it is as if there is a much higher threshold for the signal event that beginsG. stearothermophilusspore cortex degradation by CLEs following CaDPA release than with spores ofBacillusspecies. However, these signaling mechanisms are not well understood, so we have no good mechanistic explanation for this difference between spores of these two genera.
While there were the notable differences betweenG. stearother-mophilus and Bacillus spore properties noted above, the overall features of the nutrient and non-nutrient germination kinetics of individual spores of this species were very much like those of
Bacillus species. Thus CaDPA release for all G. stearothermophilus spore germinations examined began only after a highly variable Tlagperiod butDTreleasetook only a few min, withTreleasefollowed
by cortex hydrolysis that was completed atTlys. Almost always,
DTlyswas longer thanDTrelease, and most of the heterogeneity in the germination between individual spores was inDTlagvalues, as seen previously with spores of Bacillus species [18,32,33]. The effects of activation treatments on the germinationG. stearothermo-philuswere also largely, if not completely onTlagvalues, as average
DTrelease andDTlysvalues in nutrient germination of unactivated and maximally activated spores were essentially identical. Optimal heat activation also decreases average Tlag values for nutrient
germination of spores ofBacillusspecies [34]. Since a major factor determining theTlagperiod for nutrient germination of spores of
Bacillusspecies is spores’ levels of functional GRs [33], this further suggests that heat activation of G. stearothermophilus spores for 30 min at 100uC makes these spores’ GRs optimally functional, perhaps by some conformational protein changes as has been suggested for spores of Bacillus species [35]. The mechanism of nitrite activation of spores has never been analyzed in detail, but could be due to covalent modification of the spore cortex by Figure 8. Germination of multiple individual decoatedG. stearothermophilusspores.Heat activated (30 min, 100uC (a,b), or unactivated spores (c,d) were germinated at 65uC with 1 mM L-valine (a); 1 mM AGFK (b); 60 mM CaDPA (c); and 1 mM dodecylamine (d), in 10 mM sodium phosphate buffer (pH 8.0), and germination of individual spores was monitored by DIC microscopy as described in Methods. The insets in the various panels show the percentages of spore germination when$224 individual spores (Table 2) were monitored.
nitrous acid [36]. However, this could equally well be due to nitrous acid modification of GRs.
It was also notable that germination at suboptimal temperatures greatly increased Tlag values for nutrient germination of G.
stearothermophilusspores, especially given that lower percentages of these spores germinated at lower temperatures in the observation periods used. In contrast, there was essentially no effect onDTlys values as the germination temperature was lowered, indicating that the temperature sensitive step in nutrient germination ofG. stearothermophilus spores is in Tlag, and probably is on the GRs
themselves, although there was also a small increase in DTrelease times as germination temperature was lowered. The effect of temperature on kinetics of the germination of individual spores has not been studied with spores ofBacillusspecies.
Decoating of G. stearothermophilus spores had only a minimal effect on their nutrient germination, with the biggest effect being 1.5 to 2-fold increases in DTlys values. The G. stearothermophilus genome has the genes for the two redundant CLEs, CwlJ and SleB, involved in cortex hydrolysis during spore germination in Bacillusspecies. WithBacillusspores, decoating largely removes or inactivates CwlJ [37], and presumably a decrease in CwlJ level is the reason for the increased DTlys values in decoated G. stearothermophilus spores. However, we do not know if all G. stearothermophilusCwlJ is inactivated by the decoating regimen we used. Indeed, decoating or loss of CwlJ by mutation increases values of DTrelease in nutrient germination of spores of several Bacillusspecies 6- to 10-fold [38,39], while the increase in decoated G. stearothemophilus spores was at most 2-fold. Thus with G. stearothermophilus spores either CwlJ is not essential for rapid CaDPA release in spore germination, or some active CwlJ survives the decoating regimen used. We favor the latter possibility, since CwlJ is essential for CaDPA germination of spores of Bacillus species [37,40], while significant CaDPA germination still took place with decoated G. stearothermophilus spores. However, the
averageTlagvalue for CaDPA germination increased,7-fold in decoatedG. stearothermophilusspores. Thus it seems most likely that CwlJ is also the primary target of CaDPA in triggering germination ofG. stearothermophilusspores.
Along with nutrient germination, G. stearothermophilus spore germination with the non-nutrients CaDPA and dodecylamine also decreased markedly at suboptimal temperatures, again largely due to effects onTlag. However, the latter effect is almost certainly
not on GRs, which are not involved in CaDPA and dodecylamine germination of spores ofBacillusspecies [31,37]. Indeed, as noted above, CaDPA probably triggers G. stearothermophilus spore germination by activating the CLE CwlJ, while inBacillus spores dodecylamine likely triggers germination by triggering the opening of the CaDPA channel in the spores’ inner membrane that is composed at least in part of SpoVA proteins [41]. Interestingly, decoating ofG. stearothermophilusspores significantly increased these spores’ germination with dodecylamine primarily by decreasing Tlag values, just as with spores ofBacillus species [31]. Why this
should be is not completely clear, but decoating may allow easier access of dodecylamine to the SpoVA CaDPA channel than in an intact spore.
In summary, the analysis of the dynamics of the germination of multiple individual G. stearothermophilus spores with a variety of germinants indicates that the general features of the germination of these spores appear to be quite similar to those of spores of Bacillusspecies.
Author Contributions
Conceived and designed the experiments: PS YL. Performed the experiments: TZ YL. Analyzed the data: TZ PS YL. Contributed reagents/materials/analysis tools: PS YL. Wrote the paper: TZ ZD PS YL. Designed the experiments, analysed the results, and revised the manuscript: ZD.
References
1. Paredes-Sabja D, Setlow P, Sarker MR (2011) Germination of spores ofBacillales
andClostridialesspecies: mechanisms and proteins involved. Trends Microbiol 19: 85–94.
2. Setlow P (2003) Spore germination. Curr Opin Microbiol 6: 550–556. 3. Paidhungat M, Setlow P (2002) Spore germination and outgrowth. In: Hoch JA,
Losick R, Sonenshein AL, editors.Bacillus subtilisand its relatives: from genes to cells. Washington, DC: American Society for Microbiology. 537–548. 4. Moir A (2006) How do spores germinate? J Appl Microbiol 101: 526–530. 5. Cowan AE, Koppel DE, Setlow B, Setlow P (2003) A soluble protein is immobile
in dormant spores of Bacillus subtilis but is mobile in germinated spores: Implications for spore dormancy. Proc Natl Acad Sci USA 100: 4209–4214. 6. Pelczar PL, Igarashi T, Setlow B, Setlow P (2007) Role of GerD in germination
ofBacillus subtilisspores. J Bacteriol 189: 1090–1098.
7. Wang G, Yi X, Li YQ, Setlow P (2011) Germination of individualBacillus subtilis
spores with alterations in the GerD and SpoVA proteins, which are important in spore germination. J Bacteriol 193: 2301–2311.
8. Onyenwoke RU, Brill JA, Farahi K, Wiegel J (2004) Sporulation genes in members of the low G+C Gram-type-positive phylogenetic branch (Firmicutes). Arch Microbiol 182: 182–192.
9. Feeherry F, Munsey DT, Rowley DB (1987) Thermal inactivation and injury of
Bacillus stearothermophilusspores. Appl Environ Microbiol 53: 365–370. 10. Gerhardt P, Marquis RE (1989) Spore thermoresistance mechanisms. In: Smith
I, Slepecky RA, Setlow P, editors. Regulation of prokaryotic development. Washington, DC: American Society for Microbiology. 43–63.
11. Burgess SA, Lindsay D, Flint SH (2010) Thermophilic bacilli and their importance in dairy processing. Int J Food Microbiol 144: 215–225. 12. Prevost S, Andre S, Remize F (2010) PCR detection of thermophilic
spore-forming bacteria involved in canned food spoilage. Curr Microbiol 61: 525–533. 13. Loshon CA, Fliss ER, Setlow B, Foerster HF, Setlow P (1986) Cloning and sequencing of genes for small, acid-soluble spore proteins ofBacillus cereus,Bacillus stearothermophilusand ‘‘Thermoactinomyces thalpophilus’’. J Bacteriol 167: 168–173. 14. Setlow B, Setlow P (1996) Role of DNA repair inBacillus subtilisspore resistance.
J Bacteriol 178: 3486–3495.
15. Clements MO, Moir A (1998) Role of thegerIoperon ofBacillus cereus569 in the response of spores to germinants. J Bacteriol 180: 6729–6735.
16. Paidhungat M, Setlow B, Driks A, Setlow P (2000) Characterization of spores of
Bacillus subtiliswhich lack dipicolinic acid. J Bacteriol 182: 5505–5512. 17. Huang SS, Chen D, Pelczar PL, Vepachedu VR, Setlow P, et al. (2007) Levels of
Ca2+
-dipicolinic acid in individualBacillusspores determined using microfluidic Raman tweezers. J Bacteriol 189: 4681–4687.
18. Zhang P, Kong L, Wang G, Setlow P, Li YQ (2010) Combination of Raman tweezers and quantitative differential interference contrast microscopy for measurement of dynamics and heterogeneity during the germination of individual bacterial spores. J Biomed Opt 15: 056010.
19. Kong L, Zhang P, Wang G, Setlow P, Li YQ (2011) Characterization of bacterial spore germination using integrated phase contrast microscopy, Raman spectroscopy and optical tweezers. Nat Protocols 6: 625–639.
20. Bagyan I, Noback M, Bron S, Paidhungat M, Setlow P (1998) Characterization ofyhcN, a new forespore-specific gene ofBacillus subtilis. Gene 212: 179–188. 21. Chen D, Huang SS, Li YQ (2006) Real-time detection of kinetic germination
and heterogeneity of singleBacillusspores by laser tweezers Raman spectroscopy. Anal Chem 78: 6936–6941.
22. Williams RW, Cutrera T, Dunker AK, Peticolas WL (1980) The estimation of protein secondary structure by laser Raman. Spectroscopy from the amide III’ intensity distribution. FEBS Lett 115: 306–308.
23. Kitagawa T, Hirota S (2002) Raman spectroscopy of proteins. In: Chalmers JM Griffiths PR, editors. Handbook of vibrational spectroscopy, vol. 5. Hoboken, NJ: John Wiley. 3426–3446.
24. Zhang P, Kong L, Setlow P, Li YQ (2010) Characterization of wet-heat inactivation of single spores ofBacillusspecies by dual-trap Raman spectroscopy and elastic light scattering. Appl Environ Microbiol 76: 1796–1805. 25. Coleman WH, Chen D, Li YQ, Cowan AE, Setlow P (2007) How moist heat
kills spores ofBacillus subtilis. J Bacteriol 189: 8458–8466.
26. Coleman WH, Zhang P, Li YQ, Setlow P (2010) Mechanism of killing of spores ofBacillus cereusandBacillus megateriumby wet heat. Lett Appl Microbiol 50: 507– 514.
27. Benevides JM, Tsuboi M, Bamford JK, Thomas GJ Jr (1997) Polarized Raman spectroscopy of double-stranded RNA from bacteriophage phi6: local Raman tensors of base and backbone vibrations. Biophys J 72: 2748–2762.
in H2O and D2O solutions and application to B, Z and A-DNA. Nucleic Acids Res 11: 5747–5761.
29. Foerster HF (1983) Activation and germination characteristics observed in endospores of thermophilic strains ofBacillus. Arch Microbiol 134: 175–181. 30. Foerster HF (1985) The effects of alterations in the suspending medium on
low-temperature activation of spores of Bacillus stearothermophilus Ngb101. Arch Microbiol 142: 185–189.
31. Setlow B, Cowan AE, Setlow P (2003) Germination of spores ofBacillus subtilis
with dodecylamine. J Appl Microbiol 95: 637–648.
32. Kong L, Zhang P, Setlow P, Li YQ (2010) Characterization of bacterial spore germination using integrated phase contrast microscopy, Raman spectroscopy and optical tweezers. Anal Chem 82: 3840–3847.
33. Setlow P, Liu J, Faeder JR (2012) Heterogeneity in bacterial spore population. In: E Abel-Santos, editor. Bacterial spores: current research and applications. Norwich, UK: Horizon Scientific Press. 201–216.
34. Setlow P, Johnson EA (2012) Spores and their significance. In: Doyle MP, Buchanan R, editors. Food microbiology, fundamentals and frontiers. Washington, DC: ASM Press. 45–79.
35. Zhang P, Setlow P, Li YQ (2009) Characterization of single heat-activated
Bacillusspores using laser tweezers Raman spectroscopy. Opt Expr 17: 16481– 16491.
36. Ando Y (1980) Mechanism of nitrite-induced germination ofClostridium perfringens
spores. J Appl Microbiol 49: 527–535.
37. Paidhungat M, Ragkousi K, Setlow P (2001) Genetic requirements for induction of germination of spores ofBacillus subtilisby Ca2+
-dipicolinate. J Bacteriol 183: 4886–4893.
38. Peng L, Chen D, Setlow P, Li YQ (2009) Elastic and inelastic light scattering from single bacterial spores in an optical trap allows monitoring of spore germination dynamics. Anal Chem 81: 4035–4042.
39. Setlow B, Peng L, Loshon CA, Li YQ, Christie G, et al. (2009) Characterization of the germination ofBacillus megateriumspores lacking enzymes that degrade the spore cortex. J Appl Microbiol 107: 318–328.
40. Heffron JD, Lambert EA, Sherry N, Popham DL (2010) Contributions of four cortex lytic enzymes to germination ofBacillus anthracisspores. J Bacteriol 192: 763–770.