ORIGINAL ARTICLE
Test
retest reliability and validity of a web-based food-frequency
questionnaire for adolescents aged 13
14 to be used in the
Norwegian Mother and Child Cohort Study (MoBa)
Nina Cecilie Øverby
1*, Elisabeth Johannesen
1, Grete Jensen
1, Anne-Kirsti Skjaevesland
1and Margaretha Haugen
21Department of Public Health, Sport and Nutrition, Faculty of Health and Sport Sciences, University of Agder,
Kristiansand, Norway;2Norwegian Institute of Public Health, Oslo, Norway
Abstract
Background: The assessment of food intake is challenging and prone to errors; it is therefore important to consider the reliability and validity of the assessment methods.
Objective: The aim of this study was to analyze the reproducibility and validity of a developed food-frequency questionnaire (FFQ) for use among adolescents.
Design: In total, 58 students (aged 1314) from four different schools in the southern part of Norway participated in the reproducibility study of filling out the FFQ 4 weeks apart. In addition, 93 students participated in the relative validity study where the FFQ was compared to 224-hour dietary recalls, while 92 students participated in the absolute validity study where the intakes of fatty acids and vitamin D from the FFQ were compared to fatty acids and 25-hydroxy-vitamin D3in whole blood.
Results: The median Spearman correlation coefficient for all nutrients in the testretest reliability study was 0.57. The median Spearman correlation for all nutrients in the relative validity study was 0.26, while the correlations coefficients were low in the absolute validity study withn-3 fatty acid coefficients ranging from 0.05 to 0.25, and absent for vitamin D (r0.000).
Conclusion: The testretest reproducibility was considered good, the relative validity was considered poor to good, and the absolute validity was considered poor. However, the results are comparable to other studies among adolescents.
Keywords: validation;food-frequency questionnaire;24-hour dietary recall;adolescents
Responsible Editor: Anna S. Olafsdottir, University of Iceland, Iceland.
Received: 30 January 2014; Revised: 3 September 2014; Accepted: 23 September 2014; Published: 17 October 2014
T
he diet of children and adolescents is recognized to be important for both current growth and development and future health (1, 2). In general, many of today’s health problems, that is, overweight and obesity, development of metabolic syndrome, diabetes, and a number of cancers, are related to what we eat (3). Evidence supports that the nutrition-related risk factors for chronic diseases start in early childhood and increases in adolescence (4). Diet is a modifiable risk factor which makes it important to investigate, and it makes both children and adolescents important groups of study. The diet of Norwegian adolescents has frequently been described as insufficient, especially with regard to sugar and fiber intake and fruits and vegetables (5, 6); however, recent detailed studies are lacking.The Norwegian Mother and Child Cohort Study (MoBa), a longitudinal study comprising 114,500 chil-dren and 95,200 mothers (7, 8), can provide a good basis for both general knowledge of dietary intake in adoles-cents as well as linking the diet to future health outcomes. In the forthcoming years, MoBa will include about 60,000 adolescents, and for this, a reliable and validated dietary assessment tool needs to be developed.
The assessment of food intake is challenging and prone to errors, especially among children and adolescents (9, 10), and incorrect information may lead to false associa-tions between dietary factors and disease (11, 12). Fur-ther, adolescence is a crucial period of life, and implies multiple physiological and psychological changes that affect nutritional needs and habits (1315). To overcome
such hurdles, it is critical to choose the best dietary intake method available for estimating nutrient intake (11). How-ever, to conduct a dietary survey among MoBa partici-pants, methods such as 24-HDRs and weighed records are not apt options as they may be burdensome for partici-pants and project staff. Food-frequency questionnaire (FFQ) is an acceptable and useful tool to assess nutrient intake for a larger populationand an FFQ reflects
long-term usual intake (10, 11, 16, 17). Furthermore, it is gener-ally easy to administer and involves lesser time than other dietary assessment methods, which makes it a practical and affordable method in studying diets of adolescents (17, 18).
It is crucial to consider the degree to which a questionnaire can measure true dietary intake. Therefore, the aim of this study was to analyze the reproducibility and validity with regard to food and nutrient intake of a developed FFQ for use among adolescents. Both relative validity, where intake measured by the FFQ is compared with 224-hour dietary recalls (24-HDR), and absolute
validity for intake of fatty acids and vitamin D correlated with levels of fatty acids and 25 hydroxy vitamin D3,
respectively, in serum are presented.
Methods
Study design and recruitment
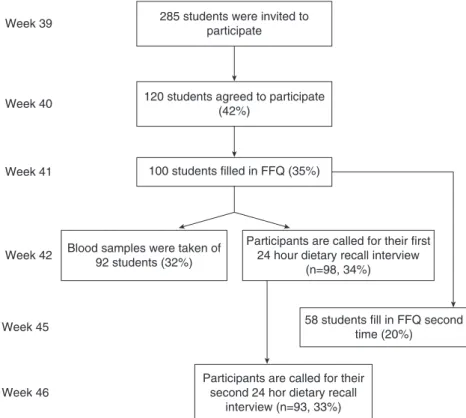
Data were collected over a period from October to November 2011. Four 9th-grade classes were informed
about the study, and an information/invitation letter and consent form for both parents and students were handed out. After consenting to participate, the students received the first FFQ by e-mail. The e-mail contained short information about the web-based FFQ and a link to the FFQ. The participants had 1 week to finish the FFQ. A reminder message was sent after 4 days to those who had not filled in the FFQ. The first 24-HDR took place 1 week after the participant had finished the FFQ, and the second, 4 weeks after the first 24-HDR. All partici-pants were called on a random day. Those who had not filled in the FFQ were not called.
Two weeks after the students had filled in the FFQ, blood samples were taken at school.
For the testretest reliability study, a new link to the FFQ was sent to those who had filled in the FFQ for the first time. This was done 4 weeks after the first time FFQ. Figure 1 gives an overview of the design and recruitment.
Study population
A total of 285 students aged 1314 from four different
schools in Vest-Agder County were invited to participate in the validity and reliability study. Of which 120 students agreed to participate, and 100 students filled in the first FFQ. The same 100 students were called on a random day to take part in the first 24-HDR. Two students were missed due to a mistake, resulting in 98 students participating in the first 24-HDR. Ninety-three students participated in the second and last 24-HDR. In the results from the
Week 39
Week 40
Week 41
Week 42
Week 45
Week 46
Blood samples were taken of 92 students (32%)
Participants are called for their first 24 hour dietary recall interview
(n=98, 34%)
58 students fill in FFQ second time (20%)
Participants are called for their second 24 hor dietary recall
interview (n=93, 33%) 285 students were invited to
participate
120 students agreed to participate (42%)
100 students filled in FFQ (35%)
relative validity, only those who completed the first FFQ and both 24-HDRwere included (n93). In the testretest
study, 98 students filled in the first FFQ. Of these students 58 filled in the questionnaire the second time, which was the number included in the testretest analyses. The
abso-lute validation study included 92 participants who filled in the FFQ the first time and also had a blood sample taken.
The food-frequency questionnaire
The FFQ is self-administered and is based on a Danish FFQ for adolescents (19).
The FFQ consists of 156 questions. The first part includes questions about gender, age, weight and height (self-reported), and the level of activity (i.e. how many hours physical activity at school and how many hours spent in front of a computer to chat, play, surf, and do homework on a daily basis). The activity questions are validated questions from the HEVAS study (20). Further-more, the FFQ contains questions on the average con-sumption of 131 food and beverage items during the past 4 weeks. These food items are divided into different sections in the FFQ (i.e. beverage, dairy products, bread and cereals, spread/cold cuts, fish and meat, fruit and vege-tables, cakes/desserts/snacks). Of relevance to the validity study, the questionnaire posed questions on the intake of fatty fish, egg, milk, butter, margarine, cod liver oil, and vitamin D supplements. The frequency intervals vary according to food and beverage items. For beverages, the intervals range were never, 13 glasses per month, 1 glass
per week, 26 glasses per week, 1 glass per day, 23 glasses per day, more than 3 glasses per day. For frequently consumed food items, the intervals range were ‘never’, 13
times per month, once a week, 23 times per week and
more, 46 times per week to ‘once or more times a day’.
The respondents indicate their answers in ‘units per day’, ‘units per week’, and ‘units per month’. For most items, a unit is a standard portion size (i.e. a glass of juice, a bowl of cereals, an apple). For some items, extra infor-mation is provided (i.e. for soda: 1 bottle0.5 l).
All questions are close ended, except four which are related to dietary supplements, food-allergies, if there was anything they avoided eating, and if the last 4 weeks had been average in terms of eating habits. These questions were placed at the end of the questionnaire.
When calculating the nutrient intake, the standard portion included in the FFQ (e.g. glass of juice), which was coded according to the Norwegian standards (21) in grams, was multiplied by the frequency ticked off in the FFQ. Furthermore, each food item had a food-code linkage corresponding to the numbers in the Norwegian food composition table. For dishes, the codes adjusted for nutrient loss during cooking were chosen. Using Food-Calc and the Norwegian food composition table (2224),
the nutrient intake was calculated.
The repeated 24-HDR
The 24-HDRs were conducted on two non-consecutive days and were based on interviews done by three master’s degree students and one bachelor degree student, using the ‘triple-pass’ method from King’s College London (22). The four interviewers were all given the same information on how to perform the interviews and they followed a detailed description according to the triple-pass method. They practiced in advance and all the four interviewed each other afterwards to check if they were harmonized according to the triple-pass method.
All week days were randomly assigned to the partici-pants, aiming to cover all days of the week equally. How-ever, due to difficulties in making contact with the participants on given days, the distribution of days for the two recalls was skewed. For recall 1 and 2, respectively, the distribution was as follows: Monday (14%, 31%), Tuesday (23%, 16%), Wednesday (25%, 14%), Thursday (12%, 10%), Friday (8%, 5%), Saturday (4%, 5%), Sunday (15%, 18%).
To help quantify the food intake for the participants, a validated food picture booklet (23) with pictures of different dishes and portion sizes was handed out at school before the first interview. The booklet consisted of 16 pictures of different household measurements and portion sizes. The 16 food pictures were categorized into four different portion sizes named AD, where A was the
smallest portion and D was the largest.
The interviewer called the participant while they were at home on their home phone/cell phone. The participant was free to get help from his or her parents while taking part in the interview and could also check food packages and brand name at home. At the beginning of the inter-view, the interviewer introduced the procedure, explained the ways the picture booklet was to be used, and em-phasized that the participant could at any time ask questions to the interviewer if anything was unclear.
Use of dietary supplements/vitamins and questions about allergies were asked for at the end of the interview.
All the information gathered by the interviewer was written down on record sheets while the interview took place. At the end of the data collection all notes were handled systematically and transferred to Excel. A food-code linkage was provided, using FoodCalc and the Norwegian food composition table (2426) to calculate the nutrient intake. The four interviewers standardized their coding by having meetings at several stages during the coding phase. Composite dishes and recipes were coded by ingredients if given during the interview or by using a similar dish and recipe if no details were available. Food items that were not in the food composition table were discussed and similar foods were selected and the same code was used by all interviewers. Fats used in cooking were coded when informed of. For standardized portion sizes that were not in the photographic booklet, the Norwegian standards were used (21). Nutrients presented in the relative validation and reliability study are calculated without dietary supplements. However, for the absolute validation dietary supplements were included.
Blood samples
For the absolute validity study, we selected fatty acids and vitamin D concentration in whole blood to correlate with the calculated nutrient intake from the FFQ. Several health outcomes have been related to these nutrients and are therefore interesting (27, 28). As for vitamin D, it is found naturally in a few food items like fatty fish and fish liver (28), and is a critical and essential nutrient for human health; however, the relevance for cancer and cardiovascular diseases are currently discussed (28). The fatty acids and vitamin D concentrations were measured in capillary non-fasting whole blood using dried blood spot (DBS). The fatty acids analyzed were alpha-linolenic acid (ALA), eicosapentaenoic acid (EPA), docosapentaenoic acid (DPA), docosahexaenoic acid (DHA), and linoleic acid (LA); and for vitamin D, 25 hydroxy vitamin D3
(25(OH)D3) was analyzed. According to the laboratory at
VitAs, all assays on DBS are compared with both internal and external reference methods on plasma or serum. The chosen laboratory function is a reference lab for fat-soluble vitamins for the Nordic External Quality assurance Program, and qualify and participates and is compliant in the largest vitamin D External Quality Assessment, called DEQAS. As found by others, both 25(OH)D3and fatty acid analysis perform equally well on
DBS as in ordinary serum or whole blood samples (29). Drops of blood from each participant were transferred on to a special filter paper after a pinprick on fingertip. Three nurses were responsible for this procedure, and the students were taken out of their class into another class-room for the blood test. Samples were air dried for at least 2 h as recommended, packed separately in the supplied
airtight Bioindex DBS transport bags containing desic-cant, deep frozen at 208C, and sent to the laboratory (Vitas AS) (30) for analyses of levels of the biomarkers 25(OH)D3and full fatty acid profile. The technique used
to analyze fatty acids was gas chromatography with flame ionization detection (30), and the analysis technique used on 25(OH)D3was liquid chromatography with mass
spec-trometry detection. Fatty acids in blood were expressed as g/100 g FAME and 25(OH)D3as nmol/L.
Ethics
Our study has been performed in accordance with the guidelines laid down in the Declaration of Helsinki, and all procedures involving human subjects were approved by the Regional Ethics Committee of southern Norway. Written informed consent was obtained from all partici-pants and their parents.
Statistical analysis
Descriptive analyses were used to evaluate the character-istics of the participants (mean age, gender, height, weight, BMI). The total intake of energy and selected nutrients from FFQs and 24-HDR were not normally distributed and are therefore presented as median with 25th and 75th percentile.
For the relative validity study, the mean intake from the two 24-HDRs was calculated and used in the correlation analysis. Median daily intakes of the selected nutrients and E% were calculated separately based on the FFQs and the 24-HDRs. Median food intakes reported from FFQs and 24-HDRs are presented in these food groups: dairy products; eggs; meat and poultry; fish; bread and cereals; potatoes, fruit, and vegetables; sugar, sweets, and snacks; butter, margarine, and oils; beverages (water, juice, sodas, tea, and coffee).
Correlations between the food, nutrient, and energy intakes estimated by the two FFQs (reproducibility study) and between FFQ and the mean of two 24-HDR were done with the use of Spearman’s correlation coefficient (r). To adjust for the within-person variation in the measurements, corrections of correlation coeffi-cients were performed according to Willett (16). The corrected correlation, R1, was calculated as follows: R1¼R0 ffiffiffiffiffiffiffiffiffiffiffiffiffiffi1s2w
s2
b
=n;
q
wheres2
w=s
2
b is the ratio of the
within-and between-person variances within-andnis the number of re-plicates per person for the given variable. The within- and between-person variances were obtained from an ANOVA model. These correlations are presented in Table 4.
Self-reported weight and height were used to calculate body mass index (BMIkg/m2). The significance level was set to 5%, and all statistical analysis were carried out using the computer program SPSS version 18 (SPSS Inc. Chicago, IL, USA).
Results
Sample
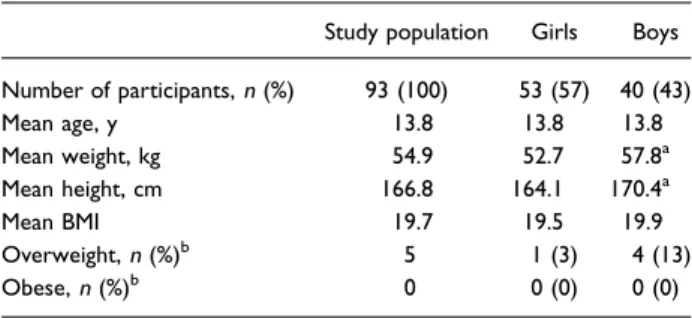
The characteristics of the 93 students who completed the FFQ and the two 24-HDRs are presented in Table 1. There was an equal distribution of girls and boys in the study. Mean age of participants was 13.8 years while mean BMI was 19.7 kg/m2.
Testretest reliability
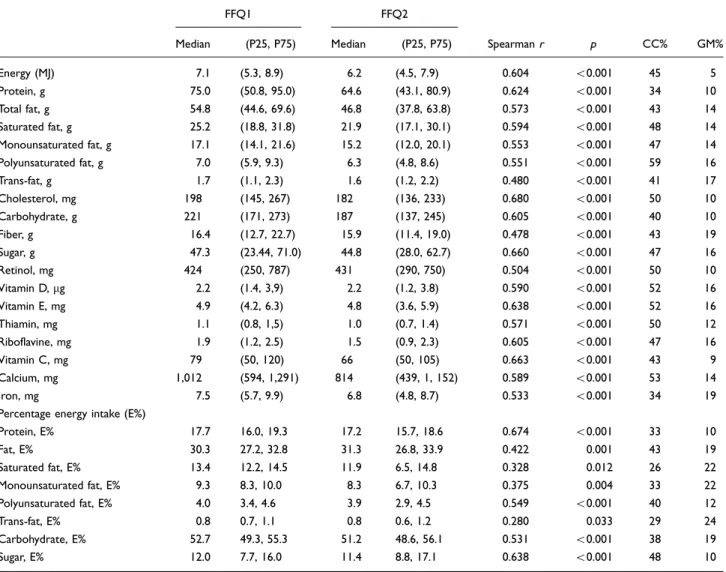
There were 58 students who participated in the reliability study, 22 boys and 36 girls. The median Spearman cor-relation coefficient for all nutrients in the testretest study was 0.57 (Table 2). The correlations ranged fromr0.280 for trans-fat to r0.680 for cholesterol. All correlations
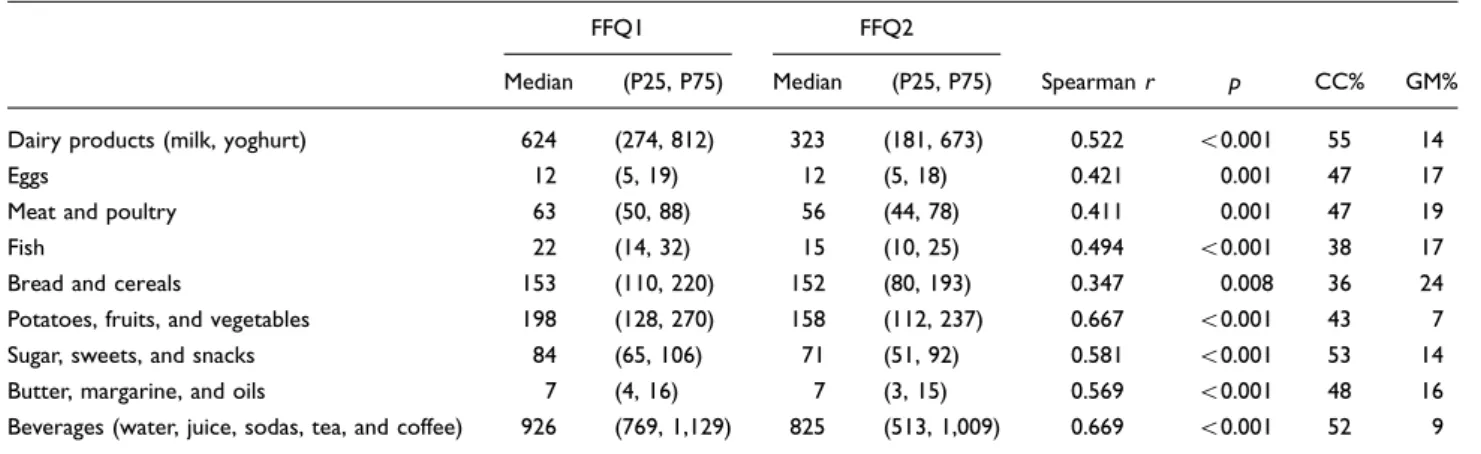
were significant. For most nutrients, more than 50% of the participants were correctly classified into the same quartile of intake. For trans-fat, only 29% participants were cor-rectly classified. For all but three nutrients (trans-fat, monounsaturated fat, and saturated fat), less than 20% of the participants were GM into a non-adjacent quartile. The median Spearman coefficient for all food groups was 0.52 (Table 3), with a range fromr0.35 for bread and
cereals tor0.67 for beverages. For all but the food group
‘bread and cereals’, less than 20% of the participants were GM, that is, classified into a non-adjacent quartile.
Relative validity
The median Spearman correlation coefficient for all nutrients in the relative validity study wasr0.26, ranging
fromr 0.07 for energy percent from polyunsaturated fat tor0.55 for calcium (Table 4). Significant
correla-tions were found for all nutrients, except intake of saturated fat, monounsaturated fat, cholesterol, energy
percent from fat, and polyunsaturated fat. To correct for within-person variation between the two 24-HDRs, cor-rected correlation coefficients are presented in Table 4. Most correlations were improved, especially correlations for polyunsaturated fat, cholesterol, vitamin D, vitamin E, and energy percent from sugar.
The correct classifications of participants into same quartiles were also low for these nutrients, ranging from 22% for energy percent from monounsaturated fat to 30% for E% from saturated fat. Best classifications were found for energy intake (40%) and vitamin C intake (42%).
The median Spearman correlation coefficient for all food groups wasr0.19 (Table 5), ranging fromr0.01
for sugar, sweets, and cakes tor0.627 for dairy products.
There was a low percentage of the participants being correctly classified into quartiles of food intakes (2242%) (Table 5).
Absolute validity
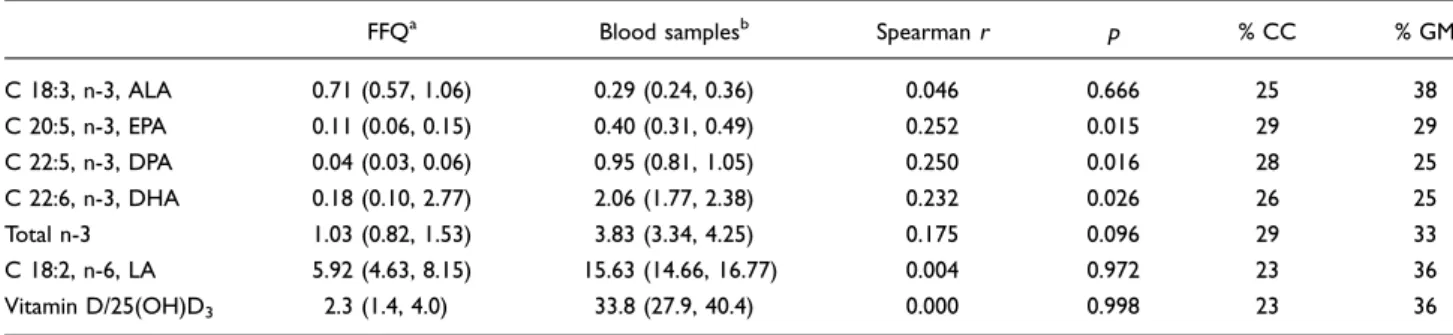
Significant correlations were found for then-3 fatty acids, EPA, DPA, and DHA; however, not for the fatty acids ALA and LA, totaln-3 intake and vitamin D from FFQ compared to whole blood analyses (Table 6). The correla-tion coefficients forn-3 fatty acids were low ranging from
r=0.05 to 0.25, and absent for vitamin D (r0.000). The
correct classifications into quartiles were low for all fatty acids and vitamin D.
Discussion
An FFQ was developed for use among adolescents in the Norwegian Mother and Child Cohort. In the present study, the testretest reliability of this FFQ was explored by comparing two administrations of the FFQ over a 4-week period. Further, the relative validity of the FFQ was explored against two 24-HDRs. Finally, the absolute validity with regard to selected fatty acids and vitamin D were explored by comparing the FFQ intake with fatty acid and 25(OH)D3levels in whole blood.
Testretest reliability
The general testretest reliability of the questionnaire was
good with median correlations of 0.53 for nutrients and 0.52 for food groups, which fell within the range con-sidered good for an FFQ (12, 16). Low correlations were only found for trans-fat (r0.28). This might be because intake of trans-fat generally is low in the Norwegian public (31) and further that foods, such as cookies and biscuits, containing trans-fat are eaten seldom, making that intake more difficult to measure. In our sample, median intake of sweet biscuits was 2 g/day (Q1: 2 g/day, Q4: 2 g/day), where of course few of these include trans-fat (data not shown). Our results are comparable to other studies involving adolescents (32, 33). Kobayashi et al. tested the reprodu-cibility of two newly developed questionnaires for ado-lescents and found correlations between 0.67 and 0.84 for
Table 1. Characteristics of the participants in the validation study (n93)
Study population Girls Boys Number of participants,n(%) 93 (100) 53 (57) 40 (43) Mean age, y 13.8 13.8 13.8 Mean weight, kg 54.9 52.7 57.8a Mean height, cm 166.8 164.1 170.4a
Mean BMI 19.7 19.5 19.9 Overweight,n(%)b 5 1 (3) 4 (13)
Obese,n(%)b 0 0 (0) 0 (0)
aValue missing for one boy;bage- and gender-specific classification of
nutrients in the first questionnaire and 0.39 to 0.83 for the other. In general, these correlations are somewhat higher than those found in the present study. However, the present correlations are higher than what was re-ported by Preston et al. (mean r0.43) among
adoles-cents. In their general review, Cade et al. found that correlations between 0.5 and 0.7 were most common in reproducibility studies (12). The strength of our study is the time lapse between the two FFQ administrations, which was 4 weeks, and which according to Cade et al. is in line with approximately 34% of all the testretest
studies (12). Cade et al. state that it is not wise to administer a questionnaire at a very short interval as respondents may remember their answers; however, true changes in diet may occur if the interval is too long (12). A limitation with this study is the low sample size (n58), as it is lower than the ideal sample size of
100200 (16). The participants in this study were involved
in many assessments, and the second FFQ was the last thing they did, and we assume that that is an explanation for the low participation.
Relative validity
Comparisons of nutrient and energy intakes estimated from the FFQ with the reference method, 224-HDRs,
showed limited agreement. The correlation coefficients between the FFQ and the 24-HDRs varied from0.07 to
0.55. In most validation studies, correlation coefficients are considered to be poor ifrB0.49 and good ifr0.5
(12, 34). Overall, poor to good associations were observed for 10 of the nutrients and E% from trans-fat. In this study, three of the nutrients (riboflavine, vitamin C, and calcium) had a correlation coefficient like Willett recom-mend (r0.50.7), and in total eight of the nutrients were
over the threshold that Cade suggests (r0.4) (12, 16).
The correlation was considered good for dairy products
Table 2. Testretest reliability of a food-frequency questionnaire for adolescents
FFQ1 FFQ2
Median (P25, P75) Median (P25, P75) Spearmanr p CC% GM% Energy (MJ) 7.1 (5.3, 8.9) 6.2 (4.5, 7.9) 0.604 B0.001 45 5
Protein, g 75.0 (50.8, 95.0) 64.6 (43.1, 80.9) 0.624 B0.001 34 10
Total fat, g 54.8 (44.6, 69.6) 46.8 (37.8, 63.8) 0.573 B0.001 43 14
Saturated fat, g 25.2 (18.8, 31.8) 21.9 (17.1, 30.1) 0.594 B0.001 48 14
Monounsaturated fat, g 17.1 (14.1, 21.6) 15.2 (12.0, 20.1) 0.553 B0.001 47 14
Polyunsaturated fat, g 7.0 (5.9, 9.3) 6.3 (4.8, 8.6) 0.551 B0.001 59 16
Trans-fat, g 1.7 (1.1, 2.3) 1.6 (1.2, 2.2) 0.480 B0.001 41 17
Cholesterol, mg 198 (145, 267) 182 (136, 233) 0.680 B0.001 50 10
Carbohydrate, g 221 (171, 273) 187 (137, 245) 0.605 B0.001 40 10
Fiber, g 16.4 (12.7, 22.7) 15.9 (11.4, 19.0) 0.478 B0.001 43 19
Sugar, g 47.3 (23.44, 71.0) 44.8 (28.0, 62.7) 0.660 B0.001 47 16
Retinol, mg 424 (250, 787) 431 (290, 750) 0.504 B0.001 50 10
Vitamin D,mg 2.2 (1.4, 3,9) 2.2 (1.2, 3.8) 0.590 B0.001 52 16
Vitamin E, mg 4.9 (4.2, 6.3) 4.8 (3.6, 5.9) 0.638 B0.001 52 16
Thiamin, mg 1.1 (0.8, 1,5) 1.0 (0.7, 1.4) 0.571 B0.001 50 12
Riboflavine, mg 1.9 (1.2, 2.5) 1.5 (0.9, 2.3) 0.605 B0.001 47 16
Vitamin C, mg 79 (50, 120) 66 (50, 105) 0.663 B0.001 43 9
Calcium, mg 1,012 (594, 1,291) 814 (439, 1, 152) 0.589 B0.001 53 14
Iron, mg 7.5 (5.7, 9.9) 6.8 (4.8, 8.7) 0.533 B0.001 34 19
Percentage energy intake (E%)
Protein, E% 17.7 16.0, 19.3 17.2 15.7, 18.6 0.674 B0.001 33 10
Fat, E% 30.3 27.2, 32.8 31.3 26.8, 33.9 0.422 0.001 43 19 Saturated fat, E% 13.4 12.2, 14.5 11.9 6.5, 14.8 0.328 0.012 26 22 Monounsaturated fat, E% 9.3 8.3, 10.0 8.3 6.7, 10.3 0.375 0.004 33 22 Polyunsaturated fat, E% 4.0 3.4, 4.6 3.9 2.9, 4.5 0.549 B0.001 40 12
Trans-fat, E% 0.8 0.7, 1.1 0.8 0.6, 1.2 0.280 0.033 29 24 Carbohydrate, E% 52.7 49.3, 55.3 51.2 48.6, 56.1 0.531 B0.001 38 19
Sugar, E% 12.0 7.7, 16.0 11.4 8.8, 17.1 0.638 B0.001 48 10
Table 3. Testretest reliability of a food-frequency questionnaire for adolescents
FFQ1 FFQ2
Median (P25, P75) Median (P25, P75) Spearmanr p CC% GM% Dairy products (milk, yoghurt) 624 (274, 812) 323 (181, 673) 0.522 B0.001 55 14
Eggs 12 (5, 19) 12 (5, 18) 0.421 0.001 47 17 Meat and poultry 63 (50, 88) 56 (44, 78) 0.411 0.001 47 19 Fish 22 (14, 32) 15 (10, 25) 0.494 B0.001 38 17
Bread and cereals 153 (110, 220) 152 (80, 193) 0.347 0.008 36 24 Potatoes, fruits, and vegetables 198 (128, 270) 158 (112, 237) 0.667 B0.001 43 7
Sugar, sweets, and snacks 84 (65, 106) 71 (51, 92) 0.581 B0.001 53 14
Butter, margarine, and oils 7 (4, 16) 7 (3, 15) 0.569 B0.001 48 16
Beverages (water, juice, sodas, tea, and coffee) 926 (769, 1,129) 825 (513, 1,009) 0.669 B0.001 52 9
Food intake (g/day) presented for main food groups (median, 25th and 75th percentile, Spearman correlation coefficient, percent correctly classified (CC) and grossly misclassified (GM) into quartiles of food intake) (n58).
Table 4. Relative validity of the FFQ compared to 224-HDRs
FFQ 24-HDR
Nutrients n Median (P25, P75) Median (P25, P75) Spearmanr p Corrected,Ra CC% GM% Energy (MJ) 93 7.1 (5.1, 8.9) 7.3 (5.9, 9.3) 0.33 0.001 0.34 40 29 Protein, g 93 73.2 (52.0, 95.1) 70.7 (56.2, 92.5) 0.42 0.000 0.43 38 24 Total fat, g 93 56.9 (43.7, 71.4) 66.2 (46.1, 82.3) 0.21 0.041 0.22 28 26 Saturated fat, g 93 25.5 (18.9, 32.7) 26.7 (20.2, 34.2) 0.13 0.226 0.14 26 32 Monounsaturated fat, g 93 17.6 (13.6, 22.8) 20.2 (14.5, 25.7) 0.19 0.074 0.21 28 29 Polyunsaturated fat, g 93 7.1 (5.9, 9.3) 9.5 (6.8, 13.6) 0.25 0.014 0.28 31 24 Trans-fat, g 93 1.7 (1.2, 2.1) 1.4 (0.8, 1.8) 0.24 0.023 0.24 33 28 Cholesterol, mg 93 199.1 (145.4, 289.1) 191.4 (132.0, 260.2) 0.19 0.065 0.51 25 34 Carbohydrate, g 93 217.0 (159.9, 278.4) 217.1 (167.6, 276.8) 0.41 0.000 0.42 37 25 Fiber, g 93 17.4 (12.4, 22.6) 14.6 (11.7, 21.2) 0.34 0.001 0.34 35 24 Sugar, g 93 48.1 (34.0, 69.6) 44.9 (29.5, 74.5) 0.21 0.042 0.22 32 32 Retinol, mg 93 436.5 (261.0, 717.3) 419.3 (285.0, 592.2) 0.42 0.000 0.43 34 22 Vitamin D,mg 93 2.1 (1.3, 3.9) 1.8 (0.7, 3.6) 0.22 0.033 0.26 32 32
Vitamin E, mg 93 5.1 (4.2, 6.6) 5.7 (3.9, 7.2) 0.28 0.006 0.36 26 24 Thiamin, mg 93 1.1 (0.7, 1.5) 1.0 (0.8, 1.4) 0.46 0.000 0.46 36 21 Riboflavine, mg 93 1.8 (1.1, 2.5) 1.2 (0.9, 1.6) 0.50 0.000 0.50 35 20 Vitamin C, mg 93 82.8 (56.0, 119.3) 51.8 (29.5, 77.2) 0.50 0.000 0.50 42 16 Calcium, mg 93 980.1 (603.8, 1345.3) 782.4 (540.6, 1041.1) 0.55 0.000 0.56 39 17 Iron, mg 93 7.4 (5.5, 9.7) 7.4 (5.8, 8.6) 0.30 0.003 0.56 36 28 Percentage energy intake (E%)
Protein, E% 93 17.3 (15.7, 19.2) 17.0 (14.3, 18.6) 0.24 0.019 0.25 32 30 Fat, E% 93 30.3 (27.5, 34.5) 31.3 (25.5, 36.8) 0.17 0.098 0.17 28 28 Saturated fat, E% 93 13.4 (12.2, 15.3) 13.2 (10.8, 15.4) 0.15 0.163 0.16 30 30 Monounsaturated fat, E% 93 9.3 (8.5, 10.5) 9.8 (7.6, 11.7) 0.18 0.083 0.19 22 32 Polyunsaturated fat, E% 93 4.0 (3.4, 4.5) 4.7 (3.8, 6.3) 0.07 0.495 0.08 24 47
Trans-fat, E% 93 0.8 (0.7, 1.1) 0.6 (0.5, 0.9) 0.40 0.000 0.40 35 25 Carbohydrate, E% 93 51.0 (48.7, 55.2) 51.4 (45.0, 58.2) 0.28 0.006 0.29 35 23 Sugar, E% 93 12.3 (9.0, 16.0) 11.2 (6.9, 17.1) 0.26 0.013 0.30 35 29 Median intake of nutrients and E% estimated by the food-frequency questionnaire (FFQ) and the 24-hour dietary recalls (24-HDRs) (median, 25th and 75th percentile, Spearman correlation coefficient, percent correctly classified (CC) and grossly misclassified (GM) into quartiles of nutrient intake).
aCorrelation coefficient adjusted for within-person variance R¼R
0
ffiffiffiffiffiffiffiffiffiffiffiffiffiffiffiffiffiffiffiffiffiffiffiffi
1þs2
w=s
2
b=n p
where s2
w=s
2
b is the ratio of the within- and between-person
but poor for most other food groups. Although compar-ison to other studies is difficult due to differences in meth-odology for reference methods, comparing our results with six relevant studies representing FFQs for adoles-cents (10, 3438) show that our results are comparable for several nutrients like fiber and calcium. A similar study also found lower correlations for food intake compared to nutrient intake (37). Few participants were classified into the right quartile based on the two assessment methods. Overall, based on the percentage of subjects classified into the same quartile, the ranking ability of the questionnaire was evaluated to be limited. The lack of agreement be-tween the two methods may be due to limitations of the FFQ, the reference measure (the 24-HDR), or how the study was conducted. One challenge in the validation of an FFQ is the selection of a proper reference method. When validating an FFQ, dietary records are likely to have the least correlated errors according to Willett (16). Multiple 24-HDRs are the primary alternative to dietary records (16). However, it is a suboptimal alternative since
both rely on memory and perception of serving sizes. Willett argue that in situations, as when subjects are less than highly motivated, 24-HDRs are good alternatives to dietary records (16). It is important to be aware of the fact that FFQ is designed to measure usual intake while the 24-HDR is designed to measure short-term intake. However, two 24-HDRs are sufficient to capture usual food intake if first, random within-person error is removed by statistical modelling, as done in Table 4 in our study. Several cor-relations were strengthened after this correction, probably because by using the arithmetic mean of both interviews in the first correlation, the proportions in the upper and lower tails of the intake distribution were overestimated. Then for individual-level intake assessment, the correla-tions between the two methods were probably somewhat underestimated due to regression dilution bias. Second, two 24-HDRs are sufficient to capture usual food intake if random between-person error is eliminated by including sufficient observations. The numbers included were not optimal; however, compared to others, we believe that the
Table 5. Relative validity of the FFQ compared to 224-HDRs
FFQ 24-HDR
Nutrients n Median (P25, P75) Median (P25, P75) Spearmanr p CC% GM% Dairy products (milk, yoghurt) 93 573 (225, 869) 255 (141, 504) 0.627 B0.001 42 10
Eggs 93 13 (5, 21) 0 (0, 0) 0.173 0.098 24 0 Meat and poultry 93 75 (50, 84) 75 (30, 134) 0.162 0.121 31 23 Fish 93 23 (10, 32) 0 (0, 9) 0.188 0.070 22 20 Bread and cereals 93 156 (85, 216) 178 (113, 248) 0.385 B0.001 33 23
Potatoes, fruits, and vegetables 93 194 (122, 275) 195 (106, 301) 0.246 0.017 30 28 Sugar, sweets, cakes, and snacks 93 82 (63, 108) 65 (25, 107) 0.010 0.925 23 29 Butter, margarine, and oils 93 7 (4, 16) 15 (4, 31) 0.152 0.145 31 30 Beverages (water, juice, sodas, tea, and coffee) 93 906 (775, 1112) 760 (475, 1062) 0.276 0.010 33 32 Median food intake in selected food groups and E% estimated by the food-frequency questionnaire (FFQ) and the 24-hour dietary recalls (24-HDRs) (median, 25th and 75th percentile, Spearman correlation coefficient, percent correctly classified (CC) and grossly misclassified (GM) into quartiles of food intake).
Table 6. Correlation between intake of fatty acids and vitamin D (including supplements) (FFQ) and fatty acids and 25(OH)D3measured in blood
FFQa Blood samplesb Spearmanr p % CC % GM C 18:3, n-3, ALA 0.71 (0.57, 1.06) 0.29 (0.24, 0.36) 0.046 0.666 25 38 C 20:5, n-3, EPA 0.11 (0.06, 0.15) 0.40 (0.31, 0.49) 0.252 0.015 29 29 C 22:5, n-3, DPA 0.04 (0.03, 0.06) 0.95 (0.81, 1.05) 0.250 0.016 28 25 C 22:6, n-3, DHA 0.18 (0.10, 2.77) 2.06 (1.77, 2.38) 0.232 0.026 26 25 Total n-3 1.03 (0.82, 1.53) 3.83 (3.34, 4.25) 0.175 0.096 29 33 C 18:2, n-6, LA 5.92 (4.63, 8.15) 15.63 (14.66, 16.77) 0.004 0.972 23 36 Vitamin D/25(OH)D3 2.3 (1.4, 4.0) 33.8 (27.9, 40.4) 0.000 0.998 23 36
Median, 25th and 75th percentile, Spearman correlation coefficient, percent correctly classified (CC) and grossly misclassified (GM) into quartiles of nutrient intake. (n92).
aFatty acid: g/day, vitamin D:
24-HDRs to some extent serve as a superior reference method for the relative validity assessment.
A limitation with the 24-HDR is that subjects knowing that their diet is under investigation, may change their dietary intake and this creates a distortion of their actual intake (12, 39). The students knew what week they would be called, but not what day of the week. Being aware of the week they would be called may have resulted in more healthy eating habits in that particular week. This is often subconscious and has been shown for adolescents, espe-cially girls (40, 41). One should further notice the par-ticular days the recall took place. A majority of the days were weekdays, and it is well known that diet changes during the weekends, especially Friday and Saturday (42). This is a limitation with the study and could have led to underreporting of certain nutrients like different fats and sugar and foods like sweets and cakes. There is of course a general limitation with underreporting to be aware of, which is a particular problem among girls (43). Another consideration is the number of days for recall; the low number of days (n2) may not be enough to assess the
usual intake for adolescents (37). Several other validation studies have more than two, often 34 days of recall (3537).
Willett also suggests that 310 days of recall would be
appropriate if the population investigated is small (16). There are several additional limitations to be consid-ered in our validation study. One limitation is the low response rate and the large dropout rate from those who handed in the written consent to those who finished the first FFQ, even though a reminder message was sent after the first e-mail invitation to the FFQ to increase the response rate (44). Low response rate is also seen in other validation studies (45). Another limitation refers to the problem of estimating portion size and how detailed the information had to be. Estimating food with photo-graphs, as done in the 24-HDRs, is a complex task (23). Since only a short booklet was used in this study, there were no pictures of all the different kinds of food items or portion sizes. Therefore, the interviewers could end up in a situation where they had to help the participants to remember and suggest estimates of the food. In the FFQ, household measurements and specific portion sizes were used. A large number of the questions were also grouped (more than one food item in one question), and the students did not have the opportunity to answer as precisely as in the 24-HDRs (i.e. if the pasta was whole grain). This can explain some of the differences observed.
Absolute validity
The evaluation of this FFQ’s absolute validity showed poor correlations in EPA, DPA, and DHA compared to the same nutrients in blood. The correlation coefficients between FFQ and blood in this study ranged from
r0.000 to 0.291. These are low values especially when
correlation is considered to be poor ifrB0.49 (3). None
of the nutrients in this study reached a correlation level above this. In addition, the classification of participants into the right quartile calculated by these two assessment methods was low, on average 26.1%, meaning that the results allow for misclassification (23).
There are few studies comparing self-reported dietary intake with biomarkers of fat from whole blood as reviewed by many (46, 47), particularly data in children are scarce. Two studies in children were identified: Burrows et al. (48) and Okuda et al. (49). Burrows et al. (48) found about the same correlation in EPA (r0.24),
lower correlation in LA (r0.01), ALA (r0.03), DPA
(r0.03), and DHA (r0.11) compared to the present
study. Okuda et al. (49) found roughly similar results as our study for EPA (r0.281) and DHA (r0.233), lower
correlation for DPA (r0.093). All values were
unad-justed (49). The correlation coefficients between vitamin D and 25(OH)D3were lower than what is observed by others
(50, 51). One could speculate if the FFQ did not include enough detailed questions regarding sources of fatty acid and vitamin D. We could have included more questions on oils with regard to fatty acids. As for vitamin D, most food sources were included in the FFQ. One could argue that since some vitamin D stems from sunlight a good correlation would be difficult to show, especially since the samples were taken in October where adolescents have spent less time outdoors. However, according to Pedersen (52) sunlight supplies ignorable amounts of vitamin D at our latitude in OctoberApril. Brantsæter et al. found
among pregnant women that the correlation between dietary intake measured by FFQ and plasma concentra-tions of vitamin D increased during winter compared to the whole year (53). This supports ignorable amounts from sunlight during winter (51). Although it is a reference method for vitamin D measurements, the method of DBS sampling is still a critical method and our analyses were done on non-standardized samples, that is, the blood were not drawn while the subjects had an overnight fast.
Conclusion
Acknowledgements
This work was supported by grants from the Norwegian Institute of Public Health and the University of Agder. The content of this article reflects only the author’s view and the Norwegian Institute of Public Health is not liable for any use that may be made of the information contained therein.
Conflict of interest and funding
The authors declare no conflict of interest and funding.
References
1. Rogol AD, Clark PA, Roemmich JN. Growth and pubertal development in children and adolescents: effects of diet and physical activity. Am J Clin Nutr 2000; 72: 521S8S.
2. Deshmukh-Taskar P, Nicklas TA, Morales M, Yang SJ, Zakeri I, Berenson GS. Tracking of overweight status from childhood to young adulthood: the Bogalusa Heart Study. Eur J Clin Nutr 2006; 60: 4857.
3. World Health Organization (2003). Diet, nutrition and the prevention of chronic diseases. Report of a joint WHO/FAO expert consultation. Technical Report. Series no. 916. 2003. Genova: WHO.
4. Moreno LA, Rodriguez G, Fleta J, Bueno-Lozano M, Lazaro A, Bueno G. Trends of dietary habits in adolescents. Crit Rev Food Sci Nutr 2010; 50: 10612.
5. Overby NC, Lillegaard IT, Johansson L, Andersen LF. High intake of added sugar among Norwegian children and adoles-cents. Public Health Nutr 2004; 7: 28593.
6. Overby N, Andersen LF. Ungkost 2000 National dietary study among students in 4th and 8th grade. Oslo: Directorate of Health and Social Affairs; 2002.
7. Magnus P, Irgens LM, Haug K, Nystad W, Skjaerven R, Stoltenberg C. Cohort profile: the Norwegian Mother and Child Cohort Study (MoBa). Int J Epidemiol 2006; 35: 114650.
8. Norwegian Institute of Public Health. The Norwegian Mother and Child Cohort. 2014. Available from: http://www.fhi.no/ studier/den-norske-mor-og-barn-undersokelsen [cited 13 October 2014].
9. Livingstone MB, Robson PJ. Measurement of dietary intake in children. Proc Nutr Soc 2000; 59: 27993.
10. Cullen KW, Watson K, Zakeri I. Relative reliability and validity of the Block Kids Questionnaire among youth aged 10 to 17 years. J Am Diet Assoc 2008; 108: 8626.
11. Roman-Vinas B, Ortiz-Andrellucchi A, Mendez M, Sanchez-Villegas A, Pena QL, Aznar LA, et al. Is the food frequency questionnaire suitable to assess micronutrient intake adequacy for infants, children and adolescents? Matern Child Nutr 2010; 6: 11221.
12. Cade J, Thompson R, Burley V, Warm D. Development, validation and utilisation of food-frequency questionnairesa
review. Public Health Nutr 2002; 5: 56787.
13. Oellingrath IM, Svendsen MV, Brantsaeter AL. Tracking of eating patterns and overweighta follow-up study of Norwegian school-children from middle childhood to early adolescence. Nutr J 2011; 10: 106.
14. Moreno LA, Kersting M, De HS, Gonzalez-Gross M, Sichert-Hellert W, Matthys C, et al. How to measure dietary intake and food habits in adolescence: the European perspective. Int J Obes (Lond) 2005; 29: S66S77.
15. Lioret S, Touvier M, Balin M, Huybrechts I, Dubuisson C, Dufour A, et al. Characteristics of energy under-reporting in children and adolescents. Br J Nutr 2011; 105: 167180.
16. Willett W, editor. Nutritional epidemiology. 3rd ed. New York: Oxford University Press; 2013.
17. Biro G, Hulshof KF, Ovesen L, Amorim Cruz JA. Selection of methodology to assess food intake. Eur J Clin Nutr 2002; 56: S25S32.
18. Matthys C, Pynaert I, De KW, De HS. Validity and reprodu-cibility of an adolescent web-based food frequency question-naire. J Am Diet Assoc 2007; 107: 60510.
19. Drumm-Hakim F, Bjerregaard AA. Validation of a web-based Food Frequency Questionnaire for assessing habitual dietary intake in 1314-year old Danish adolescents. Copenhagen:
University of Copenhagen; 2011.
20. Torsheim T, Eriksson L, Schnohr CW, Hansen F, Bjarnason T, Valimaa R. Screen-based activities and physical complaints among adolescents from the Nordic countries. BMC Public Health 2010; 10: 324.
21. Landsforeningen for Kosthold og Helse. Ma˚l og vekt for matvarer. (The volume and weight for food items). 2nd ed. Oslo: Falch hurtigtrykk; 1995.
22. Nelson M, Erens B, Bates B, Church S, Boshier T, editors. Low income diet and nutrition survey. London: The Stationery Office; 2007.
23. Lillegaard IT, Overby NC, Andersen LF. Can children and adolescents use photographs of food to estimate portion sizes? Eur J Clin Nutr 2005; 59: 61117.
24. Lauritzen L. FoodCalc. Current version. 2013. Available from: http://www.ibt.ku.dk/jesper/foodcalc [cited 22 March 2014]. 25. Rimestad AH. The Norwegian food composition table and the
database for nutrient calculations at the Institute for Nutrition Research. Nor J Epidemiol 2000; 10: 710.
26. Mattilsynet HoUiO. Matvaretabellen 2013 (The Norwegian Food Consumption Table). Available from: www.matvaretabellen. no [cited 22 March 2014].
27. Chowdhury R, Warnakula S, Kunutsor S, Crowe F, Ward HA, Johnson L, et al. Association of dietary, circulating, and supplement fatty acids with coronary risk: a systematic review and meta-analysis. Ann Intern Med 2014; 160: 398406.
28. Bendik I, Friedel A, Roos FF, Weber P, Eggersdorfer M. Vitamin D: a critical and essential micronutrient for human health. Front Physiol 2014; 5: 248.
29. Larkin EK, Gebretsadik T, Koestner N, Newman MS, Liu Z, Carroll KN, et al. Agreement of blood spot card measurements of vitamin D levels with serum, whole blood specimen types and a dietary recall instrument. PLoS One 2011; 6: e16602. 30. VitAs (2013). Vitas Analytic Services. Available from: www.
vitas.no [cited 22 March 2014].
31. Norwegian Directorate of Health. Trends in the Norwegian diet 2010. Oslo: Norwegian Directorate of Health; 2011.
32. Kobayashi T, Kamimura M, Imai S, Toji C, Okamoto N, Fukui M, et al. Reproducibility and validity of the food fre-quency questionnaire for estimating habitual dietary intake in children and adolescents. Nutr J 2011; 10: 27.
33. Preston AM, Palacios C, Rodriguez CA, Velez-Rodriguez RM. Validation and reproducibility of a semi-quantitative food fre-quency questionnaire for use in Puerto Rican children. P R Health Sci J 2011; 30: 5864.
34. Henn RL, Fuchs SC, Moreira LB, Fuchs FD. Development and validation of a food frequency questionnaire (FFQ-Porto Alegre) for adolescent, adult and elderly populations from Southern Brazil. Cad Saude Publica 2010; 26: 206879.
35. Rockett HR, Breitenbach M, Frazier AL, Witschi J, Wolf AM, Field AE, et al. Validation of a youth/adolescent food frequency questionnaire. Prev Med 1997; 26: 80816.
children: implications of age and day-to-day variation in dietary intake. Public Health Nutr 1999; 2: 293300.
37. Vereecken CA, De Bourdeaudhuij I, Maes L. The HELENA online food frequency questionnaire: reproducibility and comparison with four 24-h recalls in Belgian-Flemish adoles-cents. Eur J Clin Nutr 2010; 64: 5418.
38. Araujo MC, Yokoo EM, Pereira RA. Validation and calibration of a semiquantitative food frequency questionnaire designed for adolescents. J Am Diet Assoc 2010; 110: 11707.
39. Brantsaeter AL, Haugen M, Alexander J, Meltzer HM. Validity of a new food frequency questionnaire for pregnant women in the Norwegian Mother and Child Cohort Study (MoBa). Matern Child Nutr 2008; 4: 2843.
40. Livingstone MB, Robson PJ, Wallace JM. Issues in dietary intake assessment of children and adolescents. Br J Nutr 2004; 92: S213S22.
41. Trolle E, Amiano P, Ege M, Bower E, Lioret S, Brants H, et al. Evaluation of 224-h dietary recalls combined with a food-recording booklet, against a 7-day food-record method among schoolchildren. Eur J Clin Nutr 2011; 65: S77S83.
42. Andersen LF, Øverby N, Lillegaard IT. Are there differences between what children eat on week days and weekend days? Barn: Norwegian Cente for Child Research 23, 8998; 2003. 43. Sichert-Hellert W, Kersting M, Schoch G. Underreporting
of energy intake in 1 to 18 year old German children and ado-lescents. Z Ernahrungswiss 1998; 37: 24251.
44. Edwards P, Roberts I, Clarke M, DiGuiseppi C, Pratap S, Wentz R, et al. Methods to increase response rates to postal ques-tionnaires. Cochrane Database Syst Rev2007; MR000008.
45. Trolle E, Amiano P, Ege M, Bower E, Lioret S, Brants H, et al. Feasibility of repeated 24-h dietary recalls combined with a food-recording booklet, using EPIC-Soft, among preschoolers. Eur J Clin Nutr 2011; 65: S84S6.
46. Overby NC, Serra-Majem L, Andersen LF. Dietary assessment methods on n-3 fatty acid intake: a systematic review. Br J Nutr 2009; 102: S56S63.
47. Serra-Majem L, Nissensohn M, Overby NC, Fekete K. Dietary methods and biomarkers of omega 3 fatty acids: a systematic review. Br J Nutr 2012; 107: S64S76.
48. Burrows T, Berthon B, Garg ML, Collins CE. A comparative validation of a child food frequency questionnaire using red blood cell membrane fatty acids. Eur J Clin Nutr 2012; 66: 8259.
49. Okuda M, Sasaki S, Bando N, Hashimoto M, Kunitsugu I, Sugiyama S, et al. Carotenoid, tocopherol, and fatty acid biomarkers and dietary intake estimated by using a brief self-administered diet history questionnaire for older Japanese children and adolescents. J Nutr Sci Vitaminol (Tokyo) 2009; 55: 23141.
50. Jacques PF, Sulsky SI, Sadowski JA, Phillips JC, Rush D, Willett WC. Comparison of micronutrient intake measured by a dietary questionnaire and biochemical indicators of micronu-trient status. Am J Clin Nutr 1993; 57: 1829.
51. Dahl L, Maeland CA, Bjorkkjaer T. A short food frequency questionnaire to assess intake of seafood and n-3 supplements: validation with biomarkers. Nutr J 2011; 10: 127.
52. Pedersen JI. Vitamin D requirement and setting recommenda-tion levelscurrent Nordic view. Nutr Rev 2008; 66: S165S9. 53. Brantsaeter AL, Haugen M, Hagve TA, Aksnes L, Rasmussen SE, Julshamn K, et al. Self-reported dietary supplement use is confirmed by biological markers in the Norwegian Mother and Child Cohort Study (MoBa). Ann Nutr Metab 2007; 51: 14654.
*Nina Cecilie Øverby
Department of Public Health, Sport and Nutrition Faculty of Health and Sport Sciences
University of Agder PO Box 422, NO-4604 Kristiansand
Norway