ABSTRACT: Objectives: To assess the validity and reproducibility of a food frequency questionnaire developed
for estimating the food consumption of adults in São Paulo, Brazil, based population study.Methods: A sample of
individuals aged above 20 years, of both genders, living in São Paulo, was used for the validation study (n = 77) and reproducibility study (n = 74) of the food frequency questionnaire. To verify the validity and reproducibility of energy and 19 nutrients were applied two food frequency questionnaires (60 items) and three 24-hour dietary recalls (24HR – reference method). The validity was veriied by Spearman correlation coeicient (crude and de-attenuated) and weighted Kappa, and reproducibility by intraclass correlation coeicients and weighted kappa.Results: In analyzes of validity de-attenuated correlation coeicients ranged from 0.21 (carbohydrate)
to 0.74 (energy), and weighted kappa exceeded 0.40 for 30% of the nutrients. Polyunsaturated fat and folate did not show signiicant correlation and weighted kappa. In reproducibility correlation coeicients ranged from 0.36 (polyunsaturated fat) to 0.69 (calcium), and weighted kappa exceeded 0.40 for 80% of the nutrients.
Conclusion: The food frequency questionnaire analyzed has good validity and reproducibility for estimating
the food consumption of adults in São Paulo compared to the reference method, so it is an appropriate instrument to be used in epidemiological studies on similar populations. Estimates of polyunsaturated fat and folate should be interpreted with caution.
Keywords: Diet surveys. Food-frequency questionnaire. Food consumption. Validation studies. Adult. São Paulo.
Validity and reproducibility of a food frequency
questionnaire for adults of São Paulo, Brazil
Validade e reprodutibilidade de um questionário
de frequência alimentar para adultos de São Paulo, Brasil
Soraya Sant’Ana de Castro SelemI, Aline Martins de CarvalhoI, Eliseu Verly-JuniorII,
Jackeline Venâncio CarlosI, Juliana Araujo TeixeiraI, Dirce Maria Lobo MarchioniI,
Regina Mara FisbergI
IDepartment of Nutrition, School of Public Health, Universidade de São Paulo – São Paulo (SP), Brazil.
IIDepartment of Epidemiology, Institute of Social Medicine,Universidade do Estado do Rio de Janeiro – Rio de Janeiro (RJ), Brazil.
Corresponding author: Regina Mara Fisberg. Departamento de Nutrição, Faculdade de Saúde Pública, Universidade de São Paulo.
Avenida Dr. Arnaldo 715, Cerqueira César, CEP 01246-904, São Paulo, SP, Brasil. E-mail: [email protected]
Conlict of interests: nothing to declare – Financial support: National Counsel of Technological and Scientiic Development (CNPq)
INTRODUCTION
In recent decades, the food frequency questionnaire (FFQ) has been the most used tool to assess food and nutrient intake in epidemiological studies, especially those whose goal is to relate dietary factors with health outcomes. This occurs due to the fact that this method is considered a survey that assesses usual diet presenting a low cost, easy application and processing, and generating information that allows sorting and categorizing of individuals according to exposure to certain dietary components1,2.
The development of an FFQ requires prior knowledge of food and nutrient intake in the population on which it will be applied. Usually, 24-hour dietary recalls (24HR) are applied in pilot studies, generating a database for establishment of food items that will make up the instrument, as well as the portion sizes3. Like any other instrument, the FFQ is not free of measurement errors. In this sense, validation and reproducibility studies are strategies to verify the accuracy and precision of their measurements4.
The FFQ developed by Fisberg et al.5 to estimate usual dietary intake of adults is the only one developed from a population-based study with a probability sample of the city of São Paulo, the most populous and multicultural city in Brazil. However, it is necessary to evaluate
RESUMO: Objetivos: Veriicar a validade e reprodutibilidade de um questionário de frequência alimentar desenvolvido
para estimar o consumo alimentar habitual de adultos do município de São Paulo, Brasil, com base em estudo populacional. Métodos: Foi utilizada amostra de indivíduos com 20 anos ou mais, de ambos sexos, residentes
no município de São Paulo, para o estudo de validação (n = 77) e reprodutibilidade (n = 74) do questionário de frequência alimentar. Para veriicar a validade e reprodutibilidade do consumo de energia e 19 nutrientes, aplicaram-se dois questionários de frequência alimentar e três recordatórios alimentares de 24 horas (R24h – método de referência).A validade foi veriicada por coeiciente de correlação de Spearman (bruto e deatenuado) e Kappa ponderado, e a reprodutibilidade por coeiciente de correlação intraclasse e Kappa ponderado. Resultados:
Nas análises de validade, os coeicientes de correlação deatenuados variaram de 0,21 (carboidrato) a 0,74 (energia), e o kappa ponderado excedeu 0,40 para 30% dos nutrientes. Gordura poli-insaturada e folato não apresentaram correlação e kappa ponderado signiicantes. Na reprodutibilidade, os coeicientes de correlação variaram de 0,36 (gordura poli-insaturada) a 0,69 (cálcio), e kappa ponderado excedeu 0,40 para 80% dos nutrientes. Conclusão:
O questionário de frequência alimentar analisado possui boa validade e reprodutibilidade para estimar o consumo alimentar habitual de adultos de São Paulo em relação ao método de referência, portanto é um instrumento apropriado para estudos epidemiológicos em populações similares. As estimativas de gordura poli-insaturada e folato devem ser interpretadas com cautela.
the performance of this instrument for its application in this population. The objective of this study was to verify the accuracy and precision of the instrument.
METHODS
THE INSTRUMENT
The FFQ, designed to assess the habitual consumption of adults of both sexes during the year preceding its application, had as basis for its development dietary information obtained through a 24HR applied in a random sample of individuals aged 20 years or more (n = 1,477) residing in the city of São Paulo. This information was obtained in the Health Survey (ISA-Capital) study conducted in 2003. Foods that contributed up to 90% for the consumption of energy and nutrients were included and grouped, as well as foods that are sources of nutrients and that could discriminate the study subjects according to levels of consumption. The FFQ consists of 60 food items with frequencies of 0 – 10 times, and a unit of time: day, week, month and year. The portions were deined as small, medium, large and extra large, which correspond to the 25, 50, 75 and 95th percentiles of the consumption in grams of each food item. The median portion is the reference serving size, and is presented in household measures and in grams. Food items are organized into: soups and pasta, meat and ish, dairy products, legumes and eggs, rice and tubers, vegetables, sauces and spices, fruits, beverages, breads and biscuits, sweets and desserts. The FFQ also presents questions about recent changes in eating habits, consumption of dietary supplements, other important foods consumed that the instrument did not include, as well as consumption of visible fat from meat and skin from poultry5.
STUDY POPULATION AND DATA COLLECTION
the second visit. Also, 20 individuals who presented under- and overestimation of food consumption were excluded from the analysis, according to the method proposed by Nielsen6. At the end, 77 individuals (34 men and 43 women) responded to the three 24HR and to the second FFQ, and 74 (32 men and 42 women) responded to the two FFQ.
For the application of the 24HR, a standard form and the Multiple Pass Method, developed by the United States Department of Agriculture (USDA) to assist in the collection of food consumption data, were used, minimizing errors in the measurement of diet7. The 24HR were applied so that all days of the week and seasons were represented. The standardization and quantification of foods and preparations were performed according to national recommendations, which allowed the conversion of household measurements in units of weight or volume8,9.
To quantify the energy and nutrients consumed, obtained by the FFQ and 24HR, the Nutrition Data System for Research software (version 2007, 2007, University of Minnesota, Minneapolis) was used.
DATA ANALYSIS
The following were selected for analysis: energy, protein, carbohydrates, iber, total fat, saturated fat, monounsaturated fat, polyunsaturated fat, trans fats, cholesterol, vitamin A, beta-carotene, folate, vitamin C, vitamin E, calcium, phosphorus, iron, zinc and sodium. In all Figure 1. Study diagram.
Year: 2003 Study: ISA-Capital 2003
Database for the development of the FFQ
Year: 2007/2008 Study: Prevalence of inadequate nutrient intake Application of FFQs and 24HR
1st home visit
1o R24HR
1st FFQ (“FFQ 1”)
Contact by phone 2nd R24HR
2nd home visit
3rd R24HR
2nd FFQ (“FFQ 2”)
Time interval: 6 months
analyzes regarding intake of nutrients (validation and reproducibility), intakes of nutrients values were used, adjusted for energy intake by the residual method1.
Validity was determined by comparing the values of energy intake and each nutrient by the second FFQ (FFQ2, applied the second home visit) and the average of the three 24HR. The Spearman’s correlation coeicient and weighted Kappa were used to verify compliance according to consumption quartiles.
To minimize the efect of intra-subject variability of intake measured by the 24HR, each correlation coeicient was multiplied by a deattenuation coeicient. This was calculated using the following formula:
r
v = ro 1 + —
λ —12 n
(
)
(1)where λ is the ratio between intrapersonal variance and interpersonal intake variance; r
o
is the observed correlation, n is the number of days of 24HR and r
v is the deattenuated
correlation. The intra- and interpersonal variances were calculated for each nutrient using the method proposed by Iowa State University (ISU)10.
Reproducibility was checked by comparing the values of energy intake and each nutrient obtained by the irst FFQ (FFQ1, applied on the irst home visit) with those obtained by FFQ2, using the intraclass correlation and weighted Kappa to verify compliance according to consumption quartiles.
All statistical analyzes were performed using Stata software (version 10, 2007, StataCorp LP, College Station, Texas). A signiicance level of 5% was considered.
This study was approved by the Research Ethics Committee of the School of Public Health, University of São Paulo, and the participation was conditioned upon signing of a free and informed consent form. There are no conlicts of interest.
RESULTS
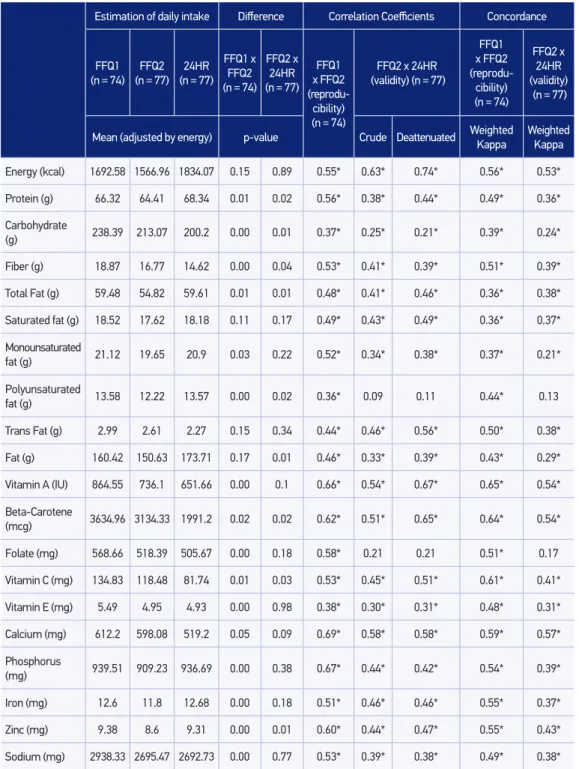
The average consumption of energy and 10 nutrients estimated by FFQ2 was similar to that estimated by 24HR. In comparison with FFQ1, FFQ2 underestimated the consumption of 15 nutrients (Table 1).
In validity analyzes, the correlation coeicients ranged from 0.25 (carbohydrates) to 0.63 (energy). After deattenuation, there was a higher correlation for 12 nutrients, and the coeicients ranged from 0.21 (carbohydrates) to 0.74 (energy). The weighted Kappa exceeded 0.40 for 30% of the nutrients analyzed, and 45% of the nutrients showed values between 0.30 and 0.40. Polyunsaturated fat and folate showed no signiicant correlation and weighted Kappa compared to the reference method (Table 1).
*p < 0.05, FFQ 1: food frequency questionnaire - application on the irst home visit, FFQ 2: food frequency questionnaire - application on the second home visit, 24HR: 24-hour dietary recall.
Table 1. Estimation of daily intake, correlation coeicients and concordance analysis to validation
and reproducibility analyses.
Estimation of daily intake Diference Correlation Coeicients Concordance
FFQ1
(n = 74) (n = 77)FFQ2 (n = 77)24HR
FFQ1 x
FFQ2 (n = 74)
FFQ2 x 24HR (n = 77)
FFQ1
x FFQ2
(reprodu-cibility) (n = 74)
FFQ2 x 24HR (validity) (n = 77)
FFQ1
x FFQ2
(reprodu-cibility) (n = 74)
FFQ2 x 24HR (validity) (n = 77)
Mean (adjusted by energy) p-value Crude Deattenuated Weighted Kappa
Weighted Kappa
Energy (kcal) 1692.58 1566.96 1834.07 0.15 0.89 0.55* 0.63* 0.74* 0.56* 0.53*
Protein (g) 66.32 64.41 68.34 0.01 0.02 0.56* 0.38* 0.44* 0.49* 0.36*
Carbohydrate
(g) 238.39 213.07 200.2 0.00 0.01 0.37* 0.25* 0.21* 0.39* 0.24*
Fiber (g) 18.87 16.77 14.62 0.00 0.04 0.53* 0.41* 0.39* 0.51* 0.39*
Total Fat (g) 59.48 54.82 59.61 0.01 0.01 0.48* 0.41* 0.46* 0.36* 0.38*
Saturated fat (g) 18.52 17.62 18.18 0.11 0.17 0.49* 0.43* 0.49* 0.36* 0.37*
Monounsaturated
fat (g) 21.12 19.65 20.9 0.03 0.22 0.52* 0.34* 0.38* 0.37* 0.21*
Polyunsaturated
fat (g) 13.58 12.22 13.57 0.00 0.02 0.36* 0.09 0.11 0.44* 0.13
Trans Fat (g) 2.99 2.61 2.27 0.15 0.34 0.44* 0.46* 0.56* 0.50* 0.38*
Fat (g) 160.42 150.63 173.71 0.17 0.01 0.46* 0.33* 0.39* 0.43* 0.29*
Vitamin A (IU) 864.55 736.1 651.66 0.00 0.1 0.66* 0.54* 0.67* 0.65* 0.54*
Beta-Carotene
(mcg) 3634.96 3134.33 1991.2 0.02 0.02 0.62* 0.51* 0.65* 0.64* 0.54*
Folate (mg) 568.66 518.39 505.67 0.00 0.18 0.58* 0.21 0.21 0.51* 0.17
Vitamin C (mg) 134.83 118.48 81.74 0.01 0.03 0.53* 0.45* 0.51* 0.61* 0.41*
Vitamin E (mg) 5.49 4.95 4.93 0.00 0.98 0.38* 0.30* 0.31* 0.48* 0.31*
Calcium (mg) 612.2 598.08 519.2 0.05 0.09 0.69* 0.58* 0.58* 0.59* 0.57*
Phosphorus
(mg) 939.51 909.23 936.69 0.00 0.38 0.67* 0.44* 0.42* 0.54* 0.39*
Iron (mg) 12.6 11.8 12.68 0.00 0.18 0.51* 0.46* 0.46* 0.55* 0.37*
Zinc (mg) 9.38 8.6 9.31 0.00 0.01 0.60* 0.44* 0.47* 0.55* 0.43*
DISCUSSION
This study suggests that the FFQ developed to estimate usual dietary intake of adults in the city of São Paulo has good validity and reproducibility for most nutrients analyzed.
The underestimation of the second FFQ compared to the irst has been observed in other studies11,12. This may occur because the participants learn to respond to the questionnaire more accurately. And it is possible to assume that the overestimation of consumption of four nutrients (carbohydrates, iber, beta-carotene and vitamin C) by FFQ2 in comparison with 24HR happens by overestimating the consumption of sources of these nutrients, such as fruits, a common bias among individuals seeking for social approval of their diet13. It is noteworthy that the overestimation of nutrients can hide the poor consumption of the population11.
The FFQ did not show good validity in estimating polyunsaturated fat and folate, a result observed in other studies4,14,15. Thus, it is considered that the estimates of polyunsaturated fat and folate should be interpreted with caution. Nevertheless, the performance of the analyzed FFQ can be considered satisfactory, and the results obtained are similar to other published studies, considering the diversity of these in relation to the study population, the reference method, the time elapsed between the surveys and other characteristics of the instrument14-16. The study has some strengths, such as the fact that the FFQ was developed based on a probability sample of São Paulo, the largest city in Brazil, with immigrants from all over the country and a diet that is inluenced by diferent cultures. In addition, there was an efort to seek the participants of the original study to evaluate the performance of the FFQ. The method for calculation of intra- and interpersonal variances used in the deattenuation is considered one of the best10. Finally, accuracy and precision were evaluated for energy and 19 nutrients, higher than in most published studies, which often refer only to the number of macronutrients.
There are also limitations to consider. Although statistical procedures aimed at correcting the correlation coeicients were applied, providing a better estimate, the reference method used has sources of errors in common with the FFQ, because it depends on the respondent’s memory and ability to recall and report the foods and portions consumed. The use of recovery biomarkers as the reference method in validation analysis could provide more reliable results for the study, but these tests are expensive, often invasive, besides being available for few nutrients. Thus, the use of 24HR is still a viable and widely used alternative3. The sample size may compromise the statistical power of the analysis, but reduced sample sizes are common in this type of study due to loss of follow-up11,12,17,18.
CONCLUSION
1. Willett WC. Nutritional epidemiology, 2nd edition. New York: Oxford UniversityPress; 1998.
2. Slater B, Philippi ST, Marchioni DML, Fisberg RM. Validação de Questionários de Freqüência Alimentar - QFA: considerações metodológicas. Rev Bras Epidemiol 2003; 6(3): 200-8.
3. Cade J, Thompson R, Burley V, Warm D. Development, validation and utilisation of food-frequency questionnaires – a review. Public Health Nutr 2001; 5(4): 567-87.
4. Teixeira JA, Baggio ML, Giuliano AR, Fisberg RM, Marchioni DML. Performance of the Quantitative Food Frequency Questionnaire Used in the Brazilian Center of the Prospective Study Natural History of Human Papillomavirus Infection in Men: The HIM Study. J Am Diet Assoc 2011; 111(7): 1045-51.
5. Fisberg RM, Colucci ACA, Morimoto JM, Marchioni DML. Questionário de freqüência alimentar para adultos com base em estudo populacional. Rev Saúde Pública 2008; 42(3): 550-4.
6. Nielsen SJ, Adair L. An alternative to dietary data exclusions. J Am Diet Assoc 2007; 107: 792-99.
7. Raper N, Perlof B, Ingwersen L, Steinfeldt L, Anand J. An overview of USDA’s Dietary Intake Data System. J Food Compost Anal 2004; 17(3-4): 545-55.
8. Fisberg RM, Villar BS. Manual de receitas e Medidas caseiras para Cálculo de Inquéritos Alimentares: manual elaborado para auxiliar o processamento de inquéritos alimentares. São Paulo: Signus; 2002.
9. Pinheiro ABV, Lacerda EM de A, Benzecry EH, Gomes MC da S, Costa, VM da. Tabela para Avaliação de Consumo Alimentar em Medidas Caseiras. 5. ed. São Paulo: Atheneu; 2008.
10. Nusser SM, Carriquiry AL, Dodd K, Fuller WA. A semiparametric transformation approach to estimating usual daily intake distributions. J Am Stata Assoc 1996; 91(436): 1440-9.
11. Barrat E, Aubineau N, Maillot M, Derbord E, Barthes P, Lescuyer J, et al. Repeatability and relative validity of a quantitative food-frequency questionnaire among French adults. Food & Nutrition Research 2012; 56. Disponível em: <http://www.foodandnutritionresearch.net/index. php/fnr/article/view/18472/24636>. (Acessado em 12 de dezembro de 2012).
12. Turconi G, Bazzano R, Roggi C, Cena H. Reliability and relative validity of a quantitative food-frequency questionnaire for use among adults in Italian population. Int J Food Sci Nutr 2010; 61(8): 846-62.
13. Monteiro CA, Moura EC, Jaime PC, Claro RM. Validade de indicadores do consumo de alimentos e bebidas obtidos por inquérito telefônico. Rev Saúde Pública 2008; 42(4): 582-9.
14. Henn RL, Fuchs SC, Moreira LB, Fuchs FD. Development and validation of a food frequency questionnaire (FFQ-Porto Alegre) for adolescent, adult and elderly populations from Southern Brazil. Cad. Saúde Pública 2010; 26(11) 2068-79.
15. Na YJ, Lee SH. Development and validation of a quantitative food frequency questionnaire to assess nutritional status in Korean adults. Nutr Res Pract 2012; 6(5) 444-50.
16. Salvo VLMA, Gimeno SGA. Reprodutibilidade e validade do questionário de freqüência de consumo de alimentos. Rev Saúde Pública 2002; 36(4): 505-12.
17. Mendes LL, Campos SF, Malta DC, Bernal RTI, Sá NNB, Velásquez-Meléndez G. Validade e reprodutibilidade de marcadores do consumo de alimentos e bebidas de um inquérito telefônico realizado na cidade de Belo Horizonte (MG), Brasil. Rev Bras Epidemiol 2011; 14(1 Supl): 80-9.
18. Lima FEL, Slater B, Latorre MRDO, Fisberg RM. Validade de um questionário quantitativo de frequência alimentar desenvolvido para população feminina no nordeste do Brasil. Rev Bras Epidemiol 2007; 10(4): 483-90.
Received on: 01/09/2014
Final version presented on: 02/19/2014 Accepted on: 04/29/2014