ACPD
14, 13817–13867, 2014Seasonal variability of nitrogen oxides and NMHC at Summit
L. J. Kramer
Title Page
Abstract Introduction
Conclusions References
Tables Figures
◭ ◮
◭ ◮
Back Close
Full Screen / Esc
Printer-friendly Version Interactive Discussion
Discussion
P
a
per
|
Discus
sion
P
a
per
|
Discussion
P
a
per
|
Discussion
P
a
per
|
Atmos. Chem. Phys. Discuss., 14, 13817–13867, 2014 www.atmos-chem-phys-discuss.net/14/13817/2014/ doi:10.5194/acpd-14-13817-2014
© Author(s) 2014. CC Attribution 3.0 License.
This discussion paper is/has been under review for the journal Atmospheric Chemistry and Physics (ACP). Please refer to the corresponding final paper in ACP if available.
Seasonal variability of atmospheric
nitrogen oxides and non-methane
hydrocarbons at the GEOSummit station,
Greenland
L. J. Kramer1, D. Helmig2, J. F. Burkhart3,6, A. Stohl3, S. Oltmans4,5, and R. E. Honrath1,†
1
Atmospheric Sciences Program/Dept. of Geological and Mining Engineering and Sciences, Michigan Technological University, Houghton, Michigan, USA
2
Institute of Arctic and Alpine Research, University of Colorado, Boulder, CO, USA
3
Norwegian Institute for Air Research (NILU), Kjeller, Norway
4
NOAA Earth System Research Laboratory, Boulder, CO, USA
5
CIRES, University of Colorado, Boulder, Colorado, USA
6
Now at Department of Geosciences, University of Oslo, Norway †
deceased
ACPD
14, 13817–13867, 2014Seasonal variability of nitrogen oxides and NMHC at Summit
L. J. Kramer
Title Page
Abstract Introduction
Conclusions References
Tables Figures
◭ ◮
◭ ◮
Back Close
Full Screen / Esc
Printer-friendly Version Interactive Discussion
Discussion
P
a
per
|
Discus
sion
P
a
per
|
Discussion
P
a
per
|
Discussion
P
a
per
|
Received: 1 May 2014 – Accepted: 8 May 2014 – Published: 27 May 2014 Correspondence to: L. J. Kramer (lkramer@mtu.edu)
ACPD
14, 13817–13867, 2014Seasonal variability of nitrogen oxides and NMHC at Summit
L. J. Kramer
Title Page
Abstract Introduction
Conclusions References
Tables Figures
◭ ◮
◭ ◮
Back Close
Full Screen / Esc
Printer-friendly Version Interactive Discussion
Discussion
P
a
per
|
Discus
sion
P
a
per
|
Discussion
P
a
per
|
Discussion
P
a
per
|
Abstract
Measurements of atmospheric NOx (NOx=NO+NO2), peroxyacetyl nitrate (PAN),
NOy and non-methane hydrocarbons (NMHC) were taken at the GEOSummit
Sta-tion, Greenland (72.34◦N, 38.29◦W, 3212 m.a.s.l) from July 2008 to July 2010. The data set represents the first year-round concurrent record of these compounds
sam-5
pled at a high latitude Arctic site in the free troposphere. Here, the study focused on the seasonal variability of these important ozone (O3) precursors in the Arctic free tro-posphere and the impact from transported anthropogenic and biomass burning emis-sions. Our analysis shows that PAN is the dominant NOy species in all seasons at
Summit, varying from 49 % to 78 %, however, we find that odd NOy species (odd
10
NOy=NOy−PAN−NOx) contribute a large amount to the total NOy speciation with
monthly means of up to 95 pmol mol−1 in the winter and ∼40 pmol mol−1 in the sum-mer, and that the level of odd NOy species at Summit during summer is greater than
that of NOx. We hypothesize that the source of this odd NOyis most likely alkyl nitrates
from transported pollution, and photochemically produced species such as HNO3and
15
HONO.
FLEXPART retroplume analysis and tracers for anthropogenic and biomass burning emissions, were used to identify periods when the site was impacted by polluted air masses. Europe contributed the largest source of anthropogenic emissions during the winter and spring months, with up to 82 % of the simulated anthropogenic black carbon
20
originating from this region between December 2009 and March 2010, whereas, North America was the primary source of biomass burning emissions. Polluted air masses were typically aged, with median transport times to the site from the source region of 11 days for anthropogenic events in winter, and 14 days for BB plumes. Overall we find that the transport of polluted air masses to the high altitude Arctic typically
25
resulted in high variability in levels of O3 and O3 precursors. During winter, plumes
originating from mid-latitude regions and transported in the lower troposphere to Sum-mit often result in lower O3 mole fractions than background levels. However, plumes
ACPD
14, 13817–13867, 2014Seasonal variability of nitrogen oxides and NMHC at Summit
L. J. Kramer
Title Page
Abstract Introduction
Conclusions References
Tables Figures
◭ ◮
◭ ◮
Back Close
Full Screen / Esc
Printer-friendly Version Interactive Discussion
Discussion
P
a
per
|
Discus
sion
P
a
per
|
Discussion
P
a
per
|
Discussion
P
a
per
|
transported at higher altitudes can result in positive enhancements in O3 levels. It is therefore likely that the air masses transported in the mid-troposphere were mixed with air from stratospheric origin. Similar enhancements in O3and its precursors were also
observed during periods when FLEXPART indicated that biomass burning emissions impacted Summit. The analysis of anthropogenic events over summer show that
emis-5
sions of anthropogenic origin have a greater impact on O3 and precursor levels at
Summit than biomass burning sources during the measurement period, with enhance-ments above background levels of up to 16 nmol mol−1for O3and 237 pmol mol
−1
and 205 pmol mol−1, 28 pmol mol−1and 1.0 nmol mol−1for NOy, PAN, NOxand ethane,
re-spectively.
10
1 Introduction
The seasonality of ozone (O3) and its precursors for photochemical production, such
as NOx(NOx=NO+NO2), peroxyacetyl nitrate (PAN) and non-methane hydrocarbons (NMHC), in the remote Arctic troposphere is governed by a combination of transport pathways, photochemistry and stratospheric influx (Klonecki et al., 2003; Stohl et al.,
15
2006; Law and Stohl, 2007; Liang et al., 2011). Improving our knowledge on the sea-sonality of O3 and its precursors and the relative importance of source regions and
transport variability is essential as recent studies have suggested that tropospheric O3
may have a large impact on radiative forcing and climate feedbacks in the Arctic region (Shindell et al., 2006; Shindell, 2007; Quinn et al., 2008).
20
Polluted air masses originating from anthropogenic and biomass burning sources in the mid-latitude regions can transport long-lived reservoir species of NOx, such as PAN, and nitric acid (HNO3) to the arctic region (Wofsy et al., 1992; Wespes et al.,
2012), which may reform NOx and result in enhanced levels far downwind from the
emission sources (Beine et al., 1997; Walker et al., 2010). NMHC may also be
trans-25
ACPD
14, 13817–13867, 2014Seasonal variability of nitrogen oxides and NMHC at Summit
L. J. Kramer
Title Page
Abstract Introduction
Conclusions References
Tables Figures
◭ ◮
◭ ◮
Back Close
Full Screen / Esc
Printer-friendly Version Interactive Discussion
Discussion
P
a
per
|
Discus
sion
P
a
per
|
Discussion
P
a
per
|
Discussion
P
a
per
|
in emissions, transport pathway variability and the reaction with OH radicals (Jobson et al., 1994; Blake et al., 2003; Swanson et al., 2003).
Studies of pollution plumes with airborne, satellite- and ground-based observations and model simulations show that long-range transport from Europe and North America to the lower Arctic troposphere may constitute a large source of tropospheric O3 and
5
O3 precursors, whereas at higher altitudes, pollution plumes transported from Asia
become important (e.g. Klonecki et al., 2003; Law and Stohl, 2007; Shindell et al., 2008; Walker et al., 2012; Wespes et al., 2012). A large contribution to the seasonality of O3and O3precursors in the Arctic troposphere is due to variability in the location of
the Arctic polar front (Klonecki et al., 2003; Stohl, 2006). During winter in the Northern
10
Hemisphere, the polar front expands southward over North America, Europe and North Asia allowing direct transport of polluted air masses from sources within these latitudes to the Arctic. The Arctic polar front recedes in summer, reducing the impact of these pollution sources on the Arctic lower troposphere. However, it has been shown that the transport of emissions from biomass burning regions to the Arctic is possible during
15
summer (Stohl, 2006) and that they can strongly impact the atmosphere above Summit Station in Greenland (Stohl et al., 2006). Results from a modeling study by Walker et al. (2012) using tagged emissions from the global chemical transport model GEOS-Chem show that during summer the primary emissions that impact the production of O3 in
the Arctic region were from high latitude regions, whereas, during the fall and winter
20
periods, transport of emissions from mid-latitude regions in North America and Europe is possible.
A number of studies have discussed the seasonality of surface O3(Bottenheim et al., 1994; Beine et al., 1997; Monks, 2000; Browell et al., 2003; Helmig et al., 2007b; Walker et al., 2012), nitrogen oxides (Barrie and Bottenheim, 1991; Honrath and Jaffe, 1992;
25
Bottenheim et al., 1994; Muthuramu et al., 1994; Beine et al., 1997; Solberg et al., 1997; Dibb et al., 1998; Munger et al., 1999; Beine and Krognes, 2000; Stroud et al., 2003; Thomas et al., 2011) and NMHC (Jobson et al., 1994; Blake et al., 2003; Klonecki et al., 2003; Swanson et al., 2003; Helmig et al., 2014a) in the Arctic region. However,
ACPD
14, 13817–13867, 2014Seasonal variability of nitrogen oxides and NMHC at Summit
L. J. Kramer
Title Page
Abstract Introduction
Conclusions References
Tables Figures
◭ ◮
◭ ◮
Back Close
Full Screen / Esc
Printer-friendly Version Interactive Discussion
Discussion
P
a
per
|
Discus
sion
P
a
per
|
Discussion
P
a
per
|
Discussion
P
a
per
|
due to the logistical difficulties in measuring at remote Arctic locations, the majority of seasonal studies have taken place at coastal sites in Northern Europe, Canada, and Alaska, or focused on the late spring/summer periods. Seasonal and interannual studies of nitrogen oxides in the remote Arctic free troposphere are largely missing. The high altitude Arctic has negligible impact from local pollution sources, and local
5
production of NOxfrom PAN decomposition is expected to be small in this cold region.
Therefore, enhanced mole fractions of nitrogen oxides are primarily a result of long-range transported pollution from anthropogenic or biomass burning sources in Europe, North America, and Asia or of downward transport from the stratosphere (e.g. Liang et al., 2011). A build-up of O3 precursors during winter in the Arctic free troposphere
10
may have important implications for the tropospheric O3 budget in the mid-latitudes during late spring and early summer (Gilman et al., 2010). Modelling studies have postulated that air masses originating from the Arctic region can result in the transport of NOy and NMHC to the North Atlantic and enhance tropospheric O3 in this region due to the thermal decomposition of PAN (Honrath et al., 1996; Hamlin and Honrath,
15
2002).
This study utilizes 2 years of continuous measurements and model results to char-acterize the seasonally varying magnitude of O3and its precursors in the remote high
altitude Arctic and the potential impact from transported pollution. Year-round mea-surements of NOx, NOy, PAN, O3 and NMHC from the high altitude Greenland
Envi-20
ronmental Observatory at Summit (GEOSummit) station in Greenland are presented. The paper is structured as follows: in Sect. 2, the techniques to measure NO, NO2, NOy
(total reactive nitrogen oxides NOy=NO+NO2+PAN+HNO3+HONO+others), PAN and NMHC are presented and the FLEXPART Lagrangian particle dispersion model utilized in this study is discussed. Section 3.1 discusses the seasonal cycles of O3
pre-25
cursors at the measurements site and the NOyspeciation is investigated. In Sect. 3.2, the interannual variability and source contributions to enhanced O3 precursors from
ACPD
14, 13817–13867, 2014Seasonal variability of nitrogen oxides and NMHC at Summit
L. J. Kramer
Title Page
Abstract Introduction
Conclusions References
Tables Figures
◭ ◮
◭ ◮
Back Close
Full Screen / Esc
Printer-friendly Version Interactive Discussion
Discussion
P
a
per
|
Discus
sion
P
a
per
|
Discussion
P
a
per
|
Discussion
P
a
per
|
2 Experimental methods
2.1 GEOSummit Station
Measurements of NOx, NOy PAN and NMHC were performed at the GEOSummit Station (hereafter called Summit), Greenland (72.34◦N, 38.29◦W, 3212 m.a.s.l) from July 2008 to July 2010. Inlets for the instruments were installed ∼7.5 m above the
5
snowpack on a meteorological tower located approximately 660 m south-west of the main camp within the “clean air” sector. Tubing and cables were routed through a heated pipe to a buried laboratory facility.
2.2 Measurements
2.2.1 Nitrogen oxides 10
Measurement of NO, NO2 and NOy were performed with an automated O3
chemilu-minescence detection system (Ridley and Grahek, 1990). The system was developed at Michigan Technological University and is based on the same design that was used in Newfoundland in 1996 (Peterson and Honrath, 1999) and subsequently installed at the Pico Mountain Site from 2002 to 2010 (Val Martín et al., 2006). NO2and NOywere
15
detected by chemiluminescence after reduction to NO using a photolytic NO2converter
(Kley and Mcfarland, 1980) and a gold-catalyzed NOyconverter in the presence of CO,
respectively (Bollinger et al., 1983; Fahey et al., 1985). NOy is given as the sum of reactive nitrogen oxides. In the Arctic, NOy is primarily comprised of NO, NO2, PAN,
HNO3, HONO and particulate nitrate (p-NO
−
3). For the instrument used in this study,
20
a photolytic blue LED NO2converter (Air-Quality Design Inc., Colorado) was installed.
Photolytic converters have lower conversion efficiencies than molybdenum converters, however interferences from other species photolyzing to NO, such as HONO and PAN are reduced (Pollack et al., 2011; Villena et al., 2012). The sample mass flow controllers
ACPD
14, 13817–13867, 2014Seasonal variability of nitrogen oxides and NMHC at Summit
L. J. Kramer
Title Page
Abstract Introduction
Conclusions References
Tables Figures
◭ ◮
◭ ◮
Back Close
Full Screen / Esc
Printer-friendly Version Interactive Discussion
Discussion
P
a
per
|
Discus
sion
P
a
per
|
Discussion
P
a
per
|
Discussion
P
a
per
|
(MFC) and the NO2and NOyconverters were housed inside the inlet box on the tower to minimize the residence time of NOyspecies inside the PFA tubing.
During each measurement cycle of 10 min, the NO and NO2signals were recorded
as 30 s averages and NOy signals as 20 s averages, after a period of equilibration in each mode. Zero measurements of NO were performed at the start and end of each
5
measurement cycle by mixing O3 with the sample upstream of the reaction chamber.
The zero signals were measured to determine the interference signal in the reaction chamber, which was then subtracted from the measured signals. Calibration cycles, to determine the sensitivity of the instrument to NO and NO2 converter efficiency, were
performed every 12 h through the standard addition (10 cm3min−1) of∼1 mmol mol−1
10
of NO in nitrogen (N2) (Scott Marrin, Scott Specialty Gases) to the sample flow of 650 cm3min−1 at the inlet on the tower. In addition to the standard calibrations, a cali-bration was performed every 3 days to determine the conversion efficiency of the NOy
converter and artifacts for NOy, NO and NO2were measured via sampling NOxfree air (Breathing air grade, Airgas, Radnor, PA, USA). The final datasets were corrected for
15
this artifact.
The variability in the 20 and 30 s averaged data was compared to the expected value from photon counting statistics which are treated as a Poisson distribution. Mea-surements with variability greater than 3 times the Poisson value were then removed from the final dataset (∼4 % were removed with this filter). Evaluation of these
peri-20
ods shows that they typically occur when the wind direction was from the main camp, confirming that local pollution is the main source of the variability. Additional filtering processes were implemented to remove bad data caused by (1) spikes from electronic noise or intermittent instrument malfunctions; (2) high variability due to periods when the skiway was groomed or periods not captured in the Poisson statistics filter and (3)
25
ACPD
14, 13817–13867, 2014Seasonal variability of nitrogen oxides and NMHC at Summit
L. J. Kramer
Title Page
Abstract Introduction
Conclusions References
Tables Figures
◭ ◮
◭ ◮
Back Close
Full Screen / Esc
Printer-friendly Version Interactive Discussion
Discussion
P
a
per
|
Discus
sion
P
a
per
|
Discussion
P
a
per
|
Discussion
P
a
per
|
The NO, NO2, NOx and NOy data used in this work were further averaged over a 30 min period. NOx was determined as the sum of the NO and NO2measurements
during each 10 min cycle. The overall uncertainty for the 30 min data is calculated from the root sum of the squares of the measurement accuracy, artifact uncertainty and precision. Maximum uncertainties for NO, NO2, NOx at 50 pmol mol
−1
are 10 %, 17 %
5
and 19 %. For NOy, the uncertainty at 200 pmol mol
−1
is<20 % and typically 9 %. Detection limits for the 30 min averages were determined from the 2σ precision of the instrument and error in the artifact. Detection limits for NO, NO2, NOx and NOy are 4 pmol mol−1, 8 pmol mol−1, 9 pmol mol−1and 7 pmol mol−1, respectively. Measure-ments below the detection limit were included in all averaging calculations to ensure
10
the final values were not biased. Further details on the calibrations performed and the precision and accuracy of the measurements are given in the Supplement.
2.2.2 Peroxy-acetyl nitrate
A commercial PAN gas chromatography analyzer (PAN-GC, Metcon, Inc., Boulder, CO) was installed alongside the NOxyinstrument to determine PAN mole fractions. The PAN
15
instrument is based on gas chromatography with electron capture detection (GC-ECD). The instrument was equipped with a preconcentration unit to improve the detection limit whilst allowing for PAN sampling every 10 min. The preconcentration unit traps PAN and carbon tetrachloride (CCl4) on a peltier cooled (5
◦
C) capillary column prior to injection onto the main GC column which was set to a temperture of 13◦C to reduce the thermal
20
decomposition of PAN. Ultra-pure nitrogen gas (99.9999 % purity) was used as the carrier gas for the PAN-GC.
The instrument was calibrated approximately every week using a known amount of PAN, which was photochemically produced from the same NO-calibration gas used for the NOxyinstrument described in Sect. 2.2.1. The NO gas was delivered to a reaction
25
cell inside the PAN calibration unit which contained a UV mercury lamp to photolyze an excess of acetone (in zero air) which reacts with the NO gas to form PAN. The PAN
ACPD
14, 13817–13867, 2014Seasonal variability of nitrogen oxides and NMHC at Summit
L. J. Kramer
Title Page
Abstract Introduction
Conclusions References
Tables Figures
◭ ◮
◭ ◮
Back Close
Full Screen / Esc
Printer-friendly Version Interactive Discussion
Discussion
P
a
per
|
Discus
sion
P
a
per
|
Discussion
P
a
per
|
Discussion
P
a
per
|
calibration gas was sent to the inlet on the tower and then sampled by the GC-ECD. The conversion efficiency of NO to PAN was determined at the beginning and end of the measurement period through the standard addition of NO/NO2to the NOxyinstrument.
The conversion efficiency remained relatively constant throughout the measurement period at 96±1 %.
5
The sensitivities determined from the weekly PAN calibrations were interpolated to the measurements to take into account any drifting. CCl4was also used as an internal reference during periods when calibrations were not taken (Karbiwnyk et al., 2003). The atmospheric concentration of CCl4 should be relatively constant; therefore any
changes in the CCl4peak area would be caused by changes in the instrument
sensitiv-10
ity. During a period between 28 February 2009 and 17 May 2009 there was a gap in the calibrations caused by a blockage in the tubing that delivered the PAN calibration gas to the inlet. During this period the relationship between the CCl4 peak area and PAN
sensitivity from the previous calibrations was used to obtain the PAN sensitivity. Over the duration of the measurement period the detector became dirty resulting in drifting
15
and a noisy baseline. Due to this issue no data after 28 April 2010 were included in the analyses here.
Similarly to the NOx and NOy data, the PAN measurements were averaged over
30 min. The total uncertainty for the 30 min averaged PAN mole fractions was deter-mined from the precision of the instrument (estimated as 2σN0.5, whereNis the
num-20
ber of points averaged in 30 min (N=3)) and the uncertainty in the calibration standard. Uncertainty in the PAN calibration standard is associated with uncertainties in (a) the calculation of the NO addition, (b) the conversion of NO to PAN from the calibration unit and (c) variability in the PAN sensitivity between calibrations. The total uncertainty was estimated to be 16 % during normal operation. This value increased to 22 % during the
25
period in spring 2009 when there were no calibrations.
ACPD
14, 13817–13867, 2014Seasonal variability of nitrogen oxides and NMHC at Summit
L. J. Kramer
Title Page
Abstract Introduction
Conclusions References
Tables Figures
◭ ◮
◭ ◮
Back Close
Full Screen / Esc
Printer-friendly Version Interactive Discussion
Discussion
P
a
per
|
Discus
sion
P
a
per
|
Discussion
P
a
per
|
Discussion
P
a
per
|
each chromatogram. The limit of detection was highest during the first few months of operation up to November 2008 with a median value of 41 pmol mol−1. Despite the high LOD, 88 % of chromatograms were above the LOD during 2008. The LOD improved after this period with a median value of 15 pmol mol−1. The final PAN data set was not filtered for wind direction as analyses showed that there was no obvious influence from
5
camp pollution on the PAN measurements.
2.2.3 Non-methane hydrocarbons
NMHC were continuously sampled using a fully automated and remotely controlled GC system that was specifically designed for this study. Details of the setup at Summit are given in Helmig et al. (2014a). The GC is a further development of the instrument
oper-10
ated at the Pico Mountain Observatory and described in detail by (Tanner et al., 2006). The instrument provided ∼6000 ambient measurements of C2–C6 hydrocarbons, in
addition to∼1000 blank and standard runs from June 2008 to July 2010. The inlet for the GC instrument was installed on the same tower as the PAN, NOy and NOx inlets. The instrument relies on a cryogen-free sample enrichment and injection system. All
15
consumable gases were prepared at the site with a hydrogen generator, compressor, and air purification system. Aliquots of the sample stream were first passed through a water trap to dry the air to a dew point of−30◦C, then through an ozone scrubber, and NMHC were then concentrated on a Peltier-cooled (−25◦C) multi-stage adsorbent trap. Analysis was accomplished by thermal desorption and injection onto an aluminum
20
oxide (Al2O3) porous layer open tubular (PLOT) column for cryogen-free separation on a SRI Model 8610 GC with flame ionization detection (FID). Blanks and standard samples were injected regularly from the manifold. The gravimetric and whole air stan-dards that were used were cross-referenced against our laboratory scale for volatile or-ganic compounds, which has been cross-referenced against national and international
25
scales, including through two previous audits by the World Calibration Centre for VOC. At 100 pptv mole fraction, analytical accuracy and precision are typically better than
ACPD
14, 13817–13867, 2014Seasonal variability of nitrogen oxides and NMHC at Summit
L. J. Kramer
Title Page
Abstract Introduction
Conclusions References
Tables Figures
◭ ◮
◭ ◮
Back Close
Full Screen / Esc
Printer-friendly Version Interactive Discussion
Discussion
P
a
per
|
Discus
sion
P
a
per
|
Discussion
P
a
per
|
Discussion
P
a
per
|
3–5 %, yielding a combined uncertainty estimate of ∼5 %. The instrument achieves low single digit pmol mol−1detection limits.
2.2.4 Ozone
Surface O3 was measured by an O3 analyzer located in the Temporary Atmospheric
Weather Observatory (TAWO) building a few hundred meters from camp by the
Na-5
tional Oceanic and Atmospheric Administration (NOAA) as part of the core atmo-spheric measurements that began in 2000 (Petropavlovskikh and Oltmans, 2012). Hourly averaged data for 2008, 2009 and 2010 were downloaded from the Earth System Research Laboratory Global Monitoring Division (ESRL-GMD) website (http: //www.esrl.noaa.gov/gmd/dv/data/).
10
2.2.5 FLEXPART
The Lagrangian particle dispersion model FLEXPART was utilized to identify potential periods when polluted air masses impacted the measurement site. FLEXPART sim-ulates atmospheric transport using wind fields from global forecast models to deter-mine source to receptor pathways of air masses (Stohl et al., 2005). The model was
15
driven with meteorological analysis data from the European Centre for Medium Range Weather Forecasts (ECMWF) and run backward in time in so-called “retroplume” mode (Stohl et al., 2003). Every 3 h 40 000 particles were released from the measurement site location and followed backwards in time for 20 days. Sensitivities to anthropogenic and fire emissions were determined during the backwards simulations and are
propor-20
tional to the particle residence time over the source areas. In this work a black carbon tracer was used to simulate both anthropogenic (BCanthro) and biomass burning
emis-sions (BCfire). The BC tracer was susceptible to both wet and dry deposition during
transport. The wet deposition process is simplified in the simulations (no ageing of BC with conversion from hydrophobic to hydrophilic properties) and may result in an
ACPD
14, 13817–13867, 2014Seasonal variability of nitrogen oxides and NMHC at Summit
L. J. Kramer
Title Page
Abstract Introduction
Conclusions References
Tables Figures
◭ ◮
◭ ◮
Back Close
Full Screen / Esc
Printer-friendly Version Interactive Discussion
Discussion
P
a
per
|
Discus
sion
P
a
per
|
Discussion
P
a
per
|
Discussion
P
a
per
|
underestimation of the BC tracer (Stohl et al., 2013). However, for this study the tracer was only used to identify events; therefore absolute BC values were not required.
3 Results and discussion
3.1 Seasonal cycles
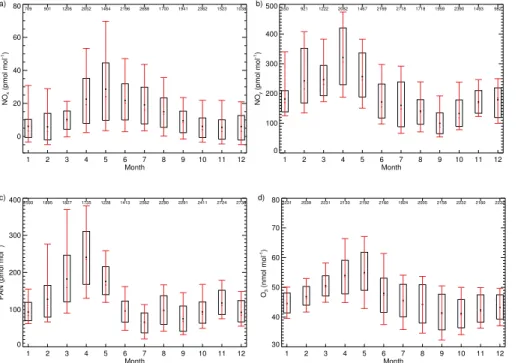
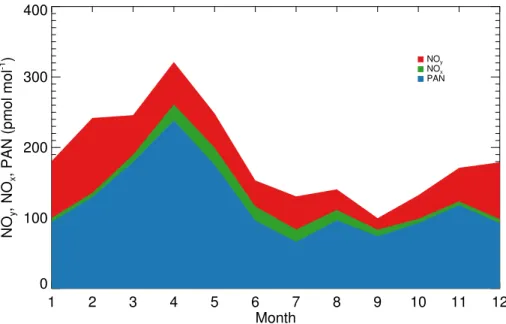
3.1.1 Reactive nitrogen oxides 5
Figure 1a–d shows the statistical analyses of the monthly averaged NOx, NOy, and PAN
ambient mole fractions, respectively, during the measurement period from July 2008 to July 2010, and results for O3from January 2008 to December 2010. A malfunction with the NOxy instrument resulted in missing NOx and NOy data from 24 November 2008
to 30 March 2009, hence the number of 30 min averages included in the monthly
dis-10
tribution is much lower for December to March than for other months as indicated by the values at the top of each plot. Seasonal cycles are observed in measured ambient mole fractions of NOx, NOy and PAN, with higher levels for all species during the late
winter/early spring period and lower mole fractions from summer to fall. The positively skewed whiskers indicate that air masses with elevated levels of the measured species
15
were sampled year round. Anthropogenic and biomass burning emissions transported to the site from North America and Europe are a major source of these enhancements in NOx, NOy and PAN (see Sect. 3.2). Observations from the Arctic Research of the
Composition of the Troposphere from Aircraft and Satellites (ARCTAS) mission in 2008 show that the transport of air from the Arctic stratosphere to the upper troposphere
20
may also result in elevated levels of O3precursors such as NOx, HNO3and PAN above
5 km (Liang et al., 2011). Therefore, high mole fractions observed in PAN, NOy and
NOx, may also be the result of sampling air masses mixed with those originating from the stratosphere and upper troposphere.
ACPD
14, 13817–13867, 2014Seasonal variability of nitrogen oxides and NMHC at Summit
L. J. Kramer
Title Page
Abstract Introduction
Conclusions References
Tables Figures
◭ ◮
◭ ◮
Back Close
Full Screen / Esc
Printer-friendly Version Interactive Discussion
Discussion
P
a
per
|
Discus
sion
P
a
per
|
Discussion
P
a
per
|
Discussion
P
a
per
|
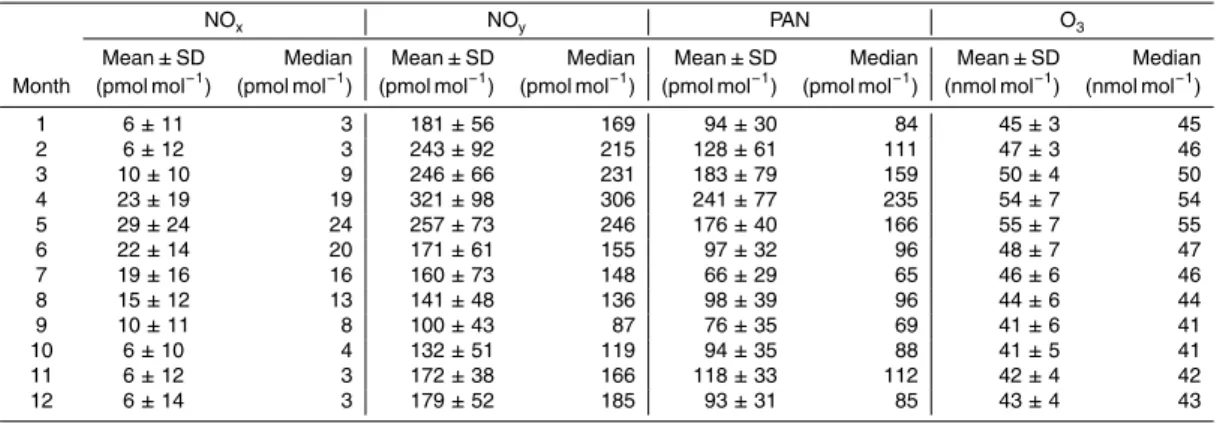
Table 1 gives a statistical summary for the monthly averages of PAN, NOy, NOxand O3 during 2008–2010. Maxima in monthly mean mole fractions of PAN and NOy were
observed in April with mean levels of 241±77 (1σ) pmol mol−1and 321±98 pmol mol−1 respectively. PAN mole fractions at Summit and the magnitude of the PAN springtime peak are consistent with observations at other high latitude sites such as Zeppelin
5
Mountain, Svalbard (Beine et al., 1997; Solberg et al., 1997; Beine and Krognes, 2000) and Alert, Northwest Territories, Canada (Worthy et al., 1994; Dassau et al., 2004). There is a rapid transition towards lower levels of PAN in the summer, with a mini-mum mean monthly average of 66±29 pmol mol−1in July. NOy mole fractions do not decrease as quickly from spring to summer as PAN and reach a minimum monthly
10
average of 100 pmol mol−1 in September. We find that the PAN and NOy summer
mole fractions observed here are comparable to previous measurements performed at the same site in 1998 and 1999, when observed PAN levels were typically 20– 150 pmol mol−1 and NOy levels ranged between 100–300 pmol mol
−1
(Honrath et al., 1999; Ford et al., 2002). The slower decrease in NOyfrom spring to summer, compared
15
to PAN, is a result of the presence of NOx and odd NOy(odd NOy=NOy−PAN−NOx)
over the summer months and is discussed further below.
The seasonal cycle of PAN is governed by the rate of thermal decomposition and transport patterns. The warmer summer temperatures result in the decomposition of PAN during long range transport, additionally, during the summer months the polar
20
front recedes north, thus reducing the potential for anthropogenic emissions to reach the measurement site (Beine and Krognes, 2000; Stohl, 2006). Measurements have shown that PAN is typically the largest contributor to NOyin the Arctic, due to the rapid
formation of PAN near the source region and a long lifetime in the free troposphere (Solberg et al., 1997; Munger et al., 1999; Ford et al., 2002; Alvarado et al., 2010;
25
Singh et al., 2010; Liang et al., 2011). However, there have been very few studies on the seasonal variability of the NOyspeciation in the Arctic due to limited measurements
ACPD
14, 13817–13867, 2014Seasonal variability of nitrogen oxides and NMHC at Summit
L. J. Kramer
Title Page
Abstract Introduction
Conclusions References
Tables Figures
◭ ◮
◭ ◮
Back Close
Full Screen / Esc
Printer-friendly Version Interactive Discussion
Discussion
P
a
per
|
Discus
sion
P
a
per
|
Discussion
P
a
per
|
Discussion
P
a
per
|
The results plotted in Fig. 2 show that PAN is the dominant form of NOyall year round, with monthly average [PAN]/[NOy] ratios reaching a maximum of 78 % in April and
a minimum of 49 % in July. Over the summer, NOxcontributes approximately 10–13 %
to the total NOy. In winter this decreases to.4 % and often NOxlevels were below the dectection limit of the instrument. What is particularly striking about the NOyspeciation
5
shown in Fig. 2 is that odd NOylevels can be significant, particularly over winter, when
they reach a maximum monthly mean of 95±36 pmol mol−1 (mean ± SD) in Febru-ary. Odd NOy decreases to approximately 30–50 pmol mol
−1
in the summer months; however, this still accounts for∼20–38 % of the total NOyduring this period.
Snowfall rates increase during the summer months over Summit (Dibb and
Fahne-10
stock, 2004) therefore an increase in deposition of water-soluble species such as HNO3
to the snowpack may result in the depletion of ambient odd NOy in the summer. The increase in solar radiation may also play an important role in the reduction of odd NOy species in the summer. Solberg et al. (1997) observed a decrease in odd NOy
with increasing solar UV radiation in Spitsbergen, Norway. The authors suggested that
15
species such as HONO, HNO3, NO3, N2O5, HO2NO2, and alkyl nitrates may contribute
to NOy over the winter with the impact reducing in spring due to an increase in
pho-tolysis. A study on the seasonal variability of alkyl nitrates at Summit in 1998–1999 found that the light C1–C4 alkyl nitrates peak through late winter until April with total
mole fractions between 30 and 42 pmol mol−1(Swanson et al., 2003). Therefore, alkyl
20
nitrates could account for a large portion of the odd NOy observed during the winter months at Summit. However, there still remains a large fraction of NOy unaccounted
for over winter and further measurements are required to determine both the species and sources of this odd NOy.
The seasonal cycle for NOx does not follow PAN and NOy at Summit. As shown in
25
Table 1, monthly mean NOxlevels peak one month later than NOyand PAN, increasing
from 6±11 pmol mol−1 in February to 29±24 pmol mol−1 in May, coinciding with an increase in solar radiation. Thus, the relative contribution of NOxto NOymaximizes over
ACPD
14, 13817–13867, 2014Seasonal variability of nitrogen oxides and NMHC at Summit
L. J. Kramer
Title Page
Abstract Introduction
Conclusions References
Tables Figures
◭ ◮
◭ ◮
Back Close
Full Screen / Esc
Printer-friendly Version Interactive Discussion
Discussion
P
a
per
|
Discus
sion
P
a
per
|
Discussion
P
a
per
|
Discussion
P
a
per
|
of PAN is a possible source of NOx during spring and summer months, however, the contribution is expected to be very small in this high latitude region as temperatures during the measurement period were always below 0◦C (Beine et al., 1997). Thus, the increase of NOx with radiation in spring suggests a possible photochemical source. The role of snowpack emissions on NOy species within the arctic boundary layer is
5
still uncertain, however, studies have suggested that photochemical reactions within the snowpack may result in the release of NOxand HONO to the overlying atmosphere (e.g., Honrath et al., 1999, 2000a, b, 2002; Munger et al., 1999; Beine et al., 2002; Dibb et al., 2002; Dominé and Shepson, 2002; Beine et al., 2003; Grannas et al., 2007).
During late spring to summer, odd NOy species can contribute over twice as much
10
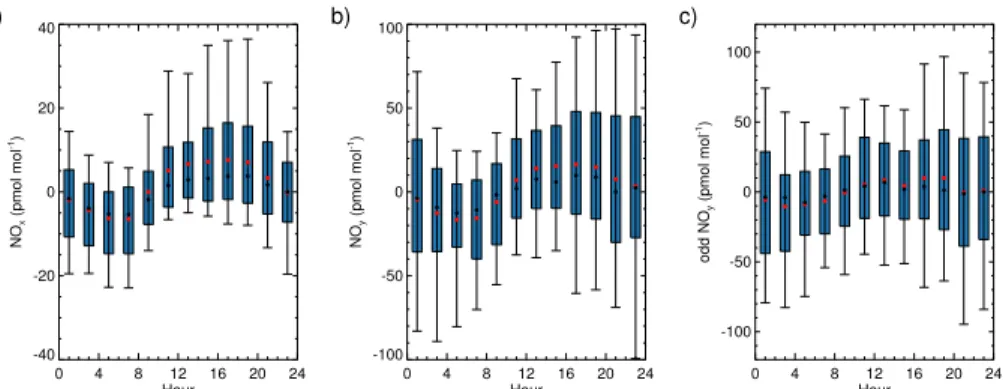
as NOx to the total NOy. To investigate the source of these species and the possible impact from snowpack photochemistry we have analyzed the diurnal variability of NOx,
NOy and odd NOy at Summit. Our measurements of NOx and NOy mole fractions at
a height of∼7.5 m above the snowpack display clear diurnal cycles from April–June (Fig. 3a, b). It is observed that the amplitude of the NOydiurnal cycle is greater than for
15
NOx, with average diurnal amplitudes of 33 pmol mol
−1
and 14 pmol mol−1for NOyand
NOx respectively. It has been hypothesized that photochemically produced odd NOy
species such as HNO3and HONO may account for some of the NOydiurnal variability at Summit (Ford et al., 2002). An analysis of the diurnal cycle for odd NOy(Fig. 3c)
av-eraged over April–June from 2008–2010 shows that the odd NOypeaks just after solar
20
noon in our measurements, suggesting a photochemically produced odd NOy species may be present. The diurnal variability of ambient NOyspecies above the snowpack is further complicated by vertical mixing and boundary layer dynamics, which may vary with season. For example, the downward transportation of pollution from aloft due to a growing boundary layer may result in a daytime maximum in NOx and NOy, which
25
then decreases at night due to surface uptake. There is also a possible contribution to odd NOy in the summer from long range transport of reactive nitrogen species such
ACPD
14, 13817–13867, 2014Seasonal variability of nitrogen oxides and NMHC at Summit
L. J. Kramer
Title Page
Abstract Introduction
Conclusions References
Tables Figures
◭ ◮
◭ ◮
Back Close
Full Screen / Esc
Printer-friendly Version Interactive Discussion
Discussion
P
a
per
|
Discus
sion
P
a
per
|
Discussion
P
a
per
|
Discussion
P
a
per
|
et al., 2012). It should also be noted that some of the variability in the NOy speci-ation discussed here may be influenced by uncertainties in the PAN measurements which increased in spring 2009. The year-round measurements obtained from Summit in 2008–2010 provide new insight on the relative role of photochemistry and boundary layer stability on diurnal cycles of nitrogen oxides and is the subject of future
investiga-5
tion.
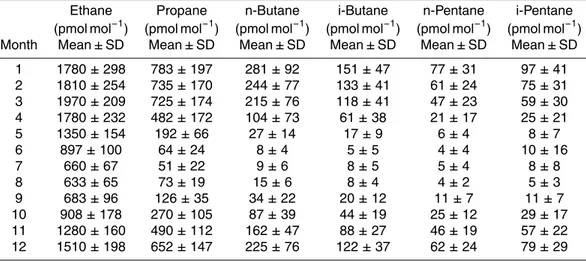
3.1.2 Non-methane hydrocarbons
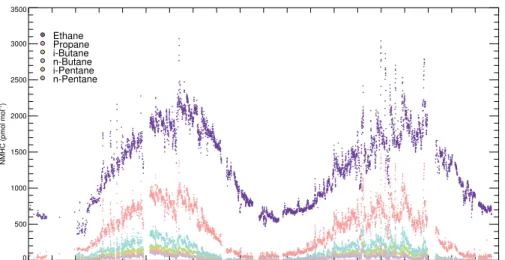
Figure 4 shows the results for the C2–C5alkane NMHC measured during 2008–2010
at Summit. The NMHC show a strong seasonal cycle with maximum mole fractions during the winter and early spring period and a rapid decline towards the summer
10
due to an increase in photochemical processing. The monthly mean averages for the C2–C5 NMHCs are given in Table 2. The phase of each NMHC is shifted due to the rate of reaction with OH. The lightest of the NMHC shown in Fig. 4 is ethane (C2H6),
which peaks in March with a monthly mean of 1974±209 pmol mol−1(mean±1σ) and reaches a minimum of 633±65 pmol mol−1in August. Heavier NMHC have lower mole
15
fractions and peak earlier in the year and reach a minimum earlier in summer as their rate of reaction with OH is much faster. The seasonal cycle of NMHC at Summit includ-ing NMHC firn air measurements from 2008 to 2010 have previously been presented in detail (Swanson et al., 2003; Helmig et al., 2014a, b).
The seasonality of NMHC can provide some insight into the potential for the
photo-20
chemical production of O3in the Artic troposphere. The accumulation of O3precursors, such as nitrogen oxides and NMHC over winter has been suggested as a potential in situ source of O3 that may contribute to the tropospheric O3 peak observed in spring
in the Arctic (e.g., Penkett et al., 1993; Honrath et al., 1996; Monks, 2000; Blake et al., 2003; Wang et al., 2003). Measurements of NMHC and O3 during the Tropospheric
25
Ozone Production about the Spring Equinox (TOPSE) campaign show that within the mid-troposphere, total NMHC decreased by∼6.2 ppbC from February to May and that O3increased by∼16 ppbv during the same period (Blake et al., 2003). The data from
ACPD
14, 13817–13867, 2014Seasonal variability of nitrogen oxides and NMHC at Summit
L. J. Kramer
Title Page
Abstract Introduction
Conclusions References
Tables Figures
◭ ◮
◭ ◮
Back Close
Full Screen / Esc
Printer-friendly Version Interactive Discussion
Discussion
P
a
per
|
Discus
sion
P
a
per
|
Discussion
P
a
per
|
Discussion
P
a
per
|
this study show similar results for NMHC, with the sum of the C2–C6NMHC decreasing by∼4.4 ppbC from February to May. The magnitude of the O3increase, at ∼8 ppbv,
is smaller than observed during TOPSE, however, the photochemical processing of NMHC in spring may contribute to the spring time peak of O3over Greenland.
3.2 Variability in ozone and its precursors from anthropogenic and biomass 5
burning emissions
In this section the interannual and short term variability in the measured species at Summit from 2008–2010 due to variability in transport pathways and the relative source contributions of pollutants from North America, Europe and Asia are investigated. An-thropogenic and biomass burning emissions are considered separately, over different
10
seasons.
3.2.1 Winter/spring anthropogenic impacts
Figure 4 shows that there is considerable variability in the NMHC mole fractions su-perimposed on the seasonal cycle; in particular during the winter months, suggest-ing polluted air masses were transported to the measurement site dursuggest-ing this period.
15
Mean±1σ mole fractions of ethane were 1.86±0.24 nmol mol−1 in December 2008 to March 2009 and 1.69±0.31 nmol mol−1 for December 2009 to March 2010. The 95th percentile values were the same for the two periods (2.2 nmol mol−1) suggesting that polluted air masses had a strong impact during both seasons. However, the aver-age background level (given by the 20th percentile of the measurements during each
20
period) was lower in 2009/2010 (1.4 nmol mol−1) than 2008/2009 (1.6 nmol mol−1) sug-gesting that in 2009/2010 there was a greater number of clean air masses or periods with low emissions impacting the site.
FLEXPART tracer simulations indicate that during the months December to March, biomass burning events were limited to a∼1 week period in March 2009 (see Table 3);
25
ACPD
14, 13817–13867, 2014Seasonal variability of nitrogen oxides and NMHC at Summit
L. J. Kramer
Title Page
Abstract Introduction
Conclusions References
Tables Figures
◭ ◮
◭ ◮
Back Close
Full Screen / Esc
Printer-friendly Version Interactive Discussion
Discussion
P
a
per
|
Discus
sion
P
a
per
|
Discussion
P
a
per
|
Discussion
P
a
per
|
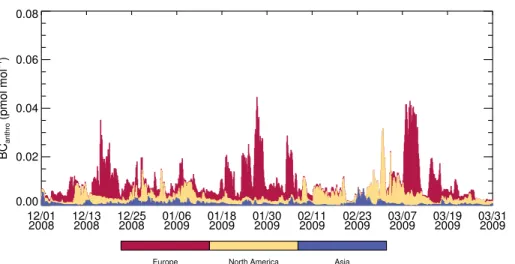
To investigate the source of the observed variability and the impact on ozone precursor levels at Summit, the anthropogenic tracer from FLEXPART retroplume simulations
(BCanthro) and NMHC emissions ratios were used to determine changes in the transport
pathways and relative source contributions of anthropogenic emissions from different continents.
5
An event with pollution transport was defined as identified when the BCanthro tracer
was greater than 75th percentile of the total BCanthroduring the 2 year measurement pe-riod (corresponding to BCanthro>0.0082 pmol mol
−1
) for a minimum of 12 h. The FLEX-PART temporal resolution for backward simulations is 3 h, so identifying events when the BCanthrowas enhanced for at least 12 h ensured that significant polluted air masses
10
impacted the site and also allowed for some temporal mismatches in simulated and observed plume arrivals. Using these thresholds, 42 events were identified in total for the periods December to March 2008/2009 and December to March 2009/2010 (21 events each season). FLEXPART retroplume analysis also provides information on the source contribution to these events, shown in Figs. 5 and 6. In 2008/2009, the BCanthro
15
tracers originating from North America and Europe accounted for 26 % and 69 %, re-spectively, to the total BCanthro tracer mass during the pollution events. In 2009/2010, North American emissions were much lower, contributing only 13 % of the total BCanthro
tracer mass, with European emissions dominating with 82 %. In both years impacts from Asian emissions were low (<6 %) and negligible from other continents. The mean
20
weighted age of the plume was calculated for each FLEXPART retroplume, to deter-mine the typical transport time for the events. The median time for polluted air masses to be transported to the site was approximately 11 days.
During each event, the mean ∆PAN, ∆NOy, ∆NOx,∆O3 and ∆C2H6 were
deter-mined, where∆is the enhancement above background levels (determined as the 20th
25
percentile for each species each month). For the 42 anthropogenic events identified, the mean enhancements during each event ranged between−35 and+273 pmol mol−1 for PAN, 0 to+25 pmol mol−1for NOx,−17 to+336 pmol mol
−1
for NOy,−3.9 to 7.5 for
O3, and−0.3 to+1.0 nmol mol
−1
for C2H6, with negative results representing less than
ACPD
14, 13817–13867, 2014Seasonal variability of nitrogen oxides and NMHC at Summit
L. J. Kramer
Title Page
Abstract Introduction
Conclusions References
Tables Figures
◭ ◮
◭ ◮
Back Close
Full Screen / Esc
Printer-friendly Version Interactive Discussion
Discussion
P
a
per
|
Discus
sion
P
a
per
|
Discussion
P
a
per
|
Discussion
P
a
per
|
20 % of the events for PAN, ethane, NOxand NOyand 26 % for O3. Negative enhance-ment values may be associated with erroneous transport simulated by FLEXPART as the mean enhancement for each species is dependent on the timing and length of the events as determined from FLEXPART. During the winter/spring period, there is a large gradient in O3 precursors with latitude (e.g. Moxim et al., 1996; Blake et al.,
5
2003), therfore, the transport of air masses from the south may also result in lower total mole fractions at Summit, despite pollution input from emission sources.
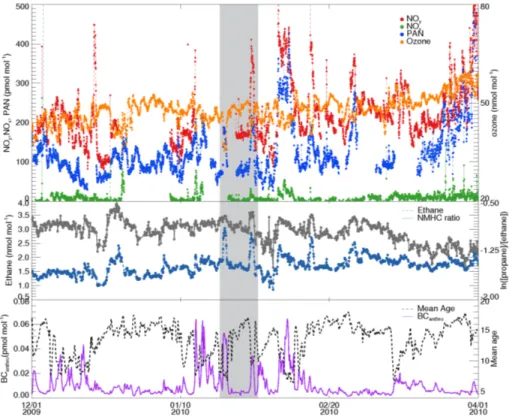
Figures 7 and 8 show a time series of the measurements between December and March for 2009/2010 and 2008/2009, respectively. During these periods, events with elevated ethane, NOy, PAN and NOx levels are observed; however, what is
particu-10
larly interesting is that during some of these events, low O3mole fractions (∆O3 <0) were measured. Analyses of∆O3and FLEXPART BC tracer masses from July 2008 to
July 2010 show that decreases in O3below the background level (when∆O3was
neg-ative for at least 12 h and reached a minimum∆O3 level below −2 nmol mol
−1
) were observed throughout the year. During April to September 45 events with low ozone
15
were observed, however, these events were typically associated with low levels of pol-lution with only 10 out of the 45 events classified as polluted (as indicated by either high FLEXPART BCanthro (>75th percentile) or BCfire(>90th percentile) tracers). For
the remaining 35 events enhancements in NOy, PAN and ethane were either low or negative, suggesting pollution levels were minimal in the sampled air masses.
20
Decreases in O3 (where the minimum ∆O3 <−2 nmol mol
−1
) that coincided with anthropogenic pollution events were observed during 28 periods from July 2008 to July 2010, with 21 of these events occurring between October and March, when sun-light is at a minimum. Thus, it is possible that the decrease in O3 observed during
winter/early spring is due to titration of O3 by NO within the sampled air mass soon
25
after emission (Eneroth et al., 2007; Hirdman et al., 2010). For example, from 23 to 31 January 2010 (indicated by the shaded area in Fig. 7), O3 decreased rapidly during
two periods, coinciding with increases in O3precursors. Using the vertically integrated
ACPD
14, 13817–13867, 2014Seasonal variability of nitrogen oxides and NMHC at Summit
L. J. Kramer
Title Page
Abstract Introduction
Conclusions References
Tables Figures
◭ ◮
◭ ◮
Back Close
Full Screen / Esc
Printer-friendly Version Interactive Discussion
Discussion
P
a
per
|
Discus
sion
P
a
per
|
Discussion
P
a
per
|
Discussion
P
a
per
|
meters per kg) simulated by FLEXPART, the overall pathways of the air masses during these events can be determined. As shown in Fig. 9a, the air mass on 23 January originated from Northern Europe and was transported to Summit in only a few days. The mean weighted age of the plumes estimated from FLEXPART during this period decreased from∼15 to 8 days (Fig. 7).
5
Studies have shown that NMHC ratios can provide an indication of the photochemi-cal aging of the air mass as the rate of reaction of different NMHC, and hence the ratio, is dependent on the amount of photochemical processing that occurs during transport (Parrish et al., 2004; Helmig et al., 2008; Honrath et al., 2008). High photochemical processing results in a decrease in the ln([propane]/[ethane]) ratio as propane reacts
10
more readily with OH than ethane. The two low ozone events between 23 and 31 Jan-uary 2010, coincided with enhancements in the ln([propane]/[ethane]) ratio suggest-ing low photochemical processsuggest-ing, and the impact of fresher air masses at the site. However, care must be taken when interpreting this result as dilution of the measured species during transport will also have an impact on the mole fractions measured at
15
the site. PAN and ethane reached peaks of 188 pmol mol−1and 3 nmol mol−1, respec-tively, during the event on 23 January, supporting the FLEXPART analyses which indi-cated a polluted air mass originating from Europe was sampled at the site (note there were no NOy or NOxdata available during this period). Ozone, however, decreased by
6.2 nmol mol−1below the monthly background level (O3(bkg)=41.6 nmol mol
−1
) to reach
20
a minimum level of 35.4 nmol mol−1. The FLEXPART retroplume on this day shows that air mass resided in the lower ∼2 km during transport, until 1 day upwind when the air mass ascended over the surface of Greenland to the measurement site (Fig. 9a), thereby reducing the potential to mix with high O3from stratospheric origin. In contrast,
a few hours later the transport patterns quickly changed, and the air masses sampled at
25
Summit originated from high altitudes over North Canada, as shown in Fig. 9b. As a re-sult, O3levels increased and PAN and ethane decreased back toward their background
levels (PAN(bkg)=72 pmol mol
−1
, C2H6(bkg)=1.55 nmol mol
−1
). Air originating from the high Arctic region was sampled at the site until 29 January, when the retroplume
ACPD
14, 13817–13867, 2014Seasonal variability of nitrogen oxides and NMHC at Summit
L. J. Kramer
Title Page
Abstract Introduction
Conclusions References
Tables Figures
◭ ◮
◭ ◮
Back Close
Full Screen / Esc
Printer-friendly Version Interactive Discussion
Discussion
P
a
per
|
Discus
sion
P
a
per
|
Discussion
P
a
per
|
Discussion
P
a
per
|
moved southward and air masses residing in the lower troposphere over North Amer-ica transported polluted air to Summit (Fig. 9c). From 29–30 January, ethane, NOy, PAN and NOx all increased again by 1.3 nmol mol
−1
, 267 pmol mol−1, 146 pmol mol−1 and 32 pmol mol−1respectively, from the calculated monthly background levels, and O3
decreased by 2 nmol mol−1.
5
Analyses of all the pollution events over winter and early spring indicate that low O3events from December to March typically coincide when sampling air masses orig-inating from either Europe or North America, which have resided in the lower tropo-sphere until ascending over Greenland to the measurement site (examples of FLEX-PART retroplumes are shown in Fig. S1a–e in the Supplement). In contrast, periods
10
identifed during winter as pollution events with positive O3 enhancement values
oc-curred when the air masses resided in the mid-troposphere during transport to the site (Fig. S2a and b in the Supplement), thus allowing for greater mixing with air from high tropospheric or stratospheric origin.
In this study the impact from anthropogenic emissions, as identified through
FLEX-15
PART retroplume analyses, were the primary focus. However, enhancements in the measured species were also observed during periods which are not correlated with pollution events simulated by FLEXPART. For example, between 12 February and 1 March 2010, Fig. 7 shows two periods when enhancements in PAN, NOy, and ethane
that do not coincide with high FLEXPART BCanthrotracer are observed. Analysis of the
20
BCfire tracer from FLEXPART also indicated no pollution plume from biomass burning
origin. The retroplume analysis shows that air masses from these two events were transported over the far north region of Canada and remained in the arctic for many days before arriving at Summit. It is unlikely that the air sampled was from a strato-spheric origin, as ethane levels were high and ozone decreased during these events.
25
It is possible that there may be an error in the simulated retroplume by FLEXPART or that the pollution originated prior to the 20 day simulation. Further investigations are necessary to determine the cause of these events and enhancements in the O3
ACPD
14, 13817–13867, 2014Seasonal variability of nitrogen oxides and NMHC at Summit
L. J. Kramer
Title Page
Abstract Introduction
Conclusions References
Tables Figures
◭ ◮
◭ ◮
Back Close
Full Screen / Esc
Printer-friendly Version Interactive Discussion
Discussion
P
a
per
|
Discus
sion
P
a
per
|
Discussion
P
a
per
|
Discussion
P
a
per
|
3.2.2 Summer impact from biomass burning and anthropogenic events
The extended whiskers shown on the plots in Fig. 1 indicate a large amount of vari-ability in the O3 precursors during the summer months. Radiation, surface emissions,
boundary layer height and changes in air mass sampling may all contribute to the vari-ability observed, which is typically in the range of hours to days. Anthropogenic
emis-5
sion impacts tend to be lower in the summer due to reduced transport from source regions, however pollution from anthropogenic and, especially, BB emissions can still impact the center of Greenland (Stohl, 2006), resulting in elevated mole fractions for short periods (Stohl et al., 2006). Studies based on aircraft measurements and models during the ARCTAS campaigns in both spring and summer 2008 show that biomass
10
and anthropogenic plumes can result in elevated NOx, NOy, PAN and hydrocarbons in
the Arctic (e.g., Alvarado et al., 2010; Singh et al., 2010; Hornbrook et al., 2011; Liang et al., 2011).
The BCfiretracer from FLEXPART was used to identify periods at Summit that were
potentially impacted by BB emissions. FLEXPART has been used to identify long
15
range transport of biomass burning emissions in many studies (e.g., Brioude et al., 2007; Stohl et al., 2007; Lapina et al., 2008; Quennehen et al., 2011, 2012; Schmale et al., 2011; Cristofanelli et al., 2013). However, due to potential inaccuracies with the FLEXPART simulation of transport pathways, fire identification and tracer emis-sion uncertainties, BB events identified may be under or overestimated. Biomass
burn-20
ing events were characterized as having a FLEXPART BCfire tracer>90th percentile
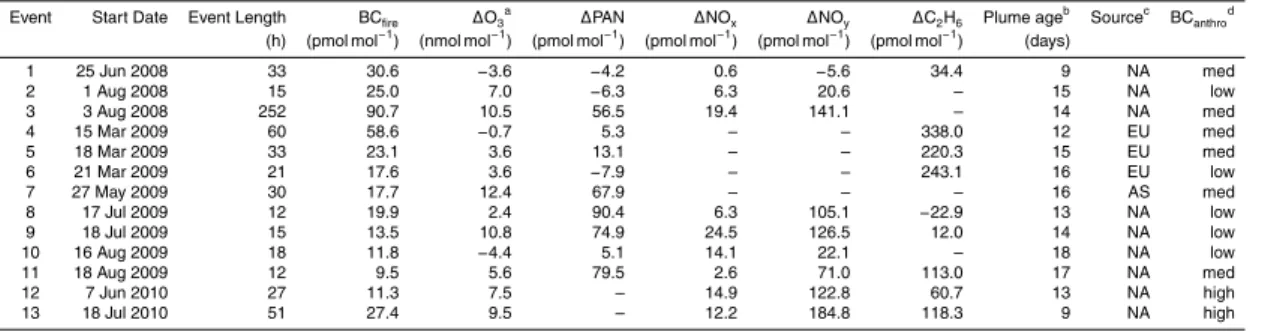
(≃7 pmol mol−1). In total, 13 events were observed between July 2008 and July 2010 ranging in duration between 12 and 252 h. Details regarding the start date, duration, mean plume age, FLEXPART tracer levels and trace gas levels for each event are shown in Table 3. A more conservative threshold was applied here than for the
anthro-25
pogenic emissions in Sect. 3.2.1, so the events identified had significant BB but small anthropogenic signatures. Of these 13 events, 2 were identified as having potentially high anthropogenic signatures (BCanthro>75th percentile) and were most likely plumes
ACPD
14, 13817–13867, 2014Seasonal variability of nitrogen oxides and NMHC at Summit
L. J. Kramer
Title Page
Abstract Introduction
Conclusions References
Tables Figures
◭ ◮
◭ ◮
Back Close
Full Screen / Esc
Printer-friendly Version Interactive Discussion
Discussion
P
a
per
|
Discus
sion
P
a
per
|
Discussion
P
a
per
|
Discussion
P
a
per
|
of mixed anthropogenic and biomass burning emissions, 5 events were identified as having medium anthropogenic signatures (75th percentile>BCanthro>50th percentile)
and the remaining 6 events were classified as having low anthropogenic signatures. The analysis of the source contribution from FLEXPART shows that the majority of the BB events (9 out of 13) originated in North America, with BB events originating
5
in Europe all occurring in March 2009. To ensure that the results were not biased through only identifying events during the measurement period, a statistical analysis of all the FLEXPART data from 2008, 2009 and 2010 was performed. For these 3 years, 23 BB events lasting longer than 12 h (both with and without anthropogenic mixing) were identified. Of these 23 events,∼67 % of the BCfire tracer originated from North
10
America, 15 % from Europe and 19 % from Asia, confirming that North America is the primary source of BB emissions impacting Summit.
Analyses of O3and its precursors at Summit show that the mean enhancements for
PAN, NOx, NOy and C2H6 during the BB events identified by FLEXPART are highly variable (Table 3). Values ranged between−4.4 and 12.4 nmol mol−1for∆O3,−7.9 to
15
90.4 pmol mol−1for ∆PAN, 0.6 to 24.5 pmol mol−1for ∆NOx, −5.6 to 141.1 pmol mol
−1
for∆NOy and −22.9 to 338.0 pmol mol
−1
for ∆C2H6, for the 11 BB events
character-ized as having low/medium anthropogenic signatures. When considering only those events with low anthropogenic signatures, the results show that air masses sampled with potential BB contributions have∆O3 ranging between−4.4 and 10.8 nmol mol
−1
,
20
with positive enhancements during 4 out of 5 events. These enhancements are com-parable to those by Thomas et al. (2013) who estimated ozone production of up to 3 nmol mol−1 in aged BB plumes in the mid to upper-troposphere (peaking at 7 km) over Greenland. Our results suggest that in the lower troposphere the enhancement may even be greater. However, the enhancement values presented here can only be
25
ACPD
14, 13817–13867, 2014Seasonal variability of nitrogen oxides and NMHC at Summit
L. J. Kramer
Title Page
Abstract Introduction
Conclusions References
Tables Figures
◭ ◮
◭ ◮
Back Close
Full Screen / Esc
Printer-friendly Version Interactive Discussion
Discussion
P
a
per
|
Discus
sion
P
a
per
|
Discussion
P
a
per
|
Discussion
P
a
per
|
with the background air, therefore, separating the pollution impacts from background levels is challenging. For example, in 2008 FLEXPART indicated that a BB event im-pacted the measurement site from 25–26 July (event 1). The total column sensitivity from the FLEXPART retroplume (see Fig. 10) shows that the air masses arriving at the site during this event in July originated from a region with BB sources over Canada and
5
Alaska and was transported in the lower troposphere over the Arctic Ocean. The air resided over the Arctic Ocean for∼4 days before ascending to Summit; therefore, it is likely that the polluted air containing BB emissions mixed with cleaner air from this re-gion. As a result, measurements during this event show small positive enhancements for NOxand C2H6, and negative values for∆O3,∆PAN and∆NOy.
10
The largest BB event identified by FLEXPART was observed in August 2008, when the BCfiretracer indicated BB plumes impacted the site continuously from 3 August to
14 August, peaking at ∼91 pmol mol−1, as a result of large wildfires in Canada. We find O3 and its precursors were all positive during this period, with mean
enhance-ments of 56.5, 19.4 and 141.1 pmol mol−1 for ∆PAN, ∆NOx and ∆NOy respectively,
15
and 10.5 nmol mol−1for∆O3. A closer analysis of the measurements in Fig. 11 shows
that O3was consistently high during the event. Analysis of the FLEXPART total column
sensitivity indicates that during this event air masses were often transported at high alti-tudes in the free troposphere, enhancing the probability of mixing with high ozone from stratospheric origin, which may contribute to the elevated O3levels that were observed
20
(Alvarado et al., 2010; Roiger et al., 2011).
Anthropogenic events during the summer months (April–September) were identified using the same threshold for winter/spring as in Sect. 3.2.1. During the measurement period, 28 events were identified with mean enhancement values up to 16 nmol mol−1, 28 pmol mol−1, 237 pmol mol−1, 205 pmol mol−1, and 1.0 nmol mol−1 for ∆O3, ∆PAN,
25
∆NOx,∆NOyand∆C2H6, respectively. The air masses of anthropogenic origin primary
originated from Europe with a mean plume age ranging between 7 to 15 days. The maximum enhancements during anthropogenic events are much larger than those from
ACPD
14, 13817–13867, 2014Seasonal variability of nitrogen oxides and NMHC at Summit
L. J. Kramer
Title Page
Abstract Introduction
Conclusions References
Tables Figures
◭ ◮
◭ ◮
Back Close
Full Screen / Esc
Printer-friendly Version Interactive Discussion
Discussion
P
a
per
|
Discus
sion
P
a
per
|
Discussion
P
a
per
|
Discussion
P
a
per
|
the BB events, suggesting that air masses containing anthropogenic emissions may have a larger impact on levels of O3and precursors at Summit during the summer.
4 Summary
These anlayses of NOy, NOx, PAN, NMHC and O3from the high altitude GEOSummit
Station in Greenland show that PAN is the dominant species of NOy at the site, year
5
round, ranging from 49 % in the summer months to 78 % in spring. However, the NOy
seasonal cycle does not follow that of PAN, due to significant contributions from NOxin
the summer and odd NOyspecies during both summer and winter. We hypothesize that alkyl nitrates may account for a large portion of the odd NOy observed in winter and
that photochemically produced species such as NOx and HONO within the snowpack
10
may impact the NOy budget during summer. However, these hypotheses cannot be confirmed without coincident measurements of indivdual NOyspecies and alkly nitrates
above the snowpack.
Analyses of the C2–C6 alkane NMHC data show that there is a large build up of NMHC during the winter period in the atmosphere above Summit which peaks between
15
January and March. The increase in photochemical processing after polar sunrise co-incides with a decrease in NMHC levels during subsequent months. Between February and May total C2–C6 NMHC decreased by approximately 4.4 ppbC. The decrease in NMHC may contribute partly to the spring time peak in O3 observed over the same
period. Further analyses using a photochemical model, constrained by the
measure-20
ments, is needed to evaluate the springtime O3 photochemical production rate at the measurement site and during subsequent transport downwind (Hamlin and Honrath, 2002).
Rapid changes in the origin of sampled air masses, from regions in Europe, North America and the high latitude Arctic, result in a large variability in the
25