Interferon Alpha in Lymph Nodes of HIV-1 Patients
Clara Lehmann1,2,3, Mark Lafferty1,4, Alfredo Garzino-Demo1,4, Norma Jung3, Pia Hartmann3, Gerd Fa¨tkenheuer3, Jeffrey S. Wolf5, Jan van Lunzen6, Fabio Romerio1,2*
1Institute of Human Virology, University of Maryland, Baltimore, Maryland, United States of America,2Department of Medicine, University of Maryland School of Medicine, Baltimore, Maryland, United States of America, 3First Department of Internal Medicine, University of Cologne, Cologne, Germany, 4Department of Microbiology and Immunology, University of Maryland School of Medicine, Baltimore, Maryland, United States of America,5Department of Otorhinolaryngology-Head and Neck Surgery, University of Maryland Medical Center, Baltimore, Maryland, United States of America,6University Medical Center Hamburg-Eppendorf and Heinrich-Pette-Institute for Experimental Virology and Immunology, Hamburg, Germany
Abstract
Circulating plasmacytoid dendritic cells (pDC) decline during HIV-1 infection, but at the same time they express markedly higher levels of interferon alpha (IFNa), which is associated with HIV-1 disease progression. Here we show an accumulation of pDC in lymph nodes (LN) of treatment-naı¨ve HIV-1 patients. This phenomenon was associated with elevated expression of the LN homing marker, CCR7, on pDC in peripheral blood of HIV-1 patients, which conferred increased migratory capacity in response to CCR7 ligands inex vivofunctional assays. LN-homed pDC of HIV-1 patients presented higher CD40 and lower
BDCA2 levels, but unchanged CD83 and CD86 expression. In addition, these cells expressed markedly higher amounts of IFNacompared to uninfected individuals, and were undergoing faster rates of cell death. These results demonstrate for the first time that in asymptomatic, untreated HIV-1 patients circulating pDC up-regulate CCR7 expression, accumulate in lymph nodes, and express high amounts of IFNabefore undergoing cell death. Since IFNainhibits cell proliferation and modulates immune responses, chronically high levels of this cytokine in LN of HIV-1 patients may impair differentiation and immune function of bystander CD4+T cells, thus playing into the mechanisms of AIDS immunopathogenesis.
Citation:Lehmann C, Lafferty M, Garzino-Demo A, Jung N, Hartmann P, et al. (2010) Plasmacytoid Dendritic Cells Accumulate and Secrete Interferon Alpha in Lymph Nodes of HIV-1 Patients. PLoS ONE 5(6): e11110. doi:10.1371/journal.pone.0011110
Editor:Johan K. Sandberg, Karolinska Institutet, Sweden
ReceivedApril 5, 2010;AcceptedMay 21, 2010;PublishedJune 14, 2010
Copyright:ß2010 Lehmann et al. This is an open-access article distributed under the terms of the Creative Commons Attribution License, which permits unrestricted use, distribution, and reproduction in any medium, provided the original author and source are credited.
Funding:The work described was supported by awards R01NS066842 from the National Institute of Neurological Disorders and Stroke (NINDS) and 1R21DE15508-01 from the National Institute of Dental and Craniofacial Research (A.G.-D.). C.L. and N.J. were supported by the German Federal Ministry of Research and Education (BMBF grant 01KI0771). M.K.L. was a trainee under Institutional Training Grant T32AI007540 from the National Institute of Allergy and Infectious Diseases (NIAID). The content is solely the responsibility of the authors and does not necessarily represent the official views of the NIAID, NINDS or the National Institutes of Health. The funders had no role in study design, data collection and analysis, decision to publish, or preparation of the manuscript.
Competing Interests:The authors have declared that no competing interests exist.
* E-mail: [email protected]
Introduction
Untreated HIV-1 infection is characterized by a progressive decline of CD4+
T cell number and function. Recent studies have shown that CD4+
T cells are rapidly depleted from the gut-associated lymphoid tissue (GALT) and other mucosal sites within the first few weeks of infection (for a comprehensive review see [1]). Mucosal depletion of CD4+T cells is followed by the onset of
generalized immune activation and progressive loss of immune function, which are manifested throughout the asymptomatic chronic phase of the disease [1]. The level of immune activation in 1 infected subjects is a strong independent predictor for HIV-1 disease progression [2,3,4,5,6]. However, the mechanisms that trigger and drive persistent immune activation remain to be elucidated.
Interferon alpha (IFNa) is rapidly upregulated in response to viral infections [7,8,9], and is an essential player in antiviral immune responses: it induces the expression of cellular genes that interfere with viral replication, activates NK cell function, and promotes maturation of antigen presenting cells [10,11,12,13,14]. Plasmacytoid dendritic cells (pDC) are the main IFNaproducers in humans [15].
promotes apoptosis of uninfected, bystander CD4+
T cells [32], and gene expression profiles suggest that exposure to IFNamay induce chronic activation of CD4+
T cells [31]. Evidence for a possible role of pDC and IFNain AIDS pathogenesis also comes from animal models. Persistent decline of circulating pDC and chronic over-expression of IFNaare observed during pathogenic SIV infection of natural hosts [33,34], but not during non-pathogenic SIV infection of natural hosts [29,35]. These reports suggest that IFNamay play a role involved in promoting chronic activation and immune dysfunction during HIV-1 disease.
Although various hypotheses have been called into play [19,36,37,38,39,40], one key aspect that remains to be elucidated is whether the decline of pDC observed in peripheral blood of HIV-1 patients reflects systemic depletion or relocation to other body compartments. Thus, in the present study we investigated the fate and function of pDC in HIV-1 infection. We analyzed the expression of tissue homing markers on circulating pDC from HIV-1 patients and control individuals. Further, we analyzed frequency, maturation stage, steady-state IFNasecretion, and cell death rate of pDC in lymph nodes of HIV-1 patients and healthy subjects. Our results show that circulating pDC of HIV-1 patients relocate to lymphoid tissues and express high levels of IFNabefore undergoing cell death.
Materials and Methods
Patients
All samples were obtained with signed informed consent after approval from the Institutional Review Boards of the University of Maryland, Baltimore and University of Hamburg, Germany, and according to ethical guidelines. Lymph nodes (cervical and axillary) and peripheral blood were obtained from HIV-1 patients and uninfected controls at the University of Hamburg-Eppendorf, Germany, at the University of Maryland School of Medicine, at the University of Maryland Medical Center, and at the National Disease Resource Interchange Program (Philadelphia, PA). Lymph nodes were placed in sterile saline immediately after excision, and mononuclear cells were dissociated mechanically. Peripheral blood and lymph node mononuclear cells (PBMC and LNMC) were isolated by Ficoll centrifugation. Frozen PBMC and LNMC samples were thawed and analyzed all at the same time at the Institute of Human Virology (Baltimore, MD). To ensure reliability of the functional measures carried out with cryopre-served samples – including the exclusion of samples that presented
$25% of dead cells by trypan blue exclusion upon thawing – we followed guidelines reported in several studies published previously [41,42,43,44].
Flow Cytometry
For surface staining, PBMC and LNMC suspensions were incubated in the dark for 30 minutes at 4uC with anti-CD123 and -BDCA2 or -BDCA4 antibodies (Miltenyi Biotec, Auburn, CA) to identify pDC, in combination with anti-CCR4, -CCR7, -CCR9, -CD18, -CD29, -CD40, -CD49d, -CD83, -CD86, -CD62L, -CD103, -Integrin b7, or Annexin V (all from BD Biosciences, San Jose, CA). As control, we used isotype-matched antibodies labeled with the appropriate fluorochrome (BD Biosciences). After staining, cells were washed with phosphate buffer saline (PBS) and analyzed by flow cytometry (FACSCalibur) using CellQuest software (both from BD Biosciences). In all cases, 106events were acquired corresponding to live mononuclear cells as assessed by forward and side light scatter profile. Steady state IFNasecretion was assayed using the IFNaSecretion and Detection Kit (Miltenyi Biotech). Briefly, immediately after thawing LNMC were
incubated with an anti-IFNaCatch Reagent (anti-IFNaantibody conjugated to a proprietary cell surface-specific monoclonal antibody). After a 20-minute incubation to allow IFNasecretion and capture by the Catch Reagent, the cells were incubated with an IFNa Detection Reagent (PE-labeled anti-IFNa antibody) along with antibodies to CD123 and BDCA2 to identify pDC by flow cytometry. Expression of the homing markers, staining with Annexin V and IFNa secretion were determined as Geometric Mean Fluorescence Intensity (GMFI) by gating on the live cell population (as assessed by forward and side scatter light profile) and on the pDC population (as assessed by BDCA2/4+CD123+).
Data analysis was performed with the FlowJo software (Tree Star, Ashland, OR).
Migration Assays
Evaluation of migratory properties of pDC from peripheral blood of HIV-1 positive and negative subjects was performed using a modified transmigration assay [45]. This assay utilized unfractionated PBMC, thereby avoiding unintentional in vitro
maturation effects during purification, and increased total input PBMC concentration to account for decreased frequencies of dendritic cells in PBMC of HIV-1 patients. Briefly, CCL19 (MIP3b) and CCL21 (SLC) (R & D Systems, Minneapolis, MN) were diluted to 100 ng/ml each in RPMI 1640 supplemented with 10% human serum AB, and added (alone or in combination) in the lower chamber of a 24-well Costar transwell plate (Corning Inc., Lowell, MA). Media without chemokine was used as control. PBMC were placed at 26107cells/ml in RPMI plus 10% human serum AB, 100ml (26106cells) were added to the upper chamber and incubated for 2 hours at 37uC in 5% CO2. Cells in the bottom
wells were then harvested by pipetting, and residual cells were collected by rinsing the underside of the filter with 10 mM EDTA in PBS. Cells were washed and stained with the appropriate antibodies, and analyzed by flow cytometry. Duplicate results were averaged. Net migration was defined as the percentage of pDC migrating in response to chemokines minus the percent migrating in media alone.
Real-time PCR Quantification of HIV-1 DNA
Total cellular DNA was extracted from 16106LNMC using the DNeasy Blood and Tissue Kit (Qiagen, Valencia, CA). DNA was analyzed by real-time quantitative PCR using a Bio-Rad iQ5 Real-Time PCR system with iQSYBR green supermix (Bio-Rad, Hercules, CA). Reactions were performed in triplicate in parallel with sets of known quantitative standards for HIV-1 DNA and albumin. HIV-1 DNA was quantified using the following primers 59-GGCTAACTAGGGAACCCACTG-39 (sense) and 59 -CT-GCTAGAGATTTTCCACACTGAC-39 (antisense). PCR was performed for 2 min at 95uC followed by 40 cycles of 30 sec at 95uC and 30 sec at 60uC. Cell number was determined using albumin as a reference with the following primers 59 -TGTTGCATGAGAAAACGCCA-39 (sense) and 59 -GTCG-CCTGTTCACCAAGGAT-39 (antisense). PCR was performed for 2 min at 95uC followed by 40 cycles of 30 sec at 95uC and 1 min at 62uC. The viral load was expressed as percent of CD4+
T cells harboring HIV-1 genome.
Statistical Analyses
Data were analyzed with Wilcoxon rank-sum test. Spearman’sr
legends. Data analyses were performed using GraphPad Prism (GraphPad Software, San Diego, CA).
Results
Accumulation of pDC in lymph nodes of HIV-1 patients
Recent studies strongly suggest that chronic, exacerbated IFNa
expression may be a cofactor in the immunopathogenesis of HIV-1 disease [29,3HIV-1]. As upon virus infection pDC are the main IFNa
producers, a better understanding of their fate and function during HIV-1 infection may help elucidate the mechanisms of immune dysfunction. Previous studies showed a decline of pDC in peripheral blood of HIV-1 patients [18,28]. Thus, we sought to assess whether this observation could be explained with relocation to lymph nodes. To that end, we obtained lymph node samples from HIV-1 patients (n= 18) and healthy controls (n= 11), whose demographic and clinical characteristics are shown in Table 1. The median age (and interquartile range, IQR) of HIV-1 positive individuals at time of sample collection was 31 years (26–35) and 100% were male Caucasians. The median age for uninfected individuals was 50 years (26–61), 73% were male, and 81% were Caucasians. HIV-1 patients had a median CD4+T cell count of
413 cells/ml (348–538), median viremia of 4.5 log10copies of
HIV-1 RNA per ml of blood (3.7–5.3), while we determined that a median 1.3% of CD4+
T cells in lymph node mononuclear cells carried proviral HIV-1 DNA (0.2–1.5). All HIV-1 patients were off therapy at the time of sample collection. In addition, as indicated in Materials and Methods, we followed previously described guidelines – e.g. the exclusion of samples with$25% of dead cells by trypan blue exclusion upon thawing – so as to ensure the reliability of studies carried out with cryopreserved samples [41,42,43,44].
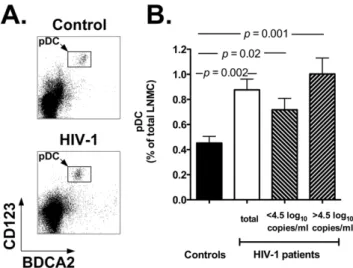
We analyzed the frequency of pDC in lymph node mononu-clear cells (LNMC). Figure 1A reports two flow cytometry plots representative of a healthy control (top plot) and an HIV-1 positive individual (bottom plot), while Figure 1B shows the summary results for all individuals in each study group (black bar: controls; white bar: HIV-1 patients). Our results show a significant increase in the percentage of lymph node-homed pDC in HIV-1 patients compared to healthy controls (p= 0.002). Indeed, the mean percentage of pDC in LNMC of HIV-1 infected patients was 0.8760.08 vs. 0.4560.05 in control individuals. Moreover, when HIV-1 patients were stratified around the median value of the
HIV-1 viral load (4.5 log10 copies/ml), the difference in the
percentage of LN-homed pDC between control individuals and HIV-1 patients with viremia.4.5 log10copies/ml was even more
remarkable (p= 0.001; Figure 1B; upward diagonal bar). No statistically significant difference was observed between HIV-1 patients with viremia .4.5 log10 and ,4.5 log10 copies/ml
(p.0.05). These results suggest that in HIV-1 positive individuals circulating pDC relocate from the peripheral blood to lymph nodes, possibly in response to undergoing viral replication. It is also important to underscore that for these and all the other results reported below, all samples were analyzed concurrently, side by side to ensure reproducibility of the data.
Increased expression of the lymph node homing markers CCR7 and CD62L, and GALT homing marker CD103 on circulating pDC of HIV-1 patients
In an attempt to elucidate the mechanisms involved in the accumulation of pDC in lymph nodes of HIV-1 patients, we investigated the expression of lymph node and other tissue homing markers on circulating pDC of 17 HIV-1 positive and 11 uninfected individuals in a cross sectional study.
Table 2 reports the demographic and clinical parameters of the peripheral blood donors. The median age (and IQR) of HIV-1-infected individuals at time of sample collection was 41 years (36– 51) and,70% were male African American, while for uninfected
individuals was 37 years (31–39), 55% were male, and 64% were Caucasians. For HIV-1 positive subjects, the median absolute CD4+
T cell count (and IQR) was 402 cells/ml (294–530), and the median HIV-1 RNA copies/ml blood was 3.7 log10(1.7–4.7). The
percentage of pDC in PBMC of HIV-1 positive individuals was markedly reduced compared to negative controls: 0.2560.04 vs. 0.5760.07;p= 0.003. About two thirds of the HIV-1 patients were
Table 1.Demographic and clinical parameters of lymph node donors.
Characteristic
HIV-1 positive (n= 18)
Controls (n= 11)
Age 31 (26–35) 50 (26–61)
Gender (Male: Female) 18:0 8:3
Ethnicity (Cauc. : Afr. Amer. : Hisp.) 18:0:0 9:1:1
CD4+T cells/
ml 413 (348–538) n.a.
Percent pDC in total LNMC 0.8760.08 0.4560.05
Log10HIV-1 RNA copies/ml blood 4.5 (3.7–5.3) N/A
Percent HIV-1+CD4+T cells in LN 1.3 (0.2–1.5) N/A
ART status (On: Off) 0:18 N/A
All data are Median (Interquartile Range) except for % pDC in total LNMC, which is Mean6Standard Error of Means; n.a. = not available; N/A = not applicable; LNMC = lymph node mononuclear cells; ART = Antiretroviral therapy. doi:10.1371/journal.pone.0011110.t001
Figure 1. Accumulation of pDC in lymph nodes of HIV-1 patients.Panel A: flow cytometry plots showing the pDC population in lymph node mononuclear cells (LNMC) of a representative control individual (top) and HIV-1 patient (bottom). We identified pDC by staining whole LNMC with anti-BDCA2 and anti-CD123 antibodies (rectangles within density plots) and by gating onto the live cell population as assessed by forward and side light scatter profile (not shown). Panel B: summary results for the frequency of pDC in LNMC of healthy controls (black bar,n= 11) and HIV-1 patients (white bar: total
patients, n= 18; downward diagonal bar: patients with ,4.5 log10
copies/ml HIV-1 RNA,n= 9; upward diagonal bar: patients with.4.5
log10copies/ml HIV-1 RNA,n= 9). The panel shows the Mean and SEM values of pDC frequencies for each study group.
off antiretroviral therapy at the time of sample collection. As described previously, the decline in pDC frequency correlated inversely with HIV-1 viremia (p= 0.01,r=20.7; data not shown) [28].
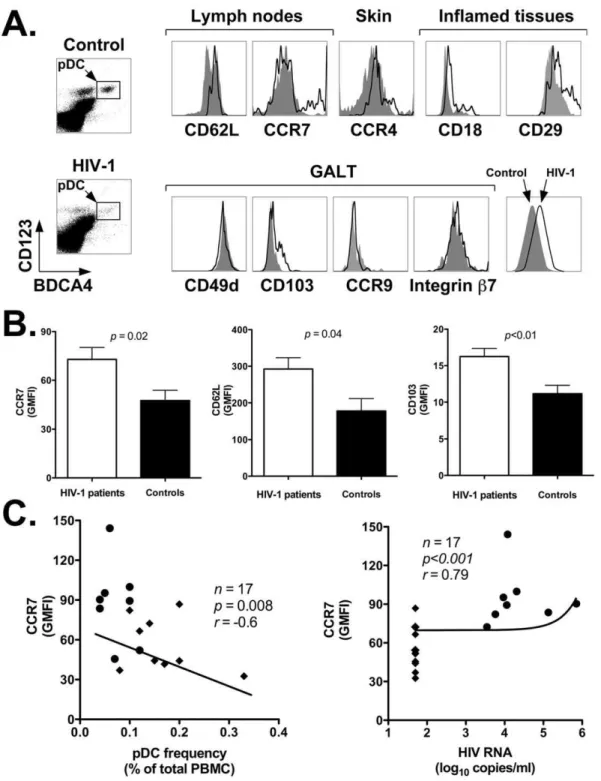
To assess whether accumulation of pDC in LN of HIV-1 infected patients involved modulation of tissue homing markers, we analyzed the expression of several cell surface receptors on circulating pDC of HIV-1 positive and negative individuals. The markers we analyzed included: CD62L and CCR7 (lymph nodes); CCR4 (skin); CD18, CD29 (inflamed tissues); CD49d, CD103, CCR9, and integrinb7 (lamina propriaand intraepithelial sites of the gut associated lymphoid tissue or GALT). Figure 2A shows representative flow cytometry plots obtained by staining PBMC from a representative healthy control (top density plot and gray area histogram plots) and an HIV-1 patient (bottom density plot and black line histogram plots) with antibodies directed to BDCA4 and CD123 (to identify pDC) in conjunction with antibodies against homing markers of interest. Table 3 summarized the results of our analyses for all HIV-1 patients and control individuals, and reports the p value determined with the nonparametric Wilcoxon rank-sum test. The data are expressed as the Mean (6 SEM) of the Geometric Mean Fluorescence Intensity (GMFI) values for each cell surface marker determined by flow cytometry with cells from all individuals in the two study groups. As shown in the table, among all the markers analyzed, pDC of HIV-1 patients displayed a statistically significant upregulation of only three markers: CCR7, CD62L, and CD103 (CCR7: p,0.05, CD62L:p,0.05, CD103:p,0.01; see Table 3 and Figures 2B). The mean CCR7, CD62L and CD103 GMFI6
SEM in HIV-1 positive vs. negative individuals were: 101.2629.3 vs. 47.566.3; 292.4631.1 vs. 178.4633.2; and 20.764.6 vs. 11.261.2, respectively. All other homing markers (CCR4, CD49d, integrin b7, CCR9, CD18 and CD29) did not show any statistically significant difference between the two study groups (p.0.05; see Table 3 and Figure 2A).
Interestingly, Figure 2C shows that CCR7 expression was higher on pDC of viremic than aviremic patients: it correlated inversely with their frequency in peripheral blood (p= 0.008,r= -0.6), and correlated directly with HIV-1 viremia (p,0.001,
r= 0.79). Importantly, the line summarizing the data in Figure 2C uses a linear model fitted on the logarithmic scale that expresses HIV-1 viremia. Altogether, these results suggest that ongoing HIV-1 replication drives upregulation of CCR7 on pDC of HIV-1 patients. Thus, higher expression of CCR7 and CD62L might
promote their relocation from peripheral blood to lymph nodes, which are the site of chronic viral replication.
Increased migration of pDC from HIV-1 patients in response to CCR7 ligands
To determine whether higher CCR7 expression on pDC from peripheral blood of HIV-1 patients could mediate their migration from the blood to lymphoid organs, we used a transwell migration assay to determine the ability of pDC from a subset of HIV-1 positive (n= 11) and negative (n= 6) individuals to migrate in response to the CCR7 ligands, CCL19 and 21. Since CCR7 expression was found to correlate with HIV-1 viremia, the patients were divided into two groups: those with detectable (.50 copies/ ml, off ART;n= 6) and those with undetectable HIV-1 RNA (,50 copies/ml, on ART;n= 5).
We observed that the net migration of pDC to CCL19 and 21 in HIV-1 positive individuals with detectable viral load was significantly greater than that of pDC from HIV-1 negative and positive individuals with undetectable viral load (p,0.01, Figure 3A). The migration index correlated directly with CCR7 expression on pDC (p= 0.01, r= 0.7; Figure 3B). Moreover, we found that the migration index of pDC correlated inversely with their frequency in PBMC (p= 0.04, r=20.69; Figure 3C), and directly with HIV-1 viremia (p= 0.01,r= 0.7; Figure 3D).
We conclude that CCR7 upregulation on pDC of HIV-1 patients translates into an increased migratory potential inex vivo
assays. These results are in agreement with the ones described above, and further support the possibility that decreased pDC numbers in peripheral blood are due to relocation to lymph nodes.
Abnormal cell surface marker expression profile and increased IFNaexpression in lymph node-homed pDC of HIV-1 patients
Previous studies showed that pDC isolated from peripheral blood of HIV-1 patients produced lower levels of IFNa uponex vivo stimulation with reference viruses, which was initially attributed to a functional defect of these cells due HIV-1 infection [17,46]. However, subsequent studies demonstrated that in vitro
stimulation does not faithfully reflect the ability of pDC to produce IFNain vivo[47]. Indeed, we have demonstrated that circulating pDC of HIV-1 patients express markedly higher levels of IFNa
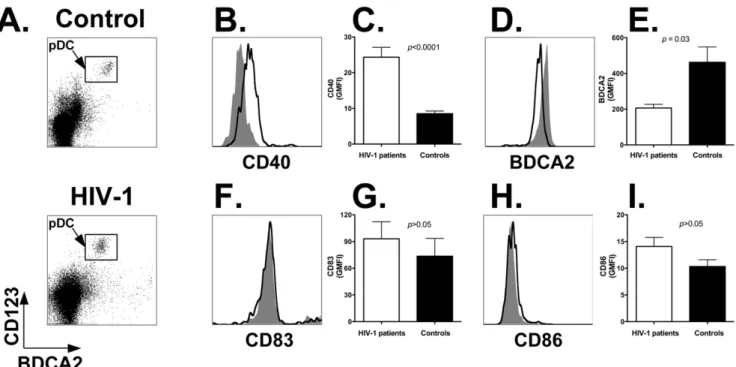
mRNA and protein [28]. To address the possibility that chronic HIV-1 replication in lymph nodes may affect the activation, maturation and function of pDC, we analyzed these cells by flow cytometry for the expression of the activation and maturation markers CD40, BCDA2, CD83 and CD86, as well as the steady state IFNasecretion [38,48,49,50].
Whole LNMC preparations were stained with antibodies directed to BDCA2 and CD123 (to identify the pDC population; Figure 4A; top panel: healthy control; bottom panel: HIV-1 patient) in combination with antibodies directed to CD40, CD83 or CD86. Figure 4 shows representative flow cytometry histogram plots obtained by staining LNMC from a healthy control (gray area) and an HIV-1 patient (black line) with anti-CD40 (panel B), -BDCA2 (panel D), -CD83 (panel F), and -CD86 (panel H) antibodies, respectively. Summary results shown in Figure 4C demonstrate that CD40 expression was significantly upregulated on pDC of HIV-1 patients (white bar) compared to healthy subjects (black bar; p,0.0001). The mean GMFI 6 SEM was 26.263.5 for HIV-1 patients vs. 7.861.3 for uninfected persons (Table 4). In addition, Figure 4E shows that BDCA2 expression was significantly lower on pDC of HIV-1 patients (p,0.03): the mean GMFI6SEM was 206.2620.8 vs. 462.5685.9 for controls
Table 2.Demographic and clinical parameters of peripheral blood donors.
Characteristic
HIV-1 positive (n= 17)
Controls (n= 11)
Age 41 (36–51) 36 (31–39)
Gender (Male: Female) 12:5 6:5
Ethnicity (Cauc. : Afr. Amer. : Hisp.) 4:13:0 7:2:2
CD4+T cells/
ml of blood 402 (294–530) n.a. Percent of pDC in total PBMC 0.2560.04 0.5760.07
Log10HIV-1 RNA copies/ml blood 3.7 (1.7–4.7) N/A
ART status (On: Off) 6:11 N/A
Figure 2. Increased expression of lymphoid tissue homing markers on circulating pDC of HIV-1 positive versus negative individuals.Panel A: representative flow cytometry plots showing expression of nine homing markers grouped by tissue specificity: CD62L and CCR7 (lymph nodes); CCR4 (skin); CD18 and CD29 (inflamed tissues); and CD49d, CD103, CCR9 and integrinb7 (GALT). Histogram plots were obtained by gating onto the live cell population as assessed by forward and side light scatter profile (not shown), and then onto the pDC population as identified by staining with anti-BDCA4 and anti-CD123 antibodies (rectangles within density plots). Top density plot and gray area histogram: healthy control; bottom density plot and black line histogram: HIV-1 patient. Panel B: summary results of CCR7, CD62L and CD103 expression on pDC of HIV-1 positive (n= 17) and negative individuals (n= 11). We assessed the Geometric Mean Fluorescence Intensity (GMFI) for each marker by flow cytometry
(Materials and Methods). The panels show the Mean and SEM of the GMFI values determined for all individuals in the two study groups. Black bars: healthy controls; white bar: HIV-1 patients. Panel C: correlation analyses between CCR7 expression and frequency of pDC in PBMC of HIV-1 patients (left) and HIV-1 viremia (right). The line summarizing the data uses a linear model fitted on the logarithmic scale that expresses HIV-1 viremia. Closed circles (
N
): viremic patients; closed diamonds (X): aviremic patients.(Table 4). However, we found no difference (p.0.05) in the expression levels of CD83 and CD86 between HIV-1 patients and healthy controls: 99.7626.5 vs. 77.8634.6; and 14.762.4 vs. 9.962.3 (Figure 4G and 4I; Table 4). The increase in CD40 expression did not correlate with proviral HIV-1 DNA content (r= 0.4, p.0.05), but correlated directly with HIV-1 viremia (r= 0.62,p= 0.02; (data not shown).
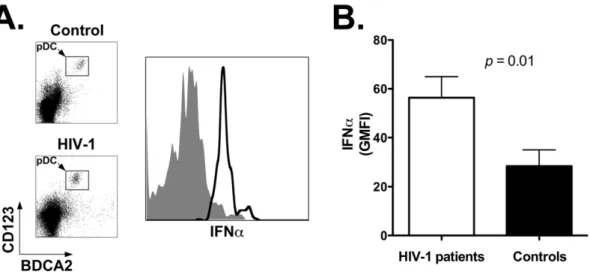
Next we analyzed baseline IFNasecretion by pDC using a flow cytometry-based assay that detects the cytokine following secretion by the producer cell. Pilot experiments showed that IFNa
secretion under our assay conditions is unaffected by the process of cell freezing and thawing (not shown). Figure 5A shows representative results obtained with cells from a healthy control (top density plot and gray area histogram plot) and an HIV-1 patient (bottom density plot and black line histogram plot). The summary results for all individuals in each study group show that unstimulated pDC of HIV-1 patients (white bar) secrete significantly higher amounts of IFNa compared to control individuals (black bar; p= 0.01): the mean GMFI 6 SEM for the two study groups was 66.7611.3 vs. 40.068.9, respectively (Figure 5B and Table 4). These results demonstrate that lymph node-homed pDC of HIV-1 patients present activated but immature phenotype, and secrete elevated amounts of IFNa.
Lymph node-homed pDC of HIV-1 patients undergo apoptosis at higher rate
As shown above, our results indicate that the decline of circulating pDC in HIV-1 patients is associated with increased expression of functional lymph node homing markers. We also found increased frequencies of pDC in lymph nodes of HIV-1 patients, particularly those with higher viral loads. Next, we sought to determine whether there might be underlying mechanisms that compensate the migration of pDC to lymph nodes in HIV-1 patients, thereby offsetting in part accumulation of these cells.
A potential mechanism involved in this phenomenon could be a higher rate of pDC death after relocation to lymph nodes [33]. Therefore, uncultured, non-stimulated LNMC from HIV-1 patients and controls were stained with antibodies directed to BDCA2 and CD123 (to identify the pDC population) in combination with Annexin V, which allows the identification of cells undergoing apoptosis. As shown in Figure 6B, the mean percentage of Annexin V positive pDC (6SEM) was significantly higher for HIV-1 positive (white bar) than negative individuals (black bar; p= 0.01): 15.561.5 vs. 8.961.9 (Table 4). Figure 6A
shows plots representative of a healthy control (top density plot and gray area histogram plot) and an HIV-1 patient (bottom density plot and black line histogram plot). Since cells from HIV-1 positive individuals are more susceptible to apoptosis and may be lost at a higher rate during the freezing-thawing process compared to cells of healthy individuals, it is conceivable that the higher frequency of Annexin V-positive pDC in HIV-1 patients may be somewhat underestimated.
Correlation analyses
Based upon our nonparametric correlation analyses, IFNa
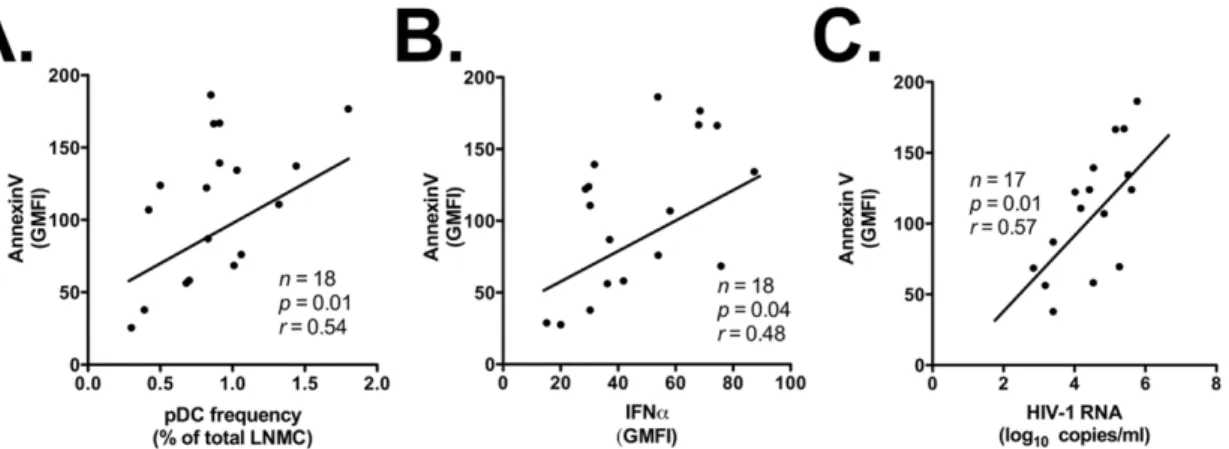
secretion was not associated with pDC frequency in LNMC, CD40 expression on lymph node-homed pDC, HIV-1 proviral DNA in lymph nodes, or HIV-1 blood viremia (p.0.05; data not shown). A possible explanation for these results – which is further addressed in the Discussion – is that pDC express IFNa in response to HIV-1 virions and/or proteins trapped in the intercellular space in lymph nodes. In addition, while we did not find any significant correlation between Annexin V staining and HIV-1 proviral DNA (data not shown), Annexin V staining correlated significantly with the frequency of pDC in lymph nodes (r= 0.54,p= 0.01; Figure 7A), IFNasecretion by pDC in lymph nodes (r= 0.48, p= 0.04; Figure 7B), and HIV-1 blood viremia (r= 0.57,p= 0.01; Figure 7C).
Altogether, the results presented in this report demonstrate that during HIV-1 infection pDC relocate to lymph nodes and secrete higher amounts of IFNa than their counterparts in uninfected individuals. Concurrently, pDC undergo cell death at significantly higher rate, which may in part offset their accumulation in lymph nodes.
Discussion
In the present report we investigated fate, activation, matura-tion, and function of plasmacytoid dendritic cells (pDC) during HIV-1 disease. Since most of the HIV-1 positive blood donors and all LN donors enrolled in our study were treatment-naı¨ve at time of sample collection, the effects of anti-retroviral therapy on viral replication, immune cell distribution, activation and function are not expected to influence significantly our results.
The fate of pDC in the course of HIV-1 infection has been a matter of intense debate. Soon after the identification of CD4+
Lin–CD11c–BDCA2/4+
CD123+
plasmacytoid dendritic cells as the major IFNa-producing cell type in humans upon
Table 3.Expression of homing markers on peripheral blood pDC.
Target Tissue Homing marker HIV-1 patients (n= 17) Controls (n= 11) pvalues
Lymph nodes CCR7 101.2629.3 47.566.3 ,0.05
CD62L 292.4631.1 178.4633.2 ,0.05
Gut associated lymphoid tissue
CD49d 695.16104.6 894.96154.2 .0.05
CD103 20.764.6 11.261.2 ,0.01
CCR9 14.461.3 15.360.9 .0.05
Integrinb7 245.3640.3 213.9618.3 .0.05
Inflamed tissues CD18 54.4616.4 40.3613.5 .0.05
CD29 676.7687.9 559.66218.5 .0.05
Skin CCR4 138.5622.4 88.1620.5 .0.05
virus infection [15,50], several groups reported the gradual decline of pDC in peripheral blood of HIV-1 patients [16,18,19]. These results were attributed to depletion following direct virus infection [19,36,37]. However, subsequent studies suggested that the decline of pDC in peripheral blood does not reflect a systemic depletion of these cells [28,38,39], and may involve relocation to lymphoid tissues, but failed to provide a mechanism that could explain the observations [38]. The present report shows for the first time that pDC accumulate in lymph nodes of HIV-1 patients, particularly those with highest viral loads. A recent study by Panda et al. showed that circulating pDC decline substantially in older compared to younger individuals [51]. In our study, there was no statistically significant difference in the median age of uninfected and infected blood donors. Therefore, age was not a factor in the decline in circulating pDC in HIV-1 infected individuals compared to healthy controls. As indicated in the
Materials and Methods, the studies described in the present report were carried out with cryopreserved cell preparations. In order for the freezing-thawing process to account for the depletion or accumulation of pDC in peripheral blood or lymph nodes, respectively, of HIV-1 patients vs. control individuals that we describe here, one would have to postulate that: a) to explain a selective change in pDC frequency compared to other cells populations (T cells, B cells, NK cells, myeloid cells, etc), pDC would have to be affected by freezing-thawing differently than other cell types present in the preparations being analyzed; and b) to explain a selective depletion of pDC in peripheral blood and a selective accumulation in lymph nodes, pDC would have to be affected by freezing-thawing in opposite fashion in PBMC vs. LNMC preparations. While it is conceivable that freezing-thawing may kill cells from viremic HIV-1 patients more than cells from aviremic patients or healthy individuals, we believe the postulates
Figure 3. Higher migratory potential of circulating pDC from HIV-1 positive versus negative individuals in response to CCR7 ligands (CCL19 and CCL21).Panel A: migration index of circulating pDC in response to CCR7 ligands. Total PBMC were seeded in the upper chamber of a transwell plate, while medium containing CCL19 and CCL21 (alone and in combination) was placed in the lower chamber. Flow cytometry was used to score pDC found in the lower chamber in response to CCR7 ligands vs. medium alone. The figure shows Migration Indices (determined as described in Materials and Methods) for control individuals (black bars;n= 6) vs. aviremic HIV-1 patients (,50 copies/ml of HIV-1 RNA;
gray bars;n= 5) vs. viremic patients (.50 copies/ml of HIV-1 RNA; white bars;n= 6). 19: treatment with CCL19; 21: treatment with CCL21; 19+21:
treatment with CCL19 and CCL21. Panel B: direct correlation between Migration Index and CCR7 expression on pDC. Panel C: inverse correlation between Migration Index and pDC frequency in PBMC of HIV-1 patients. Panel D: direct correlation between Migration Index and HIV-1 viremia. Closed circles (
outlined above to represent an unlikely scenario. Thus, we do not believe that the freezing-thawing process influenced, skewed or altered our studies in a way to lead to ‘‘artifactual’’ results.
Concurrently, we found that pDC in peripheral blood of HIV-1 patients express significantly higher levels of the lymph node homing markers, CCR7 and CD62L. Indeed, we showed that pDC of viremic HIV-1 patients responded more potently to CCR7 ligands – CCL19 and CCL21 – inex vivomigration assays under conditions that minimize cell differentiation. Altogether, these results provide a mechanism for the accumulation of pDC in
LN. We found a strong correlation between HIV-1 viremia, CCR7 expression, lower frequency in PBMC, and migratory potential inex vivoassays. Indeed, exposure of pDC to infectious or noninfectious HIV-1 particles in vitro leads to upregulation of functional CCR7 [52]. Moreover, previous studies by Desaiet al. and by Dillonet al. failed to observe an up-regulation of CCR7 on circulating pDC of HIV-1 patients [38,53]. The inconsistency between our findings and those of those two studies may be due to a number of factors. For instance, Desaiet al.focused their analysis on pediatric patients under therapy, while our study involved adult patients most of which were not undergoing ART. On the other hand, Dillon et al. used mean fluorescence intensity (MFI) to analyze CCR7 expression, while our study employed geometric mean fluorescence intensity (GMFI). Since CCR7 expression does not follow a normal distribution, and since its expression has a dynamic range of 2-3 logs, GMFI gives a more accurate estimate of the central tendency in the data sets than MFI. This conclusion is also supported by our functional studies, which showed that pDC of viremic HIV-1 patients display increased migratory potential inin vitro assays. Therefore, our studies are the first to demonstrate that the decline of pDC in peripheral blood of asymptomatic HIV-1 patients does not simply reflect a systemic cell loss, but rather can be explained – at least in part – with redistribution to peripheral lymph nodes in response to viral replication. Our results reflect closely the situation observed in pathogenic SIV infection of non-natural hosts. Several studies showed a sharp decline of circulating pDC during the acute phase of SIV infection in macaques, which persists throughout the infection [33,34,54,55]. Concurrently, pDC were found at higher
Figure 4. Activated but immature phenotype of lymph node-homed pDC from HIV-1 positive versus negative individuals.Panel A: identification of pDC populations in LNMC of a representative control (top panel) and HIV-1 positive (bottom panel) individual. LNMC were stained with anti-BDCA2 and anti-CD123 antibodies; analyses were carried out by gating on the live cell population as determined by forward and side scatter light profiles. Panels B, D, F and H: flow cytometry plots showing expression levels of activation (CD40 and BDCA2) and maturation (CD83 and CD86) markers on lymph node-homed pDC from a representative HIV-1 patient and control individual. Histogram plots were obtained by gating onto the live cell population as assessed by forward and side light scatter profile (not shown), and then onto the pDC population as identified by staining with anti-BDCA2 and anti-CD123 antibodies (as shown in density plots). Gray area: healthy control; black line: HIV-1 patient. Panels C, E, G, and I: expression levels of CD40, BDCA2, CD83 and CD86 on lymph node-homed pDC of control individuals (black bars;n= 11) and HIV-1 patients (white
bars;n= 18). We assessed the Geometric Mean Fluorescence Intensity (GMFI) values for each marker (Materials and Methods). Panels show the Mean
and SEM of the GMFI values determined with cells from all individuals in the two study groups. doi:10.1371/journal.pone.0011110.g004
Table 4.Features of lymph node-homed pDC.
Feature Marker
HIV-1 positive (n= 18)
Controls (n= 11)
p
values
Activation CD40 26.263.5 7.861.3 ,0.0001
BDCA2 206.2620.8 462.5685.9 ,0.03
Maturation CD83 99.7626.5 77.8634.6 .0.05
CD86 14.762.4 9.962.3 .0.05
Function IFNa 66.7611.3 40.068.9 ,0.01
Death Annexin V 15.561.5 8.961.9 = 0.01
Data are Mean6Standard Error of Means of the Geometric Mean Fluorescence Intensity (GMFI) values determined for all individuals in each study group. For Annexin V, data are Mean6Standard Error of the percent Annexin V positive values determined for all individuals in each study group.
frequency in LN of infected animals [54,55], only to decline with the onset of AIDS through a mechanism involving apoptosis [33]. The acute phase of non-pathogenic SIV infection in natural hosts (e.g. sooty mangabeys and African green monkeys) also involves a decline of circulating pDC, which initially relocate to lymph nodes, and then return to the circulation following the onset of the chronic phase [35]. Therefore, pDC dynamics sharply discrimi-nate pathogenic and non-pathogenic lentiviral infection in humans and animal models. Our studies also found that circulating pDC of HIV-1 patients express higher levels of CD103 (also known as integrinaE), which – in complex with integrinb7 – mediates cell
redistribution to the intraepithelial sites andlamina propria of the GALT. Evidence of higher levels of CD103 on pDC of HIV-1 patients may also indicate relocation of these cells to lymphoid tissues lining the gut mucosa. This hypothesis will be addressed in future studies.
In this report we also assessed the activation, maturation and function of pDC in lymph nodes of HIV-1 patients compared to healthy controls. Our results demonstrate that pDC in LN of HIV-1 donors display an altered cell surface expression profile of activation/maturation markers with higher CD40, lower BDCA2, and stable CD83 and CD86 levels. A previous report
Figure 5. Increased IFNaexpression by pDC in lymph nodes of HIV-1 patients.Panel A: flow cytometry plot showing expression of IFNaby lymph node-homed pDC from a representative healthy control and an HIV-1 patient. Histogram plot was obtained by gating onto the live cell population as assessed by forward and side light scatter profile (not shown), and then onto the pDC population as identified by staining with anti-BDCA2 and anti-CD123 antibodies. Top density plot and gray area histogram: healthy control; bottom density plot and black line histogram: HIV-1 patient. Panel B: summary results for expression levels of IFNaby lymph node-homed pDC of healthy controls (black bar;n= 11) and HIV-1 patients
(white bar;n= 18). We assessed the Geometric Mean Fluorescence Intensity (GMFI) value with cells from all individuals in the two study groups
(Materials and Methods). Panel shows the Mean and SEM of the GMFI values. doi:10.1371/journal.pone.0011110.g005
Figure 6. Higher rates of cell death by pDC in lymph nodes of HIV-1 patients.Panel A: flow cytometry plot showing Annexin V staining of lymph node-homed pDC from a representative HIV-1 patient and control individual. Histogram plots were obtained by gating onto the live cell population as assessed by forward and side light scatter profile (not shown), and then onto the pDC population as identified by staining with anti-BDCA2 and anti-CD123 antibodies. Top density plot and gray area histogram: healthy control; bottom density plot and black line histogram: HIV-1 patient. Panel B: summary results for expression levels of Annexin V by lymph node-homed pDC of healthy controls (black bar;n= 11) and HIV-1
patients (white bar;n= 18). We determined the percentage of Annexin V positive pDC from all individuals in the two study groups (Materials and
found that interdigitating dendritic cells in lymph nodes of HIV-1 patients also express higher CD40 and lower CD86 levels [56]. In addition, that study found a higher percentage of IFNa -expressing cells in lymph nodes of HIV-1 positive individuals. The decline in BDCA2 expression on pDC of HIV-1 patients is relevant for multiple reasons [57]. First, BDCA2 is a class II C-type lectin involved in antigen capture and presentation [50,58]. Second, pDC stimulated through BDCA2 promote CD4+
T cell proliferation and differentiation toward Th1 effector cells [59]. Third, BDCA2 stimulation leads to decreased IFNa expression by pDC [58]. Thus, lower BDCA2 levels on pDC of HIV-1 patients are consistent with the notion that these cells have reduced capacity to function as antigen presenting cells and to stimulate CD4+T cell proliferation, while retaining the ability
to express IFNa. Indeed, we demonstrated that pDC from LN of HIV-1 patients secrete higher amounts of IFNa by using a flow cytometry-based assay in the absence of exogenous stimuli that may yield artifactual results [47]. Also, our previous studies showed that IFNaexpression by circulating pDC was increased in HIV-1 patients both at the RNA and protein level, but did not correlate with HIV-1 viral load in blood [28,30]. A recent study also showed that pDC of women express more IFNathan pDC of men [60]. Since in our study the cohort of HIV-1 positive lymph node donors included only men, it is possible that a cohort including both men and women would have evidenced an even more dramatic increase in IFNa expression by lymph node-homed pDC during HIV-1 infection. In the present report, we did not observe any correlation between IFNaexpression by LN-homed pDC and HIV-1 viremia. Thus, active virus replication appears to lead to higher CCR7 expression and pDC migration to lymph nodes, but not to higher IFNaexpression by lymph node-homed pDC. However, several studies showed that pDC can be triggered to express IFNa following exposure to both infectious and non-infectious HIV-1 as well as by HIV-1 proteins [61,62], suggesting that viral particles and/or proteins trapped in the intercellular space of lymph nodes may be involved in promoting IFNaexpression by pDC. Indeed, recent studies found that viral gag proteins persist on the surface of the FDC network over prolonged periods of time even during controlled viral replication in the presence of HAART [63]. Alternatively, this may be the consequence of events set in motion during HIV-1 infection, but not sustained by ongoing viral replication. Once again, parallel studies conducted in pathogenic versus non-pathogenic SIV
models underscore the relevance of our findings in the context of HIV-1 infection. Indeed, pDC express copious amounts of IFNa during the acute and chronic phase of SIV infection in macaques, both in peripheral blood and in lymphoid tissues [54,64]. By converse, pDC express IFNain lymph nodes during the acute phase of SIV infection in the natural host, but IFNa
levels returns to baseline values during the chronic phase of the non-pathogenic infection [35]. Moreover, the amplitude of the IFNaresponse to SIV infection in natural hosts during the acute phase is reduced compared to non-natural hosts [29,35], reflecting a lower responsiveness of pDC from natural hosts to TLR7 and TLR9 stimuli [29].
Persistent activation of the immune system in the face of impaired immune responses is a hallmark of pathogenic lentiviral infection, and is a potent predictor of disease progression [2,3,4,5,6]. By contrast, non-pathogenic SIV infection is characterized by normal levels of immune activation despite vigorous viral replication [65]. The mechanism(s) at play in this phenomenon have been investigated, but remain elusive. Recently, several studies that bacterial translocation from the lumen of the gastro-intestinal tract following HIV-1 and SIV-mediated depletion of CD4+ T cells in the GALT might be
involved [66]. However, this hypothesis has been questioned because of the lack of bacterial translocation in non-pathogenic SIV infection despite CD4+ T cell depletion in the GALT
[66,67]. Recently, two reports suggested that over-expression of IFNa may be involved in driving persistent immune activation during HIV-1 infection. Sedaghat et al. reported that activated CD4+T cells from peripheral blood of untreated HIV-1 patients
are in a hyper-proliferative state under the modulation of IFNa
[31]. In addition, studies by Mandl et al. suggested that production of IFNa by pDC in SIV-infected non-natural hosts may drive the chronic immune activation and dysfunction leading to AIDS [29]. However, neither study addressed the mechanism underlying this phenomenon.
In summary, we showed that untreated HIV-1 infection is characterized by elevated expression of CCR7 and CD62L on plasmacytoid dendritic cells, which relocate to lymph nodes, acquire an activated but immature phenotype, and express elevated amounts of IFNa before undergoing cell death. Our results are in line with other reports suggesting a potential role for IFNain promoting chronic immune activation during HIV-1 and SIV infection. Further studies into this phenomenon may shed new light on the mechanisms of HIV-1 pathogenesis.
Figure 7. Increased rates of pDC apoptosis correlate with pDC frequency, IFNaexpression by LN-homed pDC, and HIV-1 viremia. Panels A, B and C: direct correlation between intensity of Annexin V staining on LN-homed pDC of HIV-1 patients and their frequency in LNMC, their ability to express IFNa, and the HIV-1 viral load in peripheral blood, respectively.
Acknowledgments
The authors wish to thank Robert C. Gallo and Davide Zella for continued support, helpful discussions and critical reading of the manuscript.
Author Contributions
Conceived and designed the experiments: CL AGD FR. Performed the experiments: CL ML NJ. Analyzed the data: CL AGD PH GF FR. Contributed reagents/materials/analysis tools: CL NJ JSW JvL FR. Wrote the paper: CL PH GF FR.
References
1. Brenchley JM, Douek DC (2008) HIV infection and the gastrointestinal immune system. Mucosal Immunol 1: 23–30.
2. Fahey JL, Taylor JM, Detels R, Hofmann B, Melmed R, et al. (1990) The prognostic value of cellular and serologic markers in infection with human immunodeficiency virus type 1. N Engl J Med 322: 166–172.
3. Giorgi JV, Liu Z, Hultin LE, Cumberland WG, Hennessey K, et al. (1993) Elevated levels of CD38+CD8+T cells in HIV infection add to the prognostic value of low CD4+T cell levels: results of 6 years of follow-up. The Los Angeles Center, Multicenter AIDS Cohort Study. J Acquir Immune Defic Syndr 6: 904–912.
4. Deeks SG, Kitchen CM, Liu L, Guo H, Gascon R, et al. (2004) Immune activation set point during early HIV infection predicts subsequent CD4+T-cell changes independent of viral load. Blood 104: 942–947.
5. Hunt PW, Brenchley J, Sinclair E, McCune JM, Roland M, et al. (2008) Relationship between T cell activation and CD4+T cell count in HIV-seropositive individuals with undetectable plasma HIV RNA levels in the absence of therapy. J Infect Dis 197: 126–133.
6. Boasso A, Shearer GM (2008) Chronic innate immune activation as a cause of HIV-1 immunopathogenesis. Clin Immunol 126: 235–242.
7. Biron CA, Cousens LP, Ruzek MC, Su HC, Salazar-Mather TP (1998) Early cytokine responses to viral infections and their roles in shaping endogenous cellular immunity. Adv Exp Med Biol 452: 143–149.
8. Durbin JE, Fernandez-Sesma A, Lee CK, Rao TD, Frey AB, et al. (2000) Type I IFN modulates innate and specific antiviral immunity. J Immunol 164: 4220–4228.
9. Stetson DB, Medzhitov R (2006) Type I interferons in host defense. Immunity 25: 373–381.
10. Sen GC, Ransohoff RM (1993) Interferon-induced antiviral actions and their regulation. Adv Virus Res 42: 57–102.
11. Der SD, Zhou A, Williams BR, Silverman RH (1998) Identification of genes differentially regulated by interferon alpha, beta, or gamma using oligonucle-otide arrays. Proc Natl Acad Sci U S A 95: 15623–15628.
12. Simon A, Fah J, Haller O, Staeheli P (1991) Interferon-regulated Mx genes are not responsive to interleukin-1, tumor necrosis factor, and other cytokines. J Virol 65: 968–971.
13. Kadowaki N, Antonenko S, Lau JY, Liu YJ (2000) Natural interferon alpha/ beta-producing cells link innate and adaptive immunity. J Exp Med 192: 219–226.
14. Gilliet M, Cao W, Liu YJ (2008) Plasmacytoid dendritic cells: sensing nucleic acids in viral infection and autoimmune diseases. Nat Rev Immunol 8: 594–606. 15. Siegal FP, Kadowaki N, Shodell M, Fitzgerald-Bocarsly PA, Shah K, et al. (1999) The nature of the principal type 1 interferon-producing cells in human blood. Science 284: 1835–1837.
16. Donaghy H, Pozniak A, Gazzard B, Qazi N, Gilmour J, et al. (2001) Loss of blood CD11c(+) myeloid and CD11c(-) plasmacytoid dendritic cells in patients with HIV-1 infection correlates with HIV-1 RNA virus load. Blood 98: 2574–2576.
17. Feldman S, Stein D, Amrute S, Denny T, Garcia Z, et al. (2001) Decreased interferon-alpha production in HIV-infected patients correlates with numerical and functional deficiencies in circulating type 2 dendritic cell precursors. Clin Immunol 101: 201–210.
18. Pacanowski J, Kahi S, Baillet M, Lebon P, Deveau C, et al. (2001) Reduced blood CD123+(lymphoid) and CD11c+(myeloid) dendritic cell numbers in primary HIV-1 infection. Blood 98: 3016–3021.
19. Soumelis V, Scott I, Gheyas F, Bouhour D, Cozon G, et al. (2001) Depletion of circulating natural type 1 interferon-producing cells in HIV-infected AIDS patients. Blood 98: 906–912.
20. Donaghy H, Gazzard B, Gotch F, Patterson S (2003) Dysfunction and infection of freshly isolated blood myeloid and plasmacytoid dendritic cells in patients infected with HIV-1. Blood 101: 4505–4511.
21. Pacanowski J, Develioglu L, Kamga I, Sinet M, Desvarieux M, et al. (2004) Early plasmacytoid dendritic cell changes predict plasma HIV load rebound during primary infection. J Infect Dis 190: 1889–1892.
22. Siegal F (2003) Interferon-producing plasmacytoid dendritic cells and the pathogenesis of AIDS. Res Initiat Treat Action 8: 10–13.
23. Francis ML, Meltzer MS, Gendelman HE (1992) Interferons in the persistence, pathogenesis, and treatment of HIV infection. AIDS Res Hum Retroviruses 8: 199–207.
24. Hyrcza MD, Kovacs C, Loutfy M, Halpenny R, Heisler L, et al. (2007) Distinct transcriptional profiles in ex vivo CD4+and CD8+T cells are established early in human immunodeficiency virus type 1 infection and are characterized by a chronic interferon response as well as extensive transcriptional changes in CD8+ T cells. J Virol 81: 3477–3486.
25. von Wussow P, Jakschies D, Block B, Tschechne B, Schedel I, et al. (1990) The interferon-induced Mx-homologous protein in people with symptomatic HIV-1 infection. AIDS 4: 119–124.
26. Zagury D, Lachgar A, Chams V, Fall LS, Bernard J, et al. (1998) Interferon alpha and Tat involvement in the immunosuppression of uninfected T cells and C-C chemokine decline in AIDS. Proc Natl Acad Sci U S A 95: 3851–3856. 27. Herbeuval JP, Shearer GM (2007) HIV-1 immunopathogenesis: how good
interferon turns bad. Clin Immunol 123: 121–128.
28. Lehmann C, Harper JM, Taubert D, Hartmann P, Fatkenheuer G, et al. (2008) Increased interferon alpha expression in circulating plasmacytoid dendritic cells of HIV-1-infected patients. J Acquir Immune Defic Syndr 48: 522–530. 29. Mandl JN, Barry AP, Vanderford TH, Kozyr N, Chavan R, et al. (2008)
Divergent TLR7 and TLR9 signaling and type I interferon production distinguish pathogenic and nonpathogenic AIDS virus infections. Nat Med 14: 1077–1087.
30. Lehmann C, Taubert D, Jung N, Fatkenheuer G, van Lunzen J, et al. (2009) Preferential upregulation of interferon-alpha subtype 2 expression in HIV-1 patients. AIDS Res Hum Retroviruses 25: 577–581.
31. Sedaghat AR, German J, Teslovich TM, Cofrancesco J, Jr., Jie CC, et al. (2008) Chronic CD4+T-cell activation and depletion in human immunodeficiency virus type 1 infection: type I interferon-mediated disruption of T-cell dynamics. J Virol 82: 1870–1883.
32. Herbeuval JP, Nilsson J, Boasso A, Hardy AW, Kruhlak MJ, et al. (2006) Differential expression of IFN-alpha and TRAIL/DR5 in lymphoid tissue of progressor versus nonprogressor HIV-1-infected patients. Proc Natl Acad Sci U S A 103: 7000–7005.
33. Brown KN, Trichel A, Barratt-Boyes SM (2007) Parallel loss of myeloid and plasmacytoid dendritic cells from blood and lymphoid tissue in simian AIDS. J Immunol 178: 6958–6967.
34. Malleret B, Karlsson I, Maneglier B, Brochard P, Delache B, et al. (2008) Effect of SIVmac infection on plasmacytoid and CD1c+myeloid dendritic cells in cynomolgus macaques. Immunology 124: 223–233.
35. Diop OM, Ploquin MJ, Mortara L, Faye A, Jacquelin B, et al. (2008) Plasmacytoid dendritic cell dynamics and alpha interferon production during Simian immunodeficiency virus infection with a nonpathogenic outcome. J Virol 82: 5145–5152.
36. Barron MA, Blyveis N, Palmer BE, MaWhinney S, Wilson CC (2003) Influence of plasma viremia on defects in number and immunophenotype of blood dendritic cell subsets in human immunodeficiency virus 1-infected individuals. J Infect Dis 187: 26–37.
37. Almeida M, Cordero M, Almeida J, Orfao A (2005) Different subsets of peripheral blood dendritic cells show distinct phenotypic and functional abnormalities in HIV-1 infection. AIDS 19: 261–271.
38. Dillon SM, Robertson KB, Pan SC, Mawhinney S, Meditz AL, et al. (2008) Plasmacytoid and myeloid dendritic cells with a partial activation phenotype accumulate in lymphoid tissue during asymptomatic chronic HIV-1 infection. J Acquir Immune Defic Syndr 48: 1–12.
39. Foussat A, Bouchet-Delbos L, Berrebi D, Durand-Gasselin I, Coulomb-L’Hermine A, et al. (2001) Deregulation of the expression of the fractalkine/ fractalkine receptor complex in HIV-1-infected patients. Blood 98: 1678–1686. 40. Schmidt B, Ashlock BM, Foster H, Fujimura SH, Levy JA (2005) HIV-infected cells are major inducers of plasmacytoid dendritic cell interferon production, maturation, and migration. Virology 343: 256–266.
41. Weinberg A, Louzao R, Mussi-Pinhata MM, Cruz ML, Pinto JA, et al. (2007) Quality assurance program for peripheral blood mononuclear cell cryopreser-vation. Clin Vaccine Immunol 14: 1242–1244.
42. Kleeberger CA, Lyles RH, Margolick JB, Rinaldo CR, Phair JP, et al. (1999) Viability and recovery of peripheral blood mononuclear cells cryopreserved for up to 12 years in a multicenter study. Clin Diagn Lab Immunol 6: 14–19. 43. Reimann KA, Chernoff M, Wilkening CL, Nickerson CE, Landay AL (2000)
Preservation of lymphocyte immunophenotype and proliferative responses in cryopreserved peripheral blood mononuclear cells from human immunodefi-ciency virus type 1-infected donors: implications for multicenter clinical trials. The ACTG Immunology Advanced Technology Laboratories. Clin Diagn Lab Immunol 7: 352–359.
44. Weinberg A, Zhang L, Brown D, Erice A, Polsky B, et al. (2000) Viability and functional activity of cryopreserved mononuclear cells. Clin Diagn Lab Immunol 7: 714–716.
45. de la Rosa G, Longo N, Rodriguez-Fernandez JL, Puig-Kroger A, Pineda A, et al. (2003) Migration of human blood dendritic cells across endothelial cell monolayers: adhesion molecules and chemokines involved in subset-specific transmigration. J Leukoc Biol 73: 639–649.
despite effective highly active antiretroviral therapy and increased blood myeloid dendritic cells in HIV-infected individuals. J Immunol 168: 4796–4801. 47. Tilton JC, Manion MM, Luskin MR, Johnson AJ, Patamawenu AA, et al. (2008)
Human immunodeficiency virus viremia induces plasmacytoid dendritic cell activation in vivo and diminished alpha interferon production in vitro. J Virol 82: 3997–4006.
48. Krathwohl MD, Schacker TW, Anderson JL (2006) Abnormal presence of semimature dendritic cells that induce regulatory T cells in HIV-infected subjects. J Infect Dis 193: 494–504.
49. Wilson NS, El-Sukkari D, Belz GT, Smith CM, Steptoe RJ, et al. (2003) Most lymphoid organ dendritic cell types are phenotypically and functionally immature. Blood 102: 2187–2194.
50. Dzionek A, Fuchs A, Schmidt P, Cremer S, Zysk M, et al. (2000) BDCA-2, BDCA-3, and BDCA-4: three markers for distinct subsets of dendritic cells in human peripheral blood. J Immunol 165: 6037–6046.
51. Panda A, Qian F, Mohanty S, van Duin D, Newman FK, et al. Age-associated decrease in TLR function in primary human dendritic cells predicts influenza vaccine response. J Immunol 184: 2518–2527.
52. Fonteneau JF, Larsson M, Beignon AS, McKenna K, Dasilva I, et al. (2004) Human immunodeficiency virus type 1 activates plasmacytoid dendritic cells and concomitantly induces the bystander maturation of myeloid dendritic cells. J Virol 78: 5223–5232.
53. Desai S, Chaparro A, Liu H, Haslett P, Arheart K, et al. (2007) Impaired CCR7 expression on plasmacytoid dendritic cells of HIV-infected children and adolescents with immunologic and virologic failure. J Acquir Immune Defic Syndr 45: 501–507.
54. Malleret B, Maneglier B, Karlsson I, Lebon P, Nascimbeni M, et al. (2008) Primary infection with simian immunodeficiency virus: plasmacytoid dendritic cell homing to lymph nodes, type I interferon, and immune suppression. Blood 112: 4598–4608.
55. Brown KN, Wijewardana V, Liu X, Barratt-Boyes SM (2009) Rapid influx and death of plasmacytoid dendritic cells in lymph nodes mediate depletion in acute simian immunodeficiency virus infection. PLoS Pathog 5: e1000413. 56. Lore K, Sonnerborg A, Brostrom C, Goh LE, Perrin L, et al. (2002)
Accumulation of DC-SIGN+CD40+dendritic cells with reduced CD80 and CD86 expression in lymphoid tissue during acute HIV-1 infection. AIDS 16: 683–692.
57. Graham LM, Brown GD (2009) The Dectin-2 family of C-type lectins in immunity and homeostasis. Cytokine 48: 148–155.
58. Dzionek A, Sohma Y, Nagafune J, Cella M, Colonna M, et al. (2001) BDCA-2, a novel plasmacytoid dendritic cell-specific type II C-type lectin, mediates antigen capture and is a potent inhibitor of interferon alpha/beta induction. J Exp Med 194: 1823–1834.
59. Wu P, Wu J, Liu S, Han X, Lu J, et al. (2008) TLR9/TLR7-triggered downregulation of BDCA2 expression on human plasmacytoid dendritic cells from healthy individuals and lupus patients. Clin Immunol 129: 40–48. 60. Meier A, Chang JJ, Chan ES, Pollard RB, Sidhu HK, et al. (2009) Sex
differences in the Toll-like receptor-mediated response of plasmacytoid dendritic cells to HIV-1. Nat Med 15: 955–959.
61. Yonezawa A, Morita R, Takaori-Kondo A, Kadowaki N, Kitawaki T, et al. (2003) Natural alpha interferon-producing cells respond to human immunode-ficiency virus type 1 with alpha interferon production and maturation into dendritic cells. J Virol 77: 3777–3784.
62. Herbeuval JP, Grivel JC, Boasso A, Hardy AW, Chougnet C, et al. (2005) CD4+ T-cell death induced by infectious and noninfectious HIV-1: role of type 1 interferon-dependent, TRAIL/DR5-mediated apoptosis. Blood 106: 3524–3531.
63. Popovic M, Tenner-Racz K, Pelser C, Stellbrink HJ, van Lunzen J, et al. (2005) Persistence of HIV-1 structural proteins and glycoproteins in lymph nodes of patients under highly active antiretroviral therapy. Proc Natl Acad Sci U S A 102: 14807–14812.
64. Abel K, Alegria-Hartman MJ, Rothaeusler K, Marthas M, Miller CJ (2002) The relationship between simian immunodeficiency virus RNA levels and the mRNA levels of alpha/beta interferons (IFN-alpha/beta) and IFN-alpha/beta-inducible Mx in lymphoid tissues of rhesus macaques during acute and chronic infection. J Virol 76: 8433–8445.
65. Silvestri G, Sodora DL, Koup RA, Paiardini M, O’Neil SP, et al. (2003) Nonpathogenic SIV infection of sooty mangabeys is characterized by limited bystander immunopathology despite chronic high-level viremia. Immunity 18: 441–452.
66. Brenchley JM, Price DA, Schacker TW, Asher TE, Silvestri G, et al. (2006) Microbial translocation is a cause of systemic immune activation in chronic HIV infection. Nat Med 12: 1365–1371.